Raw milk must be kept under refrigerated conditions to avoid spoilage. However, psychrotrophic gram negative bacteria, mainly Pseudomonas spp and some Enterobacteriaceae will grow (De Jonghe et al. Reference De Jonghe, Corewits, Van Hoorde, Messens, Van Landschoot, De Vos and Heyndrickx2013). Therefore, time/temperature control is essential to limit bacterial growth in the bulk milk tank at the farm. According to the European food hygiene legislation (Anon, 2004), milk must be cooled to 6 °C if the milk is collected every second day and to 8 °C for milk collected daily. European standard SS-EN 13732 (Anon, 2013) specifies the required cooling time from 35 to 4 °C. For a tank designed for four milkings and a performance temperature of 25 °C, the specified cooling time is 3 h. Under practical milking conditions a common requirement in Sweden is that the milk must be cooled to 4 °C within two to 3 h from the end of milking. However, there is no standard for the cooling of milk in automatic milking systems. During the last two decades, an increase in herd size, and the use of large silo tanks for milk storage along with an increased proportion of farms with robotic milking has been seen. There is some concern among milk quality advisors that slower cooling profiles than desirable are observed. Important factors governing the growth of psychrotrophic bacteria are the length of the lag phase which depends on the cooling profile and the final milk temperature. In order to better understand the impact of these factors a dynamic growth model based on psychrotrophic bacteria during cooling and storage in bulk milk tanks was developed.
Materials and methods
Predictive models
Conventional milking
Published information on growth rates of psychrotrophic bacteria or total counts at refrigeration temperatures in raw milk was sought (see online Supplementary Table 1). Most publications recorded growth rates at only one temperature and even fewer examined milk from different farms. None systematically reported on the length of the lag phase. However, (Tatini et al. Reference Tatini, Mekala, El-Habaz and Griffiths1991) developed a model based on the square root equation of Ratkowsky et al. (Reference Ratkowsky, Olley, McMeekin, Stokes and Ball1982). Growth was recorded at 7, 13, 21 and 30 °C for 84 native raw milk samples. They expanded their model with data from other investigations of raw milk (see further references in Tatini et al. Reference Tatini, Mekala, El-Habaz and Griffiths1991):
 $$\sqrt {{\rm \mu max}} = 0 \!\cdot\! 0303 \times (T - ( - 7 \!\cdot\! 34)),$$
where μmax is the maximum specific growth rate, T is the storage temperature in °C and T 0 is −7·34 °C. T 0 is a temperature obtained by extrapolation of the equation to zero growth rate. This equation was in good agreement with growth rates found in a study of the recontamination flora of 46 different samples of pasteurised milk (Griffiths & Phillips, Reference Griffiths and Phillips1988), see below. In addition, these authors published a square root model for the length of the lag phase.
Further modelling was done based on data from Griffiths & Phillips (Reference Griffiths and Phillips1988). In order to develop a dynamic growth model the duration of the lag phase (λ) as a function of the temperature profile must be calculated. The growth rate equation was:
 $$\sqrt {{\rm \mu max}} = 0 \!\cdot\! 031 \times (T - ( - 6 \!\cdot\! 9))$$
The relation between the lag phase and storage temperature was expressed:
 $$\sqrt {1/\lambda} = \; 0 \!\cdot\! 015 \times (T - (5 \!\cdot\! 7))$$
with the length of the lag phase in hours.
The equations were used to calculate h 0. H 0 is related to the physiological state of the cell and the adaptation work needed to complete the lag phase (Baranyi & Roberts, Reference Baranyi and Roberts1994). The average h 0 was estimated at 4·9 (±sd 0·6, n = 22).
The lag phase under dynamic conditions of cooling of raw milk was estimated by time – temperature integration based on the procedure of Koutsoumanis et al. (Reference Koutsoumanis, Pavlis, Nychas and Xanthiakos2010).
 $$\eqalign{& h_0 = \lambda \times \mu \cr& \lambda = 4 \!\cdot\! 9/(0 \!\cdot\! 031 \times (T - ( - 6 \!\cdot\! 9)^2)} $$
 $$\int_0^{t({\rm lag})} {\displaystyle{1 \over {T_{{\rm lag}}}}} dt = 1$$
where t(lag) is the total lag time and T lag is the part of the lag time consumed at a certain time interval dt at the corresponding temperature T t
 $$\int_0^{t({\rm lag})} {(4 \!\cdot\! 9/(0 \!\cdot\! 031 \times (T_t - {( - 6 \!\cdot\! 9))}^2)dt = 1} $$
The calculations were made in Microsoft Excel 2010. The time and temperature data of the cooling profile was entered and divided into suitable time intervals (5–15 min depending on the registrations in the management software on the farm). The average temperature of each interval was calculated by linear interpolation. The lag phase work was estimated for each interval and the times were added until the lag phase was completed. The bacterial growth for the time remaining at 4 °C until milk collection (normally 48 h) was calculated.
 $$^{10} {\rm Log}\;N{\rm} = ^{10}{\rm log}\;N_0 + (48 - \lambda ) \times {\rm \mu max}/{\rm ln}\,10$$
where N 0 is the initial concentration of psychrotrophic bacteria/ml in milk. Certain assumptions have been made for the calculations: The growth equation was assumed to be log-linear up to 30 °C. For temperatures above 30 °C μmax was kept constant at μmax30 °C which was assumed to be the optimal growth rate (Langeveld & Cuperus, Reference Langeveld and Cuperus1980). This, however, is of little consequence for the predictions as the time above 30 °C is short and μmax can be assumed to be lower above the optimum temperature. In conventional milking systems, milking is performed four times during 48 h. In the model calculations, the milk volume at each milking was assumed to be identical and the initial number of psychrotrophic bacteria was assumed to be identical each time (100 cfu/ml in order to compare different scenarios). Growth occurred only in milk from the first milking, due to long lag phases at low temperatures for the following milkings. Therefore, the final bacterial counts are the arithmetic average of four batches of milk, three of which contained 100 cfu/ml of bacteria.
Robotic milking
In robotic milking only milk from a single cow enters the bulk milk tank at each time interval. The bulk tank milk is continuously diluted with milk from the subsequent cows (to simplify calculations all milk was presumed to contain 100 psychrotrophic bacteria/ml initially, cf. De Jonghe et al. (Reference De Jonghe, Corewits, Van Hoorde, Messens, Van Landschoot, De Vos and Heyndrickx2013) and O'Connell et al. (Reference O'Connell, Ruegg, Jordan, O'Brien and Gleeson2016). For calculations, the time temperature profile was entered in Excel and the initial calculations were made according to the procedure above for conventional milking. Growth of bacteria in milk in each time interval and corresponding volume of milk were then treated as separate entities with individual length of the lag phase. Lag phase data was obtained by stepwise deletion of the previous step to obtain the length of the lag phase in the following step in Excel in the conventional model. Growth was calculated for the time remaining at 4 °C up to 48 h for each time interval. When no growth occurred (i.e. the lag phase was not completed), the concentration of bacteria remained at 100 cfu/ml. The number of bacteria/ml in each time interval was multiplied with the volume. A weighted average for the milk tank was calculated considering the total volume of milk.
Results and discussion
Validation of the model
Publications on growth rates of psychrotrophic bacteria in raw milk are not common. In online Supplementary Table 1, data on growth rates at 4 and 8 °C (calculated from tables and figures) are presented. Most are valid for a mixed flora in raw milk and range from μmax = 0·02 to 0·05 h−1 (10 log scale) at 4 °C. The model predicted μmax = 0·05 h−1 at 4 and 0·09 h−1 at 8 °C. Single strains of Pseudomonas fluorescens grow in raw goat's milk with μmax ranging from 0·017–0·036/h−1 and two strains of Ps. fragi with μmax = 0·042 and 0·060, respectively. It can be assumed that the fastest growing or most competitive strain will dominate in bulk tank milk (Tatini et al. Reference Tatini, Mekala, El-Habaz and Griffiths1991). De Jonghe et al. (Reference De Jonghe, Corewits, Van Hoorde, Messens, Van Landschoot, De Vos and Heyndrickx2013) studied growth of pseudomonads over time in raw milk in a simulated dairy chain from farm bulk tank to dairy silo at optimal (3·5 °C) or suboptimal storage temperature (6 °C). The predictions of the model were similar to their results with respect to lag times and growth rates. O'Connelll et al. (Reference O'Connell, Ruegg, Jordan, O'Brien and Gleeson2016) studied the effect of storage temperature and duration on the microbiological quality of bulk tank milk. They emphasised that dilution of bulk tank milk from subsequent milkings has to be taken into account to obtain correct results. Their results are in line with the predictions of the model.
Three phases during cooling
Cooling curves were collected from tanks for conventional milking for evaluation (see example in online Supplementary Fig. 1a). Cooling cannot be started immediately when the first milk enters the tank, due to the risk of freezing. A certain volume of milk e.g. 5% of the tank volume must be collected before cooling can commence. During this first phase, the milk is warm at approximately 30 °C. In a second phase, the cooling progresses rapidly due to effective cooling of the initial volume of milk. In a third phase cooling continues at a slower rate to 4 °C, since warm milk continues to enter the tank during milking. Based on the shape of actual cooling curves simplified linear three phase cooling curves were created (Phase 1: 30 °C; phase 2: 30–10 °C; phase 3: 10–4 °C, see online Supplementary Fig. 1b), to explore the impact of the three phases on growth under standardised cooling conditions. Actual temperature profiles may differ, but still have a similar shape. In tanks for robotic milking, various technical solutions enable restricted cooling of milk until full cooling capacity can be applied.
Conventional milking
Simplified growth calculations for a conventional tank were made to explore the impact of the three phases. The initial bacterial counts in milk were set to 100 cfu/ml in all calculations. As expected, the time before cooling was the most critical. Under favourable conditions, i.e. cooling from 30–10 °C and from 10–4 °C within 1 h each, there was almost no growth. However, there was notable growth which increased with the time at 30 °C, e.g. 4700/ml after 3 h with a cooling rate of 10 °C/h between 30 and 10 °C.
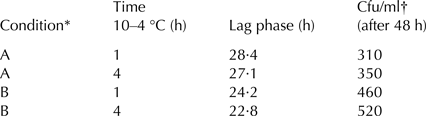
Online Supplementary Table 2 shows the effect of cooling rate during the second phase from 30 °C. Slow cooling leads to markedly reduced lag times and thus to increased bacterial counts. However, cooling at a rate of 10–20 °C/h from 30 to 10 °C seems acceptable (cf. Table 1 above).
Table 1. Predicted growth of psychrotrophic bacteria in milk with different cooling rates between 10 and 4 °C

* A, 1 h at 30 °C, 1 h from 30–10 °C; B, 1 h at 30 °C, 2 h from 30–10 °C.
† Initial level of bacteria was set 100 cfu (colony forming units)/ml.
The rate of cooling between 10 and 4 °C had surprisingly little effect on bacterial growth (Table 1) if the milk is cooled rapidly to 10 °C. Even 4 h of cooling time to 4° is of no consequence. This is important knowledge to milk advisors who encounter similar observations in practice in the absence of increased bacterial counts.
Robotic milking
Cooling profiles from farms were collected and evaluated. First, calculations were made according to the procedure for a tank with conventional milking. Second, calculations were repeated, taking into account the restricted flow of milk during robotic milking (see materials and methods). Interestingly, bacterial growth was always less for robotic than for conventional milking (Fig. 1). In particular, the difference was largest when cooling profiles with extremely slow cooling were evaluated (data not shown). During robotic milking small volumes of milk from one cow enters the tank per time unit. In one technique, cooling is started immediately at a low intensity corresponding to the volume of milk. Only a few hundred litres of milk will enter the tank per hour during the initial cooling phase and will be cooled continuously. Therefore, a smaller fraction of the milk will experience high temperature as compared to conventional milking. Thus, only bacteria from this fraction will grow (and be further diluted), the remaining will not complete the lag phase. Other robotic milking systems have other solutions that achieve the same result. In conventional milking, approximately 1/4 of the volume will enter in a few hours. There will be more bacterial growth and the bacteria will be less diluted.

Fig. 1. Cooling profiles in milk bulk tanks from two different robotic milking systems. Bacterial growth for 48 h was predicted from the temperature curves under conditions of conventional as well as robotic milking. (a) Long cooling time from 10 to 4 °C. Conventional milking: 400 cfu/ml. Robotic milking: 130 cfu/ml. (b) Somewhat slower initial cooling phase, very rapid cooling from 10 to 4 °C. Conventional milking: 530 cfu/ml; robotic milking: 160 cfu/ml.
In conclusion, it is predicted that slow cooling rate of milk below 10 °C is of little importance for bacterial growth. It is proposed that bacterial growth in milk from robotic milking will result in lower bacterial counts than milk from conventional milking with the same cooling profile. The information on the insignificant effect of the cooling rate below 10 °C may be useful in the development of a standard.
Supplementary material
The supplementary material for this article can be found at https://doi.org/10.1017/S0022029917000334.
This work was supported by the Swedish dairy industry and by Dairy Sweden.