


Milk is a complex food that has evolved to provide a complete range of essential nutrients and a wide variety of bioactive components whose consumption supports growth, protection and competitive survival to newborns. Milk is also a highly efficient lipid-delivery system providing a range of complex, insoluble lipids as dispersed particles containing a mix of tri- and diglycerides, complex lipids and liposoluble substances in the form of globules with structural properties distinct from other biological sources of fats. On average, 96% of milk fat is composed of triglycerides containing a high proportion of saturated fatty acids (SFA), mainly myristic acid (14:0; ∼10%), palmitic acid (16:0; ∼28%) and stearic acid (18:0; ∼12%); a high amount of monounsaturated fatty acids (18:1 cis-9; ∼24%), and a low amount of (poly)unsaturated fatty acids (PUFA; ∼5%) (Jensen, Reference Jensen2002; O'Donnell-Megaro et al. Reference O'Donnell-Megaro, Barbano and Bauman2011). Fatty acids of chain length C4 to C14 plus a portion of the C16 are derived from de-novo synthesis within the mammary gland (Bauman & Griinari, Reference Bauman and Griinari2003) and hence, are potentially amenable to considerable control via genetic and biochemical means. A diversity of dairy foods of widely differing composition is processed from milk. The identification of natural sources of variation in genes that determine the quantity, composition and structure of lipids in milk will provide the knowledge to tailor lipid composition of this uniquely valuable agricultural commodity.
From a biological perspective and from an economic perspective, milk fat plays a central role in the value of milk. It is a major contributor to the energy density of whole milk and is essential to many of the physical properties, manufacturing qualities and organoleptic characteristics of dairy products (Harvatine et al. Reference Harvatine, Boisclair and Bauman2009). The natural sources of variation, such as feeding or genetics, have been observed to influence milk composition, and they can become a toolset of independent controllers to explicitly modify the concentrations of fatty acids for functional and health targets. Diet and nutritional management have a major impact on milk content and fatty acid composition of milk fat (e.g. Palmquist et al. Reference Palmquist, Beaulieu and Barbano1993). In addition, recent studies show that a significant proportion of milk fatty acid composition is determined by genetics, indicating that selective breeding can be an effective means to alter the nutritional quality of milk fat (Soyeurt et al. Reference Soyeurt, Dardenne, Gillon, Croquet, Vanderick, Mayeres, Bertozzi and Gengler2006; Schennink et al. Reference Schennink, Stoop, Visker, Heck, Bovenhuis, van der Poel, van Valenberg and van Arendonk2007; Soyeurt et al. Reference Soyeurt, Gillon, Vanderick, Mayeres, Bertozzi and Gengler2007).
A large body of evidence from studying the causes of heart disease has been assembled to understand basic metabolic control of lipid metabolism in animals and humans. A group of genetic elements has been identified as fundamental to overall metabolic control including the sterol regulatory element-binding proteins (SREBPs) which are physiological regulators of lipid synthesis, controlling the expression of more than 30 genes involved in cholesterol, fatty acid, triglyceride, and phospholipid metabolism (McPherson & Gauthier, Reference McPherson and Gauthier2004; Shimano, Reference Shimano2009). Recently, QTL studies, genome-wide association scans and functional genomics analyses established that genes in the SREBP transcription factor family are key regulators of milk fat synthesis and secretion (Harvatine et al. Reference Harvatine, Boisclair and Bauman2009; Ogorevc et al. Reference Ogorevc, Kunej, Razpet and Dovc2009; Stoop et al. Reference Stoop, Schennink, Visker, Mullaart, van Arendonk and Bovenhuis2009; Conte et al. Reference Conte, Mele, Chessa, Castiglioni, Serra, Pagnacco and Secchiari2010). In this study, we performed a marker-trait association analysis to identify genetic variation associated with milk fat composition in candidate genes in the SCD/SREBP signalling pathway. Genes included in the analysis were: Sterol regulatory element-binding protein-1 (SREBP1), SREBP cleavage-activating protein (SCAP), insulin-induced protein 1 (INSIG1), insulin-induced protein 2 (INSIG2), membrane-bound transcription factor protease, site 1 (MBTPS1), membrane-bound transcription factor protease, site 2 (MBTPS2), and stearoyl coenzyme-A desaturases (SCD1 and SCD5).
SCD, also named delta-9 desaturase, catalyses an essential step in the synthesis of unsaturated fatty acids introducing a cis-double bond between carbons 9 and 10 of fatty acids with a chain length of 10–18 carbons in the mammary gland and adipose tissues (Bauman et al. Reference Bauman, Mather, Wall and Lock2006). Investigations using different analytical methods indicate that about 50% of the oleic acid and up to 90% of the cis-9,trans-11 conjugated linoleic acid (CLA) in bovine milk is formed due to the activity of this enzyme in the mammary gland (Keating et al. Reference Keating, Stanton, Murphy, Smith, Ross and Cairns2005; Palmquist et al. Reference Palmquist, Lock, Shingfield and Bauman2005; Mosley & McGuire, Reference Mosley and McGuire2007). To date, two SCD isoforms have been identified and characterized in the bovine: SCD1 and SCD5. SCD5 is expressed mainly in the brain and its contribution to mammary SCD activity has not been discovered (Lengi & Corl, Reference Lengi and Corl2007).
SREBP1 is a transcription factor residing as an inactive precursor in the ER membrane and is transported to the Golgi for proteolytic cleavage prior to entering the nucleus and activation of sterol responsive element-containing genes (e.g. SCD). SREBP1 is transported from the ER to the Golgi through the action of the escort protein SCAP. INSIG1 and INSIG2 are proteins that interact with SCAP and regulate the responsiveness of SREBP1 processing via SCAP. In the Golgi apparatus two proteases (MBTPS1 and MBTPS2) act to release the transcriptionally active SREBP1 which translocates to the nucleus where it binds to sterol regulatory elements (SREs) on target genes (McPherson & Gauthier, Reference McPherson and Gauthier2004; Saltert & Tarling, Reference Saltert and Tarling2007).
In the present study, the coding and conserved non-coding regions of candidate genes in the SREBP1 signalling pathway and SCD were resequenced, and tag SNP were identified and used to perform a marker-trait association study with milk fatty acid profiles in Holstein cattle.
Materials and Methods
Animals, sampling and diet
Cow population:
Milk and blood samples were collected from 423 Holstein cows from five free-stall dairy farms in the California Central Valley. Cows were selected in their 1st or 2nd parity and 100–150 days in milk to avoid the period of negative energy balance in early lactation and to maximize the period of de-novo milk fat synthesis in the mammary gland. Therefore, only mature milk was analysed in this study. Winter single morning milk samples were collected in triplicate during the routine USDA/DHIA sampling procedure and kept on ice until the composition analysis was performed. Milk composition analysis including lactose content, somatic cell count (SCC), milk urea nitrogen (MUN), fat percentage (FatP), protein percentage (ProtP), casein percentage (CasP) and total solids was performed at Silliker Laboratories (Modesto CA, USA). Milk yield information was collected from the USDA/DHIA genetic evaluation procedure.
Milk fatty acid analysis:
An aliquot of milk was centrifuged to obtain the milk fat cake. The milk fat was then extracted using the procedure of (Hara & Radin (Reference Hara and Radin1978), and transmethylation of the esterified FA was performed according to Christie (Reference Christie1982) as modified by Chouinard et al. (Reference Chouinard, Corneau, Barbano, Metzger and Bauman1999). Briefly, hexane:isopropanol was used to extract the milk fat, and sodium methoxide served as the methylation reagent. Fatty acid methyl esters were quantified by GC (Hewlett Packard GCD system HP 6890+; Hewlett-Packard, Avondale PA, USA) fitted with a CP-Sil 88 fused-silica capillary column (100 m × 0·25 mm i.d. with 0·2-μm film thickness; Varian Instruments, Walnut Creek CA, USA). The initial oven temperature was set at 80°C and increased to 190°C at 2 deg/min and maintained for 20 min, then increased to 225°C at 10 deg/min and maintained for 12 min. Fatty acid peaks were identified and recoveries quantified using pure methyl ester standards (GLC-569, NuChek Prep, Elysian MN, USA). In addition, a butter oil reference standard (CRM 164; Commission of the European Communities, Community Bureau of Reference, Brussels, Belgium) was periodically analysed to verify column performance and correction factors for individual fatty acids.
Feed samples:
The cows used in this trial were in the high-yielding and/or mid-lactation groups. In all cases, feeds were supplied as total mixed ration (TMR). Records of the diets, including the main dietary ingredients, were taken in each dairy farm. Representative samples of TMR were taken by hand (25–30 small samples) through all the feed bunk (about 1 kg in total), mixed and maintained in zipped bags cooled with ice. TMR samples were analysed for dry matter (DM), crude protein (CP), neutral detergent fibre (NDF), acid detergent fibre (ADF), acid detergent insoluble CP (ADICP), crude fat (CF), total digestible nutrients (TND), and the correspondent estimated net energy for lactation (NEL), maintenance (NEM) and growth (NEG) at the Dairy One Forage Testing Laboratory (Ithaca NY, USA) using dry chemistry Near Infrared Reflectance Spectroscopy (Foss NIRSystems Model 6500 with Win ISI II v1.5 – AOAC 989.03).
Phenotypes:
Fatty acid (FA) analysis: the variables considered were individual FA from C4 to C20, saturated fatty acid content (SFA), monounsaturated fatty acid content (MUFA), polyunsaturated fatty acid content (PUFA), short-chain FA (C4 and C6) medium-chain FA (C8 to C16 C), long-chain FA (>C16); trans FA (all trans isomers), cis-9,trans-11 conjugated linoleic acid (CLA 9-11) and trans-10,cis-12 CLA (CLA 10-12) content. The extent of FA desaturation was determined by calculating the ratio of cis-9 unsaturated to cis-9 unsaturated + saturated for the different FA (Kelsey et al. Reference Kelsey, Corl, Collier and Bauman2003). The following ratios were calculated: desaturation index for 14:0 (DI14) 14:1cis-9/(14:1 cis-9+14:0); desaturation index for 16:0 (DI16) 16:1cis-9/(16:1cis-9+16:0); desaturation index for 18:0 (DI18) 18:1cis-9/(18:1cis-9+18:0). Ratio SFA/UFA was calculated as the sum of SFA divided by the sum of UFA (MUFA + PUFA).
SNP discovery
Genomic sequences for eight candidate genes in the SREBP1 pathway and SCD were obtained from the bovine Btau4.0 assembly (http://www.ncbi.nlm.nih.gov/genome/guide/cow/index.html). The genes are: SREBP1, SCAP, INSIG1, INSIG2, MBTPS1, MBTPS2, SCD1 and SCD5.
Conserved non-coding regions of each gene were identified using Genome VISTA (Couronne et al. Reference Couronne, Poliakov, Bray, Ishkhanov, Ryaboy, Rubin and Pachter2003) with genomic alignments to human, mouse, rat, dog, opossum, fugu and chicken. Coding regions and the conserved non-coding regions of candidate genes were resequenced (SeqWright DNA Technology Services, Houston TX, USA). Resequencing was performed in a DNA resource population specifically developed for SNP discovery (Rincon et al. Reference Rincon, Thomas and Medrano2007). In brief, this population consists of eight animals of each of the three major dairy breeds (Holstein, Jersey and Brown Swiss) that are unrelated at least three generations back in their pedigrees.
Polymorphisms among and within breeds were analysed using CodonCode aligner software (http://www.codoncode.com) and gene sequences, and SNP were assembled and annotated in Vector NTI advance 10.1.1 software (Invitrogen, Carlsbad CA, USA). Linkage disequilibrium (LD) regions were identified using Haploview software (Barrett et al. Reference Barrett, Fry, Maller and Daly2005) with a minimum genotyped percentage of 80, Hardy Weinberg (HW) P-value cutoff of 0·01, and minimum minor allele freq (MAF) of 0·01. Tags SNP were determined with the Tagger tool of Haploview with an r 2 greater than 0·8 and a log of odds (LOD) threshold of 3.
Variation in coding regions was analysed using computational algorithms such as SIFT (Sorting Intolerant From Tolerant) (http://blocks.fhcrc.org/sift/SIFT.html) and Polyphen (Polymorphism Phenotyping) (http://coot.embl.de/PolyPhen/) to predict whether an amino acid substitution affects protein function and to prioritize amino acid substitutions for further study. Non-synonymous SNP were forced into the tag list created in Haploview.
SNP genotyped
High-quality DNA was extracted from blood samples using the Gentra PureGene Blood DNA Purification Kit from Qiagen (catalog number 158445). A total of 47 Tag SNP were used to develop genotyping assay to perform association studies (Table 1). SNP were genotyped in 423 cow DNA samples using an allele discrimination by MALDI-TOF mass spectrometry platform (Sequenom MassARRAY(R)) (Neogen/GeneSeek Inc., Lincoln NE, USA).
Table 1. Description of tag SNP used in the marker-trait association study
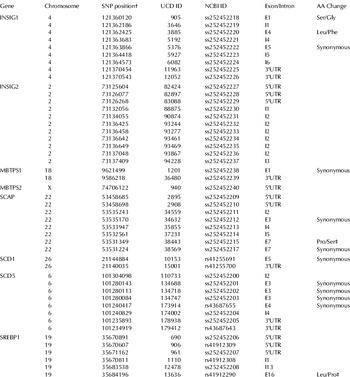
† SNP position is annotated according to the Btau_4.0 genome assembly
‡ Amino acid change not tolerated based on SIFT and Polyphen analysis
Recently, Schennink et al. (Reference Schennink, Stoop, Visker, Heck, Bovenhuis, van der Poel, van Valenberg and van Arendonk2007) and Bouwman et al. (Reference Bouwman, Bovenhuis, Visker and van Arendonk2010) showed that DGAT1 (acyl CoA diacylglycerol acyltransferase) polymorphisms had a large effect on the ratio of saturated to unsaturated milk fatty acids, and for this reason we decided to include marker DGAT1-K232A in the study to analyse the effect in our Holstein population. Genotypes were assigned as defined in the literature: DGAT1 (AA, KA, KK) (Winter et al. Reference Winter, Kramer, Werner, Kollers, Kata, Durstewitz, Buitkamp, Womack, Thaller and Fries2002).
Data processing and statistical analysis
Association analysis: Marker-trait association analysis was performed using a linear regression test under an additive model assumption. Statistical analyses were performed using the genotype association and regression modules from SNP Variation Suite (SVS) Version 7 (Golden Helix Inc., Bozeman MT, USA). A similar approach was successfully used to analyse tag SNP on BTA4 associated with milk production traits (Rincon et al. Reference Rincon, Islas-Trejo, Casellas, Ronin, Soller, Lipkin and Medrano2009b) and to analyse the association of tag SNP within the bovine STAT6 gene and carcass traits in feedlot cattle (Rincon et al. Reference Rincon, Farber, Farber, Nkrumah and Medrano2009a). In brief, the adjusted phenotype, y, was fitted to every encoded genotype under an additive model assumption, x, and was represented with the following equation:
where y was the adjusted phenotype, b 1x + b 0 represented the model and the error term, ε, expressed the random residual effect.
Statistical significance of three fixed effects: (herd, parity and days in milk) were tested to adjust phenotypes for systematic environmental effects using a full (including covariates) versus reduced model regression equation. The regression sums of squares were calculated both for the reduced and for the full model. An F test was then performed to find the significance of the full versus the reduced model. A P-value threshold of 0·01 was used to establish significant associations. Only herd effect was statistically significant, therefore, adjusted phenotypes were obtained for all 423 samples.
The linear regression was also performed including SNP interactions using the SVS version 7 regression module from Golden Helix. False discovery rate (FDR) was controlled according to the method of Storey (Reference Storey2002) and a cut-off for significant association values was set at FDR q value <0·1.
Information on cow pedigrees was obtained before collecting the samples. Cows were carefully selected to maximize variation and to minimize inbreeding in samples with similar stage of lactation and days in milk. No more than 5 daughters from the same sire were used in the association study. The effect of the sire was also tested in the study using a linear regression model, and no sire effects were observed in our samples.
In a second analysis, data were adjusted for the effects of DGAT1 K232A genotypes. The original model and the DGAT1 corrected model were compared to estimate the level of significance and allele substitution effects (ASE).
Cows used for this analysis corresponded to dairy herds numbered 1 to 4 (371 samples). The cows from dairy herd number 5 were experiencing low-fat milk syndrome. This condition, also referred to as diet-induced milk fat depression (MFD), is characterized by a decrease in milk fat yield of up to 50%, with no change in milk yield or in the yield of other milk components (Bauman & Griinari, Reference Bauman and Griinari2003). In this particular herd, fat percentage ranged fron 2·09% to 4·46% and 40% of the cows had fat percentage values below 2·6%. In order to assess the contribution of markers for SCD and the SREBP1 signalling pathway to MFD, cows from herd 5 were used to perform a linear regression analysis including all tag SNP.
Results and Discussion
Genes in the SREBP1 pathway play a central role in regulation of milk fat synthesis, especially de-novo synthesized saturated FA. Likewise, SCD plays a major role in determining the monounsaturated FA, primarily oleic acid, and the CLA content of milk fat. In the present study, we discovered SNP in candidate genes associated with these proteins to identify genetic markers that can be used for genetic and metabolically directed selection in cattle. Forty-seven tag SNP were genotyped in 423 Holstein cows from 5 dairy herds. Polymorphisms in genes were located according to the annotated Btau4.0 genome assembly; 13 SNP were located in exons, 9 were synonymous and 4 were non-synonymous SNP. SIFT and Polyphen analyses were performed in the non-synonymous SNP and two polymorphisms were not tolerated. SNP (ss252452215) causes an amino acid change Pro/Ser in the SCAP protein and SNP (rs41912290) corresponds to an amino acid change Leu/Pro in the SREBP1 protein. Detailed description and location of tag SNP are shown in Table 1.
Feed sample analysis:
The main dietary ingredients used for the total mixed ration (TMR) included the following components: as forages, corn silage, alfalfa hay and oats hay. Rolled corn was the only grain used. As byproducts, canola meal, soybean meal, dry and wet DDG (dry distillers grains) beet pulp, whole cottonseeds, soy hulls, corn germ, cheese whey and molasses. All the diets included a blend of feed additives, minerals and vitamins. These ingredients are the typical feeds used for lactating cows in the California dairy farms.
Table 2 contains a description of TMR chemical composition. The average dietary CP content was high based on the requirements for dairy cattle (NRC, 2001). The average dietary level of fat (6%) is in accordance with NRC requirements and indicate that diets were probably supplemented with other fat sources different from the ingredients previously described. The other nutrient contents are close to the NRC recommendations for high-yielding dairy animals.
Table 2. Chemical composition of total mixed rations (average n=10)
Marker-trait association:
Descriptive statistics for milk production traits and FA profiles are shown in Table 3. Fat percentage and ratio of SFA/UFA were significantly different in cows with MFD (herd 5) when compared with unaffected cows in the study.
Table 3. Descriptive statistics of milk production traits and fatty acid groups by herd (mean and phenotipic standard deviations of the traits)

† significantly different values (P<0·001) in cows with MFD (herd 5) when compared to unaffected cows in the study
‡ Fatty acids are expressed as g/100 g of total fatty acids. SFA, saturated fatty acids; MUFA, monounsaturated fatty acids; PUFA, polyunsaturated fatty acids; SFA/UFA, saturated fatty acids/ unsaturated fatty acids ratio; DI14, DI16, DI18, desaturation indexes for 14:0, 16:0 and 18:0 respectively; CLA9-11, cis-9, trans-11 conjugated linoleic acid
Marker-trait association results revealed 17 SNP associated with FA traits and desaturation indexes (Tables 4 and 5). SCD5-ss252452204 and INSIG2-ss252452236 were the most representative markers associated with SFA/UFA ratio. The percentage of the phenotipic variation explained for these markers ranged between 4% and 7%. In this study, DGAT1 explained 6% of the phenotipic variation of SFA/UFA ratio. In studies by Bouwman et al. (Reference Bouwman, Bovenhuis, Visker and van Arendonk2010) and Bouwman et al. (Reference Bouwman, Bovenhuis, Visker and van Arendonk2011) DGAT1 explained a large proportion of the additive genetic variation of SFA/UFA ratio (38·3%) and was also associated with 6:0, 8:0, 14:0, 16:0, 10:1, 12:1, 14:1, 16:1, 18:1 and CLA in milk. Despite the large genetic variation effect of DGAT1 observed in these studies, the phenotypic variation explained by this marker in our study is much smaller and very similar in magnitude to the overall effect of SCD1. The total phenotypic variation explained by DGAT1 and SCD1 is less than 13%, suggesting that FA traits in milk are highly influenced by the environment, and the genetic effects are determined mainly by the effects of DGAT1 and SCD1 and the contribution of a large number of genes with small effects. When we accounted for DGAT1 effects including K232A marker in our model, the percentage of variance explained by SCD5 (7%) and INSIG2 (4%) increased by 3%, so it is likely that DGAT1 alleles are also representing some of the effects observed in SCD5 and INSIG2. Interaction among markers was also tested in the association analysis and it was observed that allele combinations of INSIG2-ss252452236/SCD5-ss252452202 polymorphisms were also significantly associated (P<0·0001) with saturated fat and CLA9-11 content in milk. INSIG2-ss252452236 allele C was associated with a decrease in saturated FA, increase in PUFA, 14:1/14:0 ratio and increase in CLA9-11 content. Recently, INSIG2 gene variants were also associated with BMI, adiposity and biochemical indicators of glucose homeostasis in humans and mice (Fornage et al. Reference Fornage, Papanicolaou, Lewis, Boerwinkle and Siscovick2010; Zavattari et al. Reference Zavattari, Loche, Civolani, Pilia, Moi, Casini, Minerba and Loche2010).
Table 4. Allele substitution effects of markers associated with fatty acid indexes in Holstein cows

† Original values correspond to allele substitution effect (ASE) and P-values before correcting for DGAT1-K232A effect in the model
‡ MAF: Minor allele frequency (MAF refers to the allele of the previous column)
§ Allele substitution effect for SFA, MUFA and PUFA is expressed as g/100 g of total fatty acids. N/S: Not significant
Table 5. Marker-trait association results for desaturation indexes in Holstein cows

† Original values correspond to allele substitution effect (ASE) and P-values before correcting for DGAT1-K232A effect in the model
‡ MAF: Minor allele frequency (MAF refers to the allele of the previous column)
§ DI14=14:1 cis-9/14:1 cis-9+14:0
¶ DI16=16:1 cis-9/16:1 cis-9+16:0
†† DI18=18:1 cis-9/18:1 cis-9+18:0
N/S: Not significant
The bovine stearoyl-CoA desaturase 5 gene is similar to human SCD5 and is highly expressed in the brain (Lengi & Corl, Reference Lengi and Corl2007). In a previous study performed in our laboratory we analysed the mammary gland transcriptome using high-throughput RNA sequencing technology, and we observed that SCD5 gene was expressed in mammary gland cells (Canovas et al. Reference Canovas, Rincon, Islas-Trejo, Wickramasinghe and Medrano2010). In the present association study, SCD5-ss252452204 allele G was associated with a decrease in SFA/UFA ratio, increase in MUFA, DI14 ratio and CLA9-11 content in milk. SCD5-ss252452202 allele T was associated with an increase in SFA and decrease in MUFA, whereas rs43687643 allele T was associated with a decrease in SFA and an increase in PUFA in Holstein cattle. The identification of genes and polymorphisms responsible for the variation of milk fat composition described herein, provides useful information that can be combined with breeding programmes to tailor FA content in bovine milk.
Desaturation indexes:
The analysis of desaturation activity indicators highlighted a significant effect of the SCD polymorphisms on the desaturation indexes DI14, DI16 and DI18.
As shown in Table 5, several markers were associated with desaturation indexes, but after correcting for DGAT1, only SCD1 and SCD5 remained significant in the analysis. In terms of explained variance, the contribution of SCD1 and SCD5 genotype to desaturation indexes was 5% and 3%, respectively. These results are in agreement with other studies (Mele et al. Reference Mele, Conte, Castiglioni, Chessa, Macciotta, Serra, Buccioni, Pagnacco and Secchiari2007; Kgwatalala et al. Reference Kgwatalala, Ibeagha-Awemu, Mustafa and Zhao2009). After DGAT1 correction the SCD1 effects increased to 6% for DI14; 13% for DI16 and 10% for DI18. The DI14 desaturation index is considered the best indicator of desaturase activity because the product (14:0) originates almost exclusively from de-novo synthesis in the mammary gland (Lock & Garnsworthy, Reference Lock and Garnsworthy2003). In fact, 90% of 14:1cis-9 is the result of SCD activity (Mosley & McGuire, Reference Mosley and McGuire2007). Heritability for the ratios of 14:1cis-9 to 14:0, 16:1cis-9 to 16:0, and 18:1cis to 18:0 were 20%, 20% and 3%, respectively (Soyeurt et al. Reference Soyeurt, Dehareng, Mayeres, Bertozzi and Gengler2008). We observed two markers in the SCD1 gene (rs41255700 and rs41255691) associated not only with desaturation index DI14, but also with DI16 and DI18 in bovine milk. These two SCD1 markers were in LD r 2=0·8 in Holstein cattle. In particular, SNP rs41255691 is located on exon 5 and it is in complete LD with the SNP that causes the substitution of Ala to Val on residue 293 (A293 V) which has been previously reported to be associated with milk FA composition (Mele et al. Reference Mele, Conte, Castiglioni, Chessa, Macciotta, Serra, Buccioni, Pagnacco and Secchiari2007; Conte et al. Reference Conte, Mele, Chessa, Castiglioni, Serra, Pagnacco and Secchiari2010). Our results showed that SCD1 and SCD5 genotypes contribute to the variation of desaturation indexes in cows' milk.
Effect of SREBP1 variants on MFD: Milk fat depression results from an interaction between ruminal fermentation processes and mammary tissue metabolism (Bauman & Griinari, Reference Bauman and Griinari2003). A decreased mammary capacity for lipid synthesis is observed due to a coordinated transcriptional down regulation of enzymes and proteins involved in milk fat synthesis. Baumgard et al. (Reference Baumgard, Matitashvili, Corl, Dwyer and Bauman2002) proposed the SREBP1 gene as a central gene related to MFD. Recent research has established that mammary expression of genes in the SREBP1 signalling pathway were decreased during CLA-induced and diet-induced milk fat depression (Harvatine & Bauman, Reference Harvatine and Bauman2006; Harvatine et al. Reference Harvatine, Boisclair and Bauman2009). In the present study, SNP rs41912290 in the SREBP1 gene accounted for 40% of the phenotypic variance observed in cows with low-fat milk syndrome. Cows with genotype CC had consistently a lower fat content than cows with genotype CT and TT (ASE=−0·8) (Fig. 1a). Cows with reduced fat content also showed higher levels of 18:3, 18:1,trans12, 18:1,trans11, 18:1,trans10 and 18:1,trans9 fatty acids (Fig. 1b). The effect of marker rs41912290 was only observed in cows with MFD. Interestingly, this polymorphism is located on exon 14 in the SREBP1 gene causing an amino acid change that was not tolerated according to SIFT and Polyphen analyses. The fact that we did not observe any association of this marker in cows without MFD suggests that this SNP becomes a key player in situations where the SREBP1 pathway is under enviromental perturbations, as in the case of diet-induced MFD. The genetic knowledge generated in this study can now be combined with nutritional information to strategically develop management schemes to control milk fat content and explicitly guide the composition of saturated, monounsaturated and polyunsaturated fatty acid levels in cows' milk.

Fig. 1. Effect of SREBP1 SNP rs41912290 on (a) fat percentage and (b) content of polyunsaturated fatty acids (PUFA) in Herd 5 that had a significant milk fat depression (MFD).
Identifying the genes responsible for phenotypic variation is important not only to increase our understanding of milk FA synthesis, but also to enhance opportunities to improve milk-fat composition in cattle. In summary, polymorphisms in the SCD5 and INSIG2 genes were the most representative markers associated with SFA/UFA ratio in milk. Based on the analysis of desaturation activity we observed that markers in the SCD1 and SCD5 genes showed the most significant effects. In the herd with MFD, only one SNP in the SREBP1 gene (rs41912290) accounted for 40% of the phenotypic variance. The majority of the significantly associated genes in this study were located on genomic regions that were previously identified as quantitative trait loci for milk fat yield or content; DGAT1, SCD1 and SREBP1 are some examples described by Bouwman et al. (Reference Bouwman, Bovenhuis, Visker and van Arendonk2011). These results provide a detailed genetic demonstration of the overarching principle that genotyping SNP in key genes in the SREBP1 signalling pathway and SCD genes will bring significant opportunities to select Holstein cattle to improve nutritional and technological aspects of milk.
We thank the dairy producers in Merced County, California for providing access to milk samples. We thank Silliker Laboratories (Modesto CA, USA) for performing milk composition analysis. This work was supported by Dairy Management Inc. (DMI) and the California Dairy Research Foundation, Project No. 05 MEJ-01-NH.


