


Cheese structure depends strongly on the milk characteristics and the process parameters like temperature (Vargas et al. Reference Vargas, Quintanilla, González, Carreón and Rodríguez2016), rennet concentration, acidity, pressure and casein micelle concentration (Santillo et al. Reference Santillo, Bevilacqua, Corbo, Sevi, Sinigaglia and Albenzio2014). During the early stage of the coagulation process, two different processes can occur: (a) a slow process where the lactic bacteria transform lactose into lactic acid (LA), reducing the milk pH and producing novel chemical structures (exopolysaccharides, organic calcium phosphates (Giroux et al. Reference Giroux, Lanouette and Britten2015) and (b) a fast process where the casein molecules suffer important chemical modifications by the enzyme chymosin (Bittante, Reference Bittante2011).
Here, we studied the role played by temperature and rennet concentration during the coagulation process of rennet cheese production and evaluated their kinetics. To the best of our knowledge, these results have not been reported before. The purpose of the research is to adjust these variables to obtain better mechanical and organoleptic properties more rapidly. Furthermore, the research of the kinetics allows scaling the process keeping the properties of the cheese. The optimal temperature for the catalytic activity was obtained, which reduces the process time, the enzyme concentration, the syneresis and the cost of the final product (Bittante et al. Reference Bittante, Contiero and Cecchinato2013).
Materials and methods
Nine glass reactors of 250 ml were filled each one with 200 ml of pasteurised commercial delactosed milk (Lala, Mexico). All reactors were heated to 30 °C. At the same time, 50 ml of CaCl2 aqueous solution was prepared at 1% concentration; this calcium solution was added together with 2·5 ml of rennet (Solo Química de México) previously filtered with a Nylon membrane of 45 µm. Different amounts of CaCl2/rennet were added to the reactors once the 30 °C was reached: the first three reactors were added with 1·0 ml, the second three with 1·3 ml and finally the last three with 1·6 ml. The mixtures were stirred mildly. Reactors with different CaCl2/rennet concentrations were heated at three temperatures: 30, 35 and 40 °C. Each reactor was equipped with a thermometer, a pH-meter and a temperature control system with agitation.
Samples of 0·2 ml were taken from each reactor and placed in a clean vial containing 10 ml of distilled and filtered water; these diluted samples were used to determine the particle size using a Brookhaven Instrument apparatus model BI200SM (Brookhaven, NY, USA) equipped with a high speed digital correlator (PCI-BI9000AT), a solid-state detector and a He-Ne laser of 35 mW (Melles Griot 9167EB-1); the scattering angle was 90° and the correlation functions were analysed using a non-negative least square program which provide the particle size distributions. This procedure was repeated every 5 min to reach 40 min of reaction for three temperatures and three rennet concentrations. Samples of 7 ml were taken at the same times for capillary viscosity determination. pH was determined in situ every 5 min for all concentrations and temperatures.
Results and discussion
The aggregation profiles are reported in Fig. 1a, b. Two different regimes are shown: the first one is characterised by a slow increment in the particle size due to the aggregation of the peptide fractions. The second regime shows a rapid growth of aggregates produced by the aggregation of the already formed aggregates. In this last stage the aggregates quickly reach a large size, which then sediment forming the curd and disappearing from the scattering volume of the Dynamic light scattering apparatus. In Fig. 1a, b are reported the largest size of aggregates measured before they sediment.
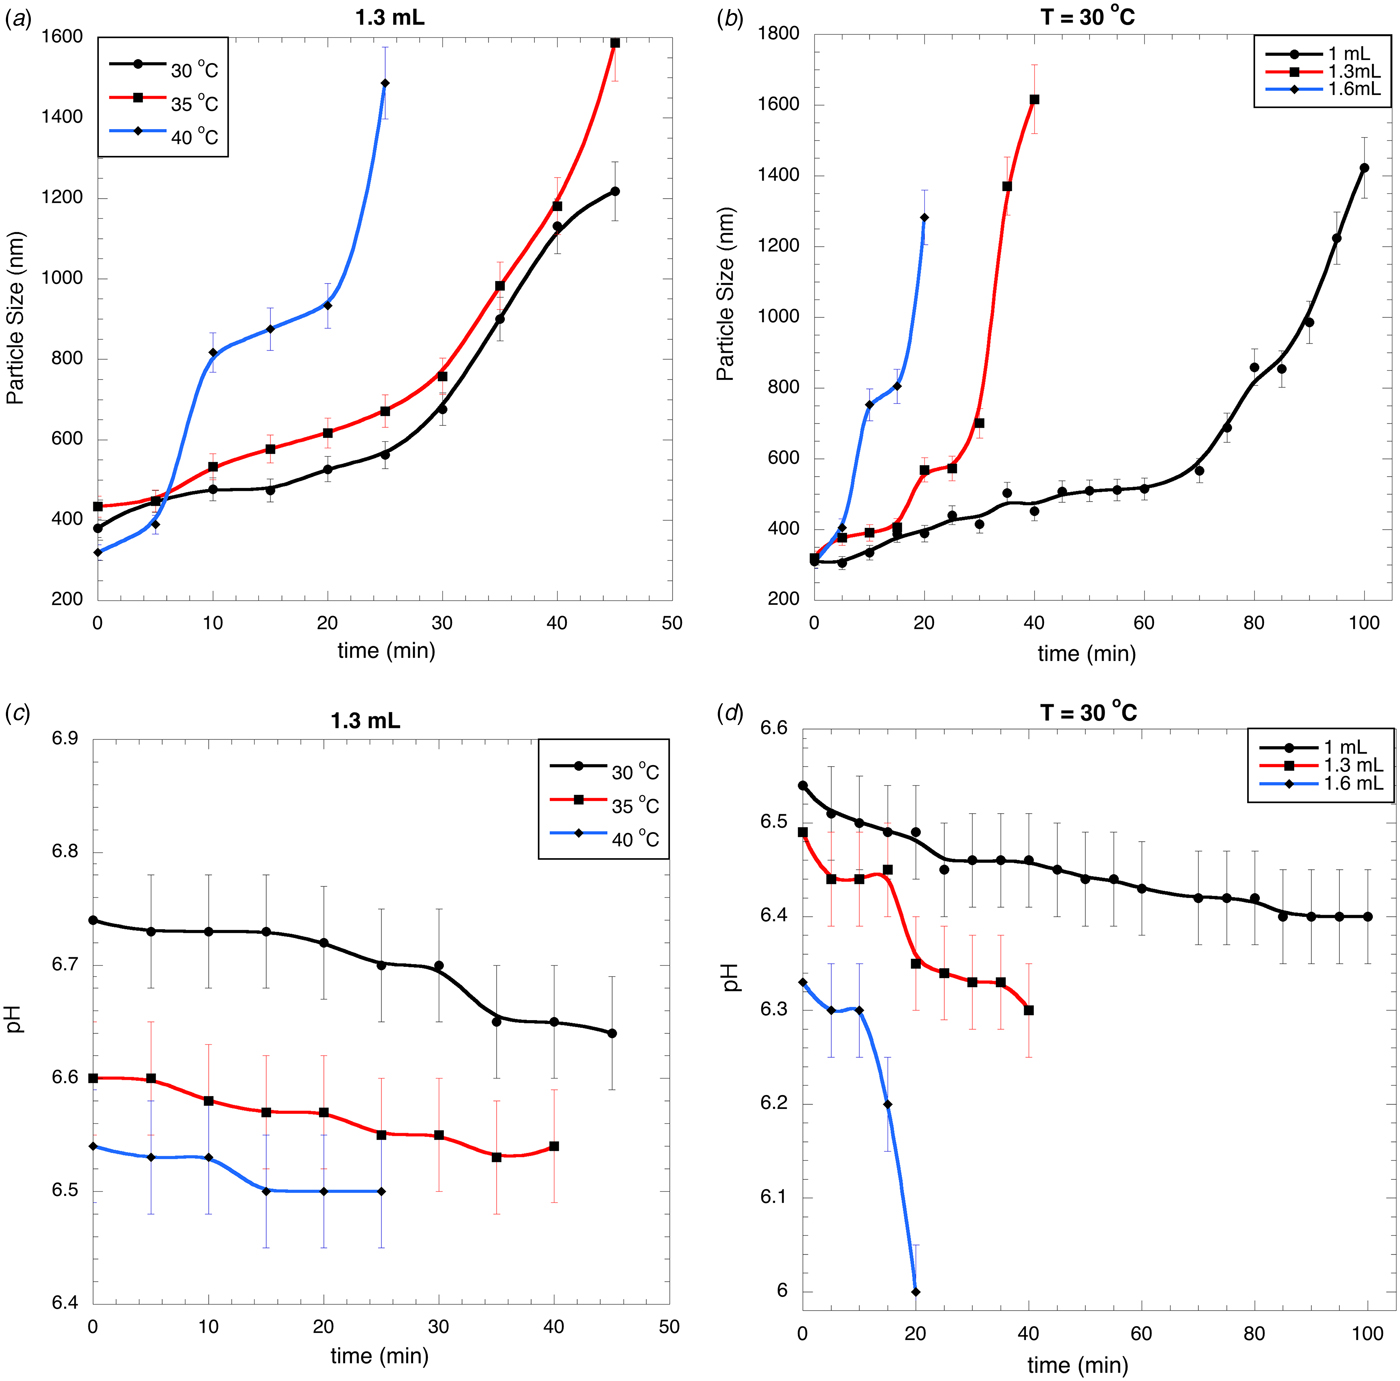
Fig. 1. Typical particle size profiles for different temperatures using 1·3 ml of rennet (a) and different rennet volumes at 30 °C (b); pH profiles for different temperatures using 1·3 ml of rennet (c) and different rennet volumes at 30 °C (d).
It is interesting to note from Fig. 1a that at 40 °C the aggregation profile has a different shape with respect to the others: two primary and two secondary regimes are shown. At low temperature (<30 °C) a fine protein network is produced, while at high ones (>36 °C) an irregular, coarse and discontinuous protein matrix is obtained. The high temperature is responsible for the profile with the odd shape. This figure shows that the particle size grows more rapidly at high temperatures: after 25 min the particle size at 30 °C is 500 nm, at 35 °C 600 nm and at 40 °C 1500 nm; after 10 min the particle sizes are 450, 550 and 800 nm for 30, 35 and 40 °C. In Fig. 1b we report the size profiles for different amount of rennet: high rennet concentration produces large aggregates; after 20 min the particle size at 1·0 ml is 400 nm, at 1·3 ml 550 nm and at 1·6 ml 1300 nm.
pH triggers different process during the coagulation (Stocco et al. Reference Stocco, Cipolat, Cecchinato, Calamari and Bittante2015). In Fig. 1c the pH profiles at different temperatures are reported. Even when the initial pH is different, in all cases they reduce slowly as a function of the reaction time: at 30 °C from 6·74 to 6·64, at 35 °C from 6·60 to 6·54, at 40 °C from 6·54 to 6·50. This is a small reduction in pH: from 0·04 to 0·10 for all cases, i.e. near the uncertainty in the pH determination. This small acidification is produced by the chemical and morphological transformation induced by the enzyme during the curd formation. Figure 1d shows the pH profiles at different rennet concentrations. When the rennet volume reaches 1·6 ml, the reaction time is reduced together with the pH. 1·0 ml of rennet reduces pH from 6·54 to 6·40, 1·3 ml from 6·49 to 6·30 and 1·6 ml from 6·33 to 6·00. The last one corresponds to the maximum reduction in pH (0·33) for high amount of rennet. Even in this case, the pH reduction is small as compared with those produced, for example, by bacteria in yogurt fermentation; these large differences are due, essentially, to the large differences in the reaction times: the enzymatic reactions are significantly faster respect to the chemical reaction produced by the bacteria during the transformation from lactose into lactic acid. As mentioned, a small reduction in pH means that temperature, together with the enzyme concentration, is the important variable that controls the kinetics.
Viscosity results are important because they provide information on the kinetics of coagulation through the determination of volume fraction of solids φ as a function of time. The determination of φ as a function of time is through the use of the Einstein relationship:
 $$\eta = \eta _{\rm o}\left( {1 + \displaystyle{{2\phi} \over 5}} \right) \to \displaystyle{{d\eta} \over {dt}} = \displaystyle{{2\eta _{\rm o}} \over 5}\left( {\displaystyle{{d\phi} \over {dt}}} \right)$$
where η, η o and φ are the system and water viscosities and the volume fraction of solids.
Figure 2a, b show the viscosity profiles for different temperatures and rennet volumes. Viscosity profiles grow rapidly from the onset of the process, followed by a slow growth profile. This is different to the size profiles where the initial slope is small (first regime) and is increased during the second one. Once again, this difference relates to the action of the enzyme being significantly more rapid than the aggregation process controlled by diffusion. The enzyme rapidly breaks specific bonds in the casein molecules, quickly changing the morphology and producing the aggregation of these casein fragments (Scatassa et al. Reference Scatassa, Gaglio, Macaluso, Francesca, Randazzo, Cardamone, Di Grigoli, Moschetti and Settanni2015). The concentration of casein fragments is high due to the fast action of the enzyme, and then the number of aggregates grows rapidly in the first regime that is proportional to the volume fraction of solids. After this, the aggregation continues to form finally the curd, but this process is controlled by diffusion, which is a slow process. The characteristic difference between the particle size profiles and the viscosity profiles is a direct consequence of the large difference in times between the enzymatic activity and the diffusion process. Syneresis significantly affects the viscosity.
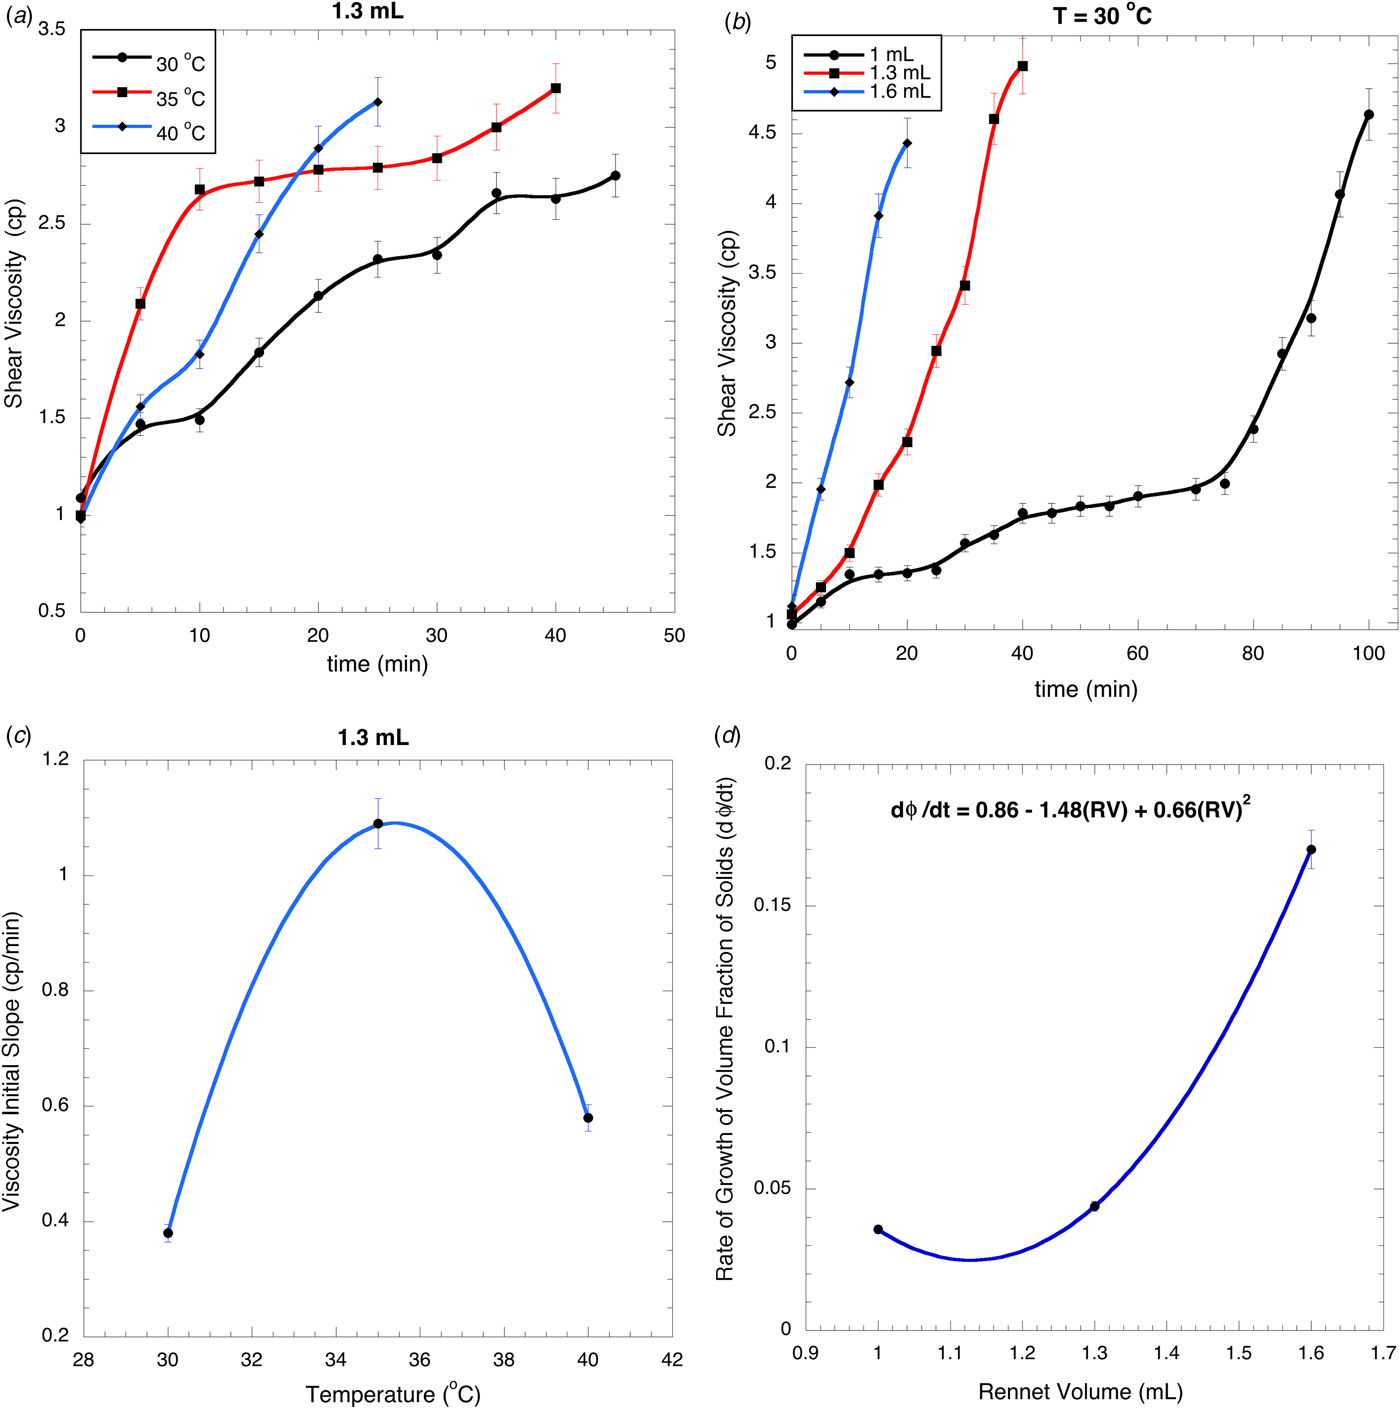
Fig. 2. Shear viscosity for different temperatures using 1·3 ml of rennet (a) and different rennet volumes at 30 °C (b); Viscosity initial slope at different temperatures using 1·3 ml of rennet (c) and different rennet volumes at 30 °C (d).
The slope of viscosity profiles is proportional to the rate the volume fraction of solids is produced with the time:
 $$\displaystyle{{d\eta} \over {dt}} = \displaystyle{{2\eta _{\rm o}} \over 5}\left( {\displaystyle{{d\phi} \over {dt}}} \right)$$
The initial slopes of the viscosity profiles in Fig. 2a, b are reported in Fig. 2c, d. The optimal temperature can be obtained from Fig. 2c because it corresponds to the maximum slope of the viscosity profiles, i.e. to 35·5 °C; at this temperature the maximum enzymatic activity and the fastest growth of the volume fraction of solids are obtained. This temperature is in the typical range used for cheese preparation: at this temperature the coagulation takes around 10 min, while at 40 °C it takes 25 min and at 30 °C 45 min. The initial slope of the viscosity profiles is reduced at high temperature (40 °C) because in this case the casein molecules cannot be hydrated by the chymosin and some groups are no longer exposed to form the aggregates. Thus, a correct election of the processing temperature reduces significantly the coagulation time.
The initial slopes for the viscosity profiles at different rennet concentrations are reported in Fig. 2d. The maximum slope corresponds to the largest amount of rennet used for coagulation: 1·6 ml. An increment in the chymosin concentration increases the volume fraction of solids, reducing significantly the coagulation time. As mentioned, the activity of the enzyme is so drastically fast that it is independent of its concentration. This figure shows a quadratic dependence between the rennet volume and the volume fraction of solids (curd), i.e. the kinetics of the curd production should be of order near of two.
Conclusion
In the present work, the role played by temperature and rennet concentration during the coagulation process of rennet cheese, and their kinetics were investigated. We concluded that temperature is the main factor that determines the kinetics. The rennet concentration was unimportant probably due to the fast action of the enzyme chymosin. The results also revealed that at 35·5 °C the volume fraction of solids has the maximum slope, indicating that at this temperature the curd is formed rapidly. We observed a quadratic dependence between the rennet volume and the volume fraction of solids (curd), thereby indicating that the kinetics of the curd production should be of order two.
Conflict of interest
The authors have declared no conflict of interest.
The authors would like to thank Alicia del Real and Carmen Peza for their help with SEM analysis. This research was supported by DGAPA (Conacyt-Mexico).


