Introduction
Mammary gland inflammation, or mastitis, is a relatively common condition that affects all mammalian species. In the dairy cow, infection of the mammary gland by bacteria leads to substantial economic costs, due to reductions in milk production and quality (NMC, 2016), and compromises animal welfare. Bacteria that have penetrated the teat duct may be eliminated rapidly by the sentinel cellular defences, or by an acquired immune response. If the defences are overwhelmed, bacterial numbers may proliferate inducing a severe inflammatory response (Hogan et al. Reference Hogan, Gonzalez, Harmon, Nickerson, Oliver, Pankey and Smith1999).
Early New Zealand studies to estimate the heritability of resistance to mastitis showed potential (Ward, Reference Ward1938; Lush, Reference Lush1949). However, better understanding of the genetic determinants of resistance to mammary infection has remained limited, in part due to the complexity of defining accurate phenotypes, and the interplay between host and pathogen. Previous studies have attempted to identify quantitative trait loci (QTL) for mastitis using dairy cow populations where milk characteristics and health records are collected on large numbers of animals. These studies typically report the milk somatic cell count (SCC) as a surrogate phenotype for mastitis. Gross SCC can be taken as indicative of current or historical infection and correlates with clinical mastitis to varying degrees (Heringstad et al. Reference Heringstad, Klemetsdal and Ruane2000). QTL for host SCC have been identified on most bovine autosomes (Klungland et al. Reference Klungland, Sabry, Heringstad, Olsen, Gomez-Raya, Våge, Olsaker, Ødegård, Klemetsdal, Schulman, Vilkki, Ruane, Aasland, Rønningen and Lien2001; Ron et al. Reference Ron, Feldmesser, Golik, Tager-Cohen, Kliger, Reiss, Domochovsky, Alus, Seroussi, Ezra and Weller2004; Lund et al. Reference Lund, Guldbrandtsen, Buitenhuis, Thomsen and Bendixen2008; Tal-Stein et al. Reference Tal-Stein, Fontanesi, Dolezal, Scotti, Bagnato, Russo, Canavesi, Friedmann, Soller and Lipkin2010), however the correlation between SCC and clinical mastitis is not perfect, e.g., reflecting the degree of cellular dilution as milk volumes change through lactation. Further, the number of cells may never decline to pre-infection levels if substantial pathological damage has occurred (Harmon, Reference Harmon1994).
Other investigations have used genome-wide approaches to identify QTL for clinical mastitis in the dairy cow directly (Holmberg & Andersson-Eklund, Reference Holmberg and Andersson-Eklund2004; Lund et al. Reference Lund, Sahana, Andersson-Eklund, Hastings, Fernandez, Schulman, Thomsen, Viitala, Sabry, Viinalass and Vilkki2007, Reference Lund, Guldbrandtsen, Buitenhuis, Thomsen and Bendixen2008; Schulman et al. Reference Schulman, Sahana, Iso-Touru, Lund, Andersson-Eklund, Viitala, Värv, Viinalass and Vilkki2009) identifying mastitis QTL on various chromosomes, including some intervals that overlap with QTL for milk cell abundance (in particular on chromosomes 9 and 11). Clinical mastitis occurrence is also a broadly defined phenotype, being pathogen non-specific, and representing composite failure of the various defences against disease.
The objective of the current study was to delineate the Streptococcus uberis clinical mastitis phenotype to discover genetic variation in the innate and adaptive immune responses within the mammary gland. Str. uberis causes approximately 80% of clinical mastitis in New Zealand dairy cows (McDougall, Reference McDougall2002) and so is the most relevant pathogen for us to investigate. An intramammary bacterial challenge experiment was undertaken, exposing animals within a large bovine crossbreed population of known pedigree to a single strain and dose of a defined filed relevant strain of Str. uberis. Genome-wide linkage and association mapping, in conjunction with exome and genome sequencing data, have been used to identify chromosomal regions that may harbour innate immunity loci, positional candidates for variations in mastitis susceptibility.
Materials and methods
Animals
Animal experimentation was approved by the Ruakura Animal Ethics Committee (Hamilton, New Zealand) in accordance with the New Zealand Animal Welfare Act of 1999. The experimental animals consisted of a subset from a population of 864 F2 Holstein-Friesian × Jersey cross breed dairy cows of known pedigree, representing half-sib offspring of six F1 sires (Spelman et al. Reference Spelman, Milllar, Hooper, Thielen and Garrick2001). This population comprised two cohorts, bred over successive years and located on the same research farm.
Pre-trial microbiology and treatments
The bacteriological status of milk from all animals was assessed five weeks pre-trial to identify and treat pre-existing infections, aiming to maximise the number of animals available for study. Milk samples from each mammary gland were collected aseptically, and tested for the presence of mastitis pathogens, according to National Mastitis Council guidelines (Hogan et al. Reference Hogan, Gonzalez, Harmon, Nickerson, Oliver, Pankey and Smith1999). Glands with a foremilk cell count greater than 106 cells/ml and the presence of more than 100 cfu/ml of Staphylococcus aureus, Streptococcus uberis, or Streptococcus dysgalactiae, or more than 1000 cfu/ml coagulase negative staphylococci (CNS) spp., were treated with intramammary antibiotics. Further milk samples were collected for bacteriology three days prior to the experimental Str. uberis challenge. Some 134 (22%) of all cows had one or more quarters infected with a mastitis pathogen (S. aureus, Str. uberis, CNS or Corynebacterium bovis). Of these 134 cows, 87 had been treated previously whilst 47 had not. The observed prevalence of intramammary infection was similar to previous estimates for mid-lactation cows, managed on pasture in New Zealand (Lopez-Benavides et al. Reference Lopez-Benavides, Williamson, McGowan, Lacy-Hulbert, Jago, Davis and Woolford2006). To account for potential effects of previous infection and antibiotic use on the experimental infection, appropriate sub-classifications were incorporated into the phenotypic model for QTL analysis.
Assignment of challenge, mastitis diagnosis and treatment
The infection challenge was staged over two successive years such that challenged animals within each cohort were the same age and at approximately the same stage of lactation (2nd to 4th month of lactation). Cows were assigned randomly to one of four challenge week groups, after identification and balancing for expected oestrus dates and previous mastitis treatments (Sanders et al. Reference Sanders, McDougall, Stanley, Johnson, Spelman and Harcourt2006). Cows previously treated for mastitis during the season were assigned to the third or fourth week to allow more opportunity to clear the infection and minimise the risk of any residual antibiotic effects.
Intramammary exposure was by infusing approximately 100 cfu Str. uberis (suspended in 1 ml of 0·85% w/v saline and 10% v/v glycerol) through the teat canal using an 18 g × 25 mm intravenous catheter as described by Sanders et al. (Reference Sanders, McDougall, Stanley, Johnson, Spelman and Harcourt2006). The strain had been isolated from clinical case mastitis in a nearby herd (McDougall et al. Reference McDougall, Parkinson, Leyland, Anniss and Fenwick2004). The right rear mammary gland was infused, or the left rear gland if the right rear had been treated previously.
Inoculations followed the Monday morning milking. Pre-infusion, foremilk samples from all quarters were assessed visually for flecks or clots and California Mastitis Test (CMT) score. The same assessments were conducted on the infused gland for the subsequent 13 milkings, or until clinical mastitis was diagnosed. Clinical mastitis was diagnosed when clots were detected and the CMT score was ⩾2. Upon diagnosis, cows were infused 3 or 4 times at 12 h intervals with 250 mg cefuroxime sodium (Spectrazol® Milking Cow; MSD, Upper Hutt, New Zealand). Str. uberis was recovered from a random subset of 55 clinically infected animals for strain identification by pulsed field gel electrophoresis.
Genetic analysis
Genetic investigations were undertaken in four distinct phases. The first was genome-wide linkage analysis to identify QTL for resistance to infection. In the second phase, the most significant QTL were further analysed by exome capture and sequencing of the six F1 sires. Variants within the QTL interval of the sires were genotyped in the F2 population, and preliminary association analysis revealed a peak association at a known immune locus. The third was genotyping and association analysis of all known variants within this immune locus. The fourth phase was chromosome-wide association analysis of new variations from the whole genome sequence data, augmenting a panel of high density SNP genotypes.
Full details of the genetic and statistical analyses are described in the online Supplementary File.
Statistical analysis
In summary, for linkage analysis, the clinical infection status of each animal following Str. uberis bacterial infusion was treated as a continuous variable, with JMP software (version 8.0.2; SAS Institute Inc., Cary, NC, USA) used to fit cohort year and challenge week group as class effects. Whether a cow received treatment for a pre-existing infection or whether the cow was determined to have a sub-clinical infection (defined as the presence of mastitis pathogens, without any clinical signs) prior to infusion were added as fixed effects, with the residuals used for linkage mapping. Linkage analysis was conducted using regression methodology in a half sibling model (Haley et al. Reference Haley, Knott and Elsen1994; Baret et al. Reference Baret, Knott and Visscher1998), with a significance threshold of P < 0·05. Following discovery of associated markers, marker genotype for those SNPs were added as fixed effects in the models to assess residual variance of the chromosome 11 interval in the linkage and Bayesian association analyses. The point-wise significance of the top four individual markers was also assessed by least squares analysis of variance using JMP software, using the same phenotype residuals assessed for linkage analysis.
Results
Clinical infection
Following infusion with Str. uberis, 430 cows (71·2%) developed clinical mastitis during the succeeding 13-milking monitoring period, with most (368 animals) presenting within four days. The Str. uberis isolates recovered from the random subset of 55 clinically infected animals were all confirmed as the infusion strain. Similar rates of clinical mastitis developed across the two cohorts (Table 1) and in each challenge week, apart from week 4 in year 1, and week 3 in year 2 (Table 1). Of previously treated cows, a lower proportion developed clinical mastitis (0·52) (others 0·75 P < 0·001; Table 1). Cows with another pathogen within one or more glands, not challenged, prior to challenge developed less clinical mastitis (0·51 vs. 0·77, respectively, P < 0·001; Table 1).
Table 1. Number and proportion of cows that developed clinical mastitis following a single intramammary infusion of Streptococccus uberis, for all challenged cows, and across different subgroup classes, related to cohort, week of challenge, and prior treatment and infection status

Proportions are expressed relative to the number of animals within each subgroup class. The ‘cohort’ subgroup denotes the year cohort to which the cow belonged. The ‘challenge week’ denotes the four different weeks, across the two years that the experiment was conducted. The ‘previous antibiotic treatment’ subgroup denotes animals that were treated for pre-existing infections prior to Str. uberis challenge. The ‘subclinical infection’ subgroup denotes cows from which mastitis pathogens were isolated three days prior to Str. uberis challenge.
Linkage analysis
The genome-wide linkage analysis of the clinical response to intramammary Str. uberis challenge revealed QTL with chromosome-wide significance on chromosomes 7, 8, 11, and 15 (Fig. 1). Only the chromosome 11 QTL was significant at the genome wide level, with maximum significance at 62 cm, corresponding to a physical location of 48 Mbp on the UMD3·1 genome build (P chr-wide = 0·001; P gen-wide = 0·023; Fig. 1). Based on individual sire analysis using the half sib model, two of the six F1 sire families (Sires 2 & 3) segregated for the response to intramammary challenge at this genomic position (Fig. 2). This indicated that these two sires were likely to be heterozygous for a causal polymorphism. A second, less significant QTL was apparent at the distal end of chromosome 11. Using co-factor analysis to adjust for the effect of the QTL at 62 cm, peak significance of the second QTL was observed at 117 cm, or 100 Mbp (P chr-wide = 0·0170, P gen-wide = 0·3316; Fig. 3a).

Fig. 1. Half-sib linkage QTL for response to intamammary Str. uberis challenge. Chromosome position in centimorgans (cm) is indicated on the X-axis, QTL F-value is indicated on the Y-axis. Peak significance for the Chromosome 7 QTL was observed at 42 cm (30 Mbp; Pchr-wide = 0·021; Pgen-wide = 0·378). Peak significance for the Chromosome 8 QTL was observed at 56 cm (50 Mbp; Pchr-wide = 0·010; Pgen-wide = 0·200). Peak significance for the chromosome 11 QTL was observed at 62 cm (Pchr-wide = 0·001; Pgen-wide = 0·023), corresponding to 48 Mbp on the UMD3·1 genome build. Peak significance for the Chromosome 15 QTL was observed at 44 cm (39 Mbp; Pchr-wide = 0·037; Pgen-wide = 0·672).

Fig. 2. Sire segregation effects for the clinical response to Str. uberis exposure in each of the six sire families. Negative log10 transformed P-values of each sire family at the position of peak QTL significance (62 cm) are indicated. The dashed line denotes the P < 0·05 significance threshold, showing significant segregation in the ‘2’ and ‘3’ sire families.
Fig. 3. (a) Chromosome 11 half-sib QTL for infection response to intramammary Str. uberis challenge, including co-factor analysis, and adjustment for IL1A genotype. Chromosome position in centimorgans (cm) is indicated on the X-axis, half sib QTL F-value is indicated on the Y-axis. The solid line is equivalent to the mapping data presented in Fig. 1, and suggests the presence of two QTL on this chromosome with peak significance at 62 cm (48 Mbp on the UMD3·1 genome build). Following incorporation of a co-factor at 62 cm to remove the effect of the primary QTL, peak significance of the distal QTL is at 117 cm (100 Mbp; Pchr-wide P = 0·017; Pgen-wide = 0·332; dashed line). Inclusion of the IL1A g.46362361G>C genotype as a fixed effect in the clinical response phenotype model removes the significance of the QTL at 62 cm (dotted line). (b) Histogram of bootstraps (n = 1000) for the chromosome 11 infection response QTL. Chromosome position given in cm on the X-axis, bootstrap number is indicated on the Y-axis. The interval targeted for exome enrichment and sequencing is indicated by the larger of the two double-ended arrows (36·3–68·8 Mbp UMD3·1), the revised interval targeted for genome sequence analysis is indicated by the double-ended arrow (37·2–54·7 Mb UMD3·1).
Since the chromosome 11 QTL at 62 cm was the most significant QTL detected, this region was prioritised for further genetic analysis. Bootstrapping defined a target interval for DNA sequencing and variant discovery in the six F1 sires (Fig. 3b). A conservative 49–74 cm (36·3–68·8 Mbp) interval was targeted for exome capture and sequencing. Additional variants were selected from a 50–65 cm interval (37·2–54·7 Mbp; Fig. 3b) for genotyping following whole genome sequencing of the sires.
Association analysis
Custom genotyping and quality filtering of exome and whole genome sequence-derived variants yielded 485 custom variants for association analysis. The chromosome 11 SNP were added to 37 986 quality-filtered SNP from the Illumina BovineSNP50 BeadChip and used for Bayesian association mapping. Bayes B estimation of marker effects revealed peak association with an exome sequence-derived variant within the target interval (g.46362361G>C SNP, UMD3·1), located 1959 bp upstream of the interleukin-1 alpha (IL1A) gene (RefSeq transcript NM_174092·1). Figure 4 shows a Manhattan plot of marker effects for these custom SNPs and the 1640 chromosome 11 SNPs from the Illumina BovineSNP50 platform. Table 2 shows the top four marker effects for the 36·3–68·8 Mbp interval, including point-wise probabilities for phenotypic association of these variants. Linkage disequilibrium pairwise correlations across these variants are also indicated in Table 2.
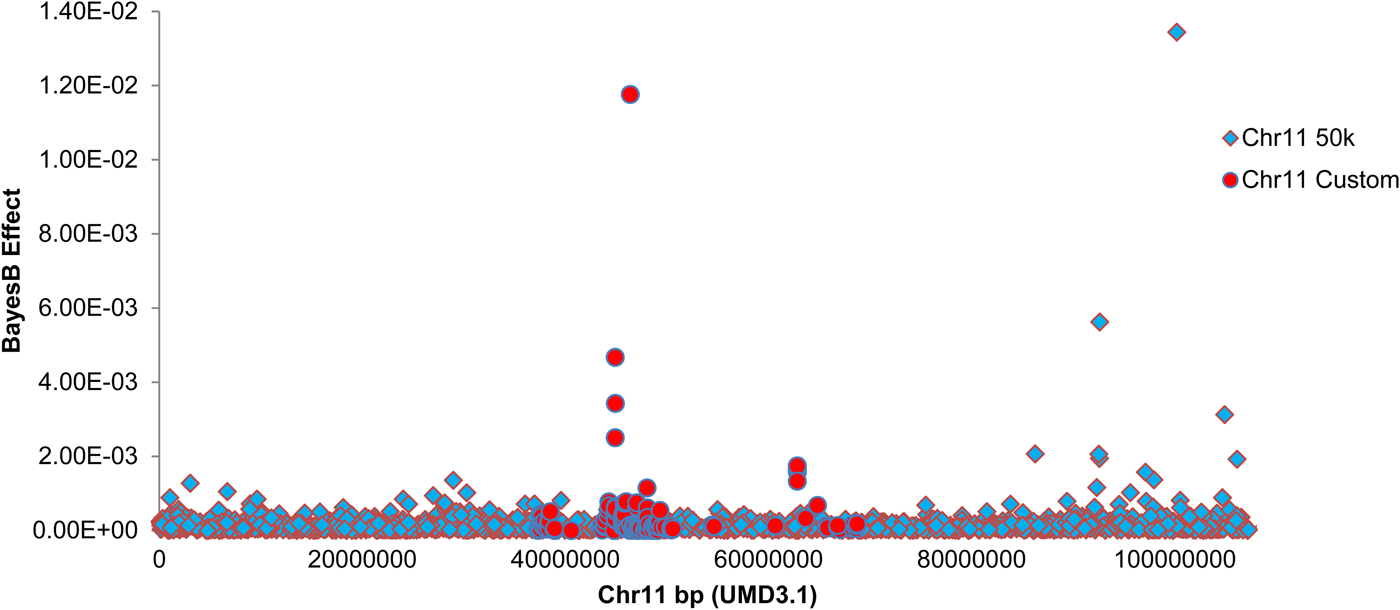
Fig. 4. Manhattan plot showing estimated SNP effects on mammary infection status on chromosome 11. BayesB SNP effect is indicated on the Y-axis, marker position is indicated on the Y-axis in base pairs (UMD3·1 build). Markers from the Illumina Bovine SNP50 platform are indicated as diamonds. Custom markers discovered by exome and genome sequencing of the six F1 sires are indicated as circles. BayesB mapping was conducted using 50 000 iterations, with P i = 0·99.
Table 2. Summary statistics are shown for the top four variants in the chromosome 11 target interval, as identified by BayesB genome-wide association mapping
SNP Name indicates the physical position of each SNP on chromosome 11 of the UMD3·1 genome. Gene and Gene Region indicate the nearest RefSeq gene to each SNP, and the position of each SNP relative to annotated RefSeq gene structure. BayesB Effect indicates the allele substitution effect estimated for each SNP, MAF indicates the minor allele frequency of each SNP in the crossbreed population. P-value is the point-wise probability of association between each SNP and the mastitis clinical status phenotype as calculated by least squares regression. Pairwise LD values are expressed as r 2 correlations, calculated between the six possible pairs of the four variants.
The g.46362361G>C IL1A genotype was fitted as a fixed effect to the clinical infection status phenotype, removing most of the linkage signal for the 48 Mbp QTL on chromosome 11 (Fig. 3a). The combined custom and chip-based genotypes encompassed by the 36·3–68·8 Mbp chromosome 11 target interval explained 4·79% of the genetic variance for infection status as estimated by Bayes B. Inclusion of the g.46362361G>C IL1A genotype as a fixed effect in this model reduced the genetic variance attributed to this interval to 1·76%.
Discussion
Genome-wide studies have highlighted genetic regions predisposing resistance to mastitis or mastitis-related phenotypes in the dairy cow (Klungland et al. Reference Klungland, Sabry, Heringstad, Olsen, Gomez-Raya, Våge, Olsaker, Ødegård, Klemetsdal, Schulman, Vilkki, Ruane, Aasland, Rønningen and Lien2001; Lund et al. Reference Lund, Sahana, Andersson-Eklund, Hastings, Fernandez, Schulman, Thomsen, Viitala, Sabry, Viinalass and Vilkki2007; Schulman et al. Reference Schulman, Sahana, Iso-Touru, Lund, Andersson-Eklund, Viitala, Värv, Viinalass and Vilkki2009). While these bovine studies are of practical interest and highlight QTL which may be relevant to marker-assisted breeding schemes, we are unaware of any previous studies that have sought to identify genetic regions specifically regulating intramammary mechanisms of immunity to Str. uberis mastitis. The experimental infection challenge reported here has revealed an immune locus on bovine chromosome 11, highlighting a number of candidate causative sequence variants for further investigation.
The observation of less clinical mastitis amongst cows that had previously received antibiotic treatment and those that had a subclinical infection 3d prior to challenge, was not unexpected. Hill (Reference Hill1988) reported that pre-existing infections can provide some protective effect against subsequent challenge, but could not identify mechanisms. The need to retain the treated and infected animals for the infection study and genetic analysis reflects the practicalities in conducting such studies, namely that subclinical infection is common, and exclusion of these animals could erode power to detect genetic effects. The analyses have taken account of infection status as a potential confounding factor.
The chromosome 11 infection resistance QTL reported here overlaps with mastitis-related QTL identified in other distinct cattle populations. An analysis of Swedish dairy cattle families identified broadly overlapping clinical mastitis and cell count QTL on chromosome 11 (Holmberg & Andersson-Eklund, Reference Holmberg and Andersson-Eklund2004). In follow-up analyses, the position of the milk somatic cell QTL was refined to an interval corresponding closely to that identified here, with peak significance at 46–49 Mbp (Lund et al. Reference Lund, Sahana, Andersson-Eklund, Hastings, Fernandez, Schulman, Thomsen, Viitala, Sabry, Viinalass and Vilkki2007; Schulman et al. Reference Schulman, Sahana, Iso-Touru, Lund, Andersson-Eklund, Viitala, Värv, Viinalass and Vilkki2009). A study of Danish Holstein cows also found evidence of a clinical mastitis QTL at ~101 Mbp (Lund et al. Reference Lund, Guldbrandtsen, Buitenhuis, Thomsen and Bendixen2008), corresponding to the approximate location of the second chromosome 11 linkage QTL in the New Zealand cows. Although the QTL on chromosomes 7, 8, and 15 failed to reach genome-wide significance in the current study, all three of these locations have been implicated in genome scans of other SCC and clinical mastitis phenotypes (Klungland et al. Reference Klungland, Sabry, Heringstad, Olsen, Gomez-Raya, Våge, Olsaker, Ødegård, Klemetsdal, Schulman, Vilkki, Ruane, Aasland, Rønningen and Lien2001; Boichard et al. Reference Boichard, Grohs, Bourgeois, Cerqueira, Faugeras, Neau, Rupp, Amigues, Boscher and Levéziel2003; Ron et al. Reference Ron, Feldmesser, Golik, Tager-Cohen, Kliger, Reiss, Domochovsky, Alus, Seroussi, Ezra and Weller2004). The aforementioned studies used gross phenotypes derived from veterinary records and milk recording schemes, so assuming they are the same QTL, their coincidence suggests they are also underpinned by variants in genes determining intra-mammary mechanisms of infection resistance. Association analysis of Illumina SNP50 genotypes and novel, sequence-derived variants revealed peak association at the IL1A gene in the linkage QTL interval. The g.46362361G>C SNP sits ~2 kbp upstream of the annotated transcription start site of IL1A, and fitting of this SNP to the infection status phenotype removes most of the genetic variance attributed to this interval. Without additional functional information, it cannot be clearly established if the g.46362361G>C SNP IL1A SNP plays any biological role in the response to Str. uberis immunity. The location of this SNP suggests that variation in one or more genes of the IL1 gene cluster indicates an innate advantage to animals carrying these alleles. The IL1 gene cluster contains nine genes and is evolutionarily conserved (Nicklin et al. Reference Nicklin, Barton, Nguyen, FitzGerald, Duff and Kornman2002), consisting of IL1A, IL1B, IL37, IL36G, IL36A, IL36B, IL36RN, IL1F10, and IL1RN. Although the g.46362361G>C variant maps between the IL1A and IL1B genes, all members of this gene family are considered excellent candidate genes being key mediators of the innate immune response (Sims and Smith, Reference Sims and Smith2010). When the g.46362361G>C SNP IL1A SNP association and the additional 156 exome-sequence derived variants representing all SNP at the IL1 gene cluster, were subsequently genotyped none of the subset of 133 SNP used for association analysis showed greater effects than that demonstrated for g.46362361G>C. However, other non-coding variants sitting outside the regions targeted for exome enrichment were not tested at this locus.
By filtering and genotyping variants based on the sire-family segregation information suggested by half sib linkage analysis, the QTL was assumed to be biallelic with a single causative polymorphism. It is possible that these associations represent multiple, linked genetic signals for resistance to Str. uberis infection responsible for different functional variants. Biologically, this is plausible given that the chromosome 11 target interval also harbours a number of other key immune genes, including v-rel (REL, 43·5 Mbp), immunoglobulin kappa constant (IGKC, 47·1 Mbp), CD8 antigens (CD8A 47·9 Mbp; CD8B 48·0 Mbp), granulysin (GNLY, 49 Mbp), and others. Variations were typed within all these genes, although prior filtering of markers not fitting the expected sire genotype pattern suggested by half sib analysis probably discounted potentially causal variations if this locus consists of multiple overlapping QTL. Likewise, removal of non-SNP variants, and variants not mapped within 5 kb of annotated genes may have comprised additional ‘false-negative’ genotype filtering steps. Filtering of variants based on sire genotype pattern will also have limited the genotype representation of haplotypes in the current dataset, so future work will consider the effect of haplotypes in the chromosome 11 target region.
In conclusion, an immune locus for resistance to experimentally induced Streptococcus uberis clinical mastitis has been identified on bovine chromosome 11 consistent with earlier identification of QTL. A number of candidate causative variations in this region demonstrate greatest association with a marker mapping to the IL1 gene cluster, a key innate immunity locus. Genotyping of the associated SNPs in additional populations will allow their potential predictive utility as breeding markers to be assessed.
Supplementary material
The supplementary material for this article can be found at https://doi.org/10.1017/S0022029918000158
The authors acknowledge the many farm and technical staff involved in all aspects of this work.