The ability of bovine mammary epithelial cells (BMEC) to synthesize milk proteins is one of the most important determinants of milk production in dairy cows (Boutinaud et al., Reference Boutinaud, Guinard-Flament and Jammes2004). Ketosis is one of the most common metabolic diseases of dairy cows in early lactation (Littledike et al., Reference Littledike, Young and Beitz1981). The rapid increase in milk production coupled with insufficient energy intake causes a state of negative energy balance (NEB) (Vanholder et al., Reference Vanholder, Papen, Bemers, Vertenten and Berge2015) resulting in elevated concentrations of plasma fatty acids and ketone bodies [acetoacetate and β-hydroxybutyrate (BHB)] leading to ketosis (Ingvartsen, Reference Ingvartsen2006; Ospina et al., Reference Ospina, Nydam, Stokol and Overton2010). Besides the liver, the mammary gland can take up fatty acids (Glascock and Welch, Reference Glascock and Welch1974) and directly influence milk quality (Palmquist et al., Reference Palmquist, Beaulieu and Barbano1993). As a result, ketosis is not only associated with decreased milk production but also greater milk fat and lower milk protein percentage (Duffield et al., Reference Duffield, Lissemore, McBride and Leslie2009; Kayano and Kataoka, Reference Kayano and Kataoka2015; Zhang et al., Reference Zhang, Guo, Yang, Li, Zou, Loor, Xia and Xu2019a; Reference Zhang, Qi, Wen, Li, Gao and Ao2019b).
Caseins are the most important proteins in milk (Rezaei et al., Reference Rezaei, Wu, Hou, Bazer and Wu2016). Synthesis of casein is a complex process that is closely regulated by the Janus kinase 2 (JAK2)-signal transducer and activator of transcription 5 (STAT5) and the mechanistic target of rapamycin (mTOR) signaling pathways (Yang et al., Reference Yang, Kennelly and Baracos2000; Jiang et al., Reference Jiang, Wang, Yu, Hu, Liu, Gao and Zheng2015). The JAK2-STAT5 signaling pathway controls casein gene transcription through activation of STAT5 (Imada and Leonard, Reference Imada and Leonard2000; Yang et al., Reference Yang, Hong, Xu, Zhao, Liu and Liu2015), which upon transfer into the nucleus induces transcription of casein genes (Yamashita et al., Reference Yamashita, Nevalainen, Xu, LeBaron, Wagner, Erwin and Rui2001). The hormone prolactin (PRL) and amino acids (AA) can activate the mTOR signaling pathway to mediate milk protein synthesis in part by regulating casein transcription (Pauloin and Chanat, Reference Pauloin and Chanat2012; Zhang et al., Reference Zhang, Zhao, Wang, Luo, Gao, Zheng and Wang2018). Phosphorylated mTOR is indicative of mTOR activation in BMEC (Chiang and Abraham, Reference Chiang and Abraham2005). Active mTOR can trigger phosphorylation of downstream molecules including ribosomal protein S6 kinase 1 (S6K1) and initiation factor eukaryotic factor 4E-binding protein 1 (4EBP1), which promote translation culminating in milk protein synthesis (Wang and Proud, Reference Wang and Proud C2006).
Besides the potential for high concentrations of fatty acids for creating a lipotoxic environment within cells, the inverse association between high concentrations of circulating plasma fatty acids and low milk protein synthesis suggest that fatty acids might play a role in the control of milk protein synthesis under ketotic conditions. The general hypothesis we sought to evaluate was that high concentrations of fatty acids inhibit JAK2-STAT5 and mTOR signaling pathways and further suppress the abundance of β-casein. This study provides a theoretical basis for elucidating the molecular mechanism of low milk protein percentage in ketosis cows and provides a scientific basis for the regulation of casein synthesis in the dairy industry.
Materials and methods
The experiment was approved by the Ethics Committee for the Use and Care of Animals, Jilin University [2017 clinical trial (201711036)] (Changchun, China).
Animals
Lactating Holstein dairy cows in this study were chosen from a 7000-cow dairy farm located in Changchun City, China. All cows received a routine physical examination to ensure the absence of other co-morbidities, and the chosen cows had a similar number of lactations (median = 3, range = 2 to 4) and days in milk (median = 6 d, range = 3 to 10 d). Cows were classified as suspected of being clinically ketotic based on signs of depression, low feed intake and low milk yield, and positive results for ketone bodies in milk using a nitroprusside test (Duffield et al., Reference Duffield, Lissemore, McBride and Leslie2009; Piechotta et al., Reference Piechotta, Sander, Kastelic, Wilde, Heppelmann, Rudolphi, Schuberth, Bollwein and Kaske2012). Subsequently, the blood concentration of BHB in these cows was measured to confirm the initial diagnosis. According to clinical symptoms and serum BHB concentrations (Oetzel, Reference Oetzel2004), 15 cows with serum BHB greater than 3 mm (clinical ketosis) and 15 cows with serum BHB concentration lower than 0.6 mm (healthy controls) were randomly selected. The basic description of the cows is reported in online Supplemental Table S1. Cows had ad libitum access to the same diet (online Supplemental Table S2) offered twice a day at 0830 and 1600 h.
Milking and milk samples
Milk samples were collected as previous description (Sun et al., Reference Sun, Wang, Loor, Bucktrout, Shu, Jia, Dong, Zuo, Liu, Li and Li2019). Cows had access to a constant supply of fresh water and were milked twice daily at 0800 and 1530 h. Milk yield was electronically recorded and samples collected at each milking for 5 d for storage at 4°C with a preservative (1 mg/ml potassium dichromate). Milk fat, protein, and lactose were analyzed by infrared analysis with a 4-channel spectrophotometer (Multispec, Foss Food Technology Corp., Eden Prairie, MN).
Blood sample and mammary tissue collection
Blood samples were collected by jugular venipuncture (no anticoagulant) between 0700 and 0800 h before feeding and the serum was separated after centrifugation at 3,500 × g for 15 min at 4°C and stored at −80°C until analysis. Concentrations of glucose, BHB and fatty acids in serum were determined using a Hitachi 7170 autoanalyzer (Hitachi, Tokyo, Japan) with commercially-available kits (Randox Laboratories, Crumlin, UK).
Percutaneous biopsies of 15 cows with clinical ketosis and 15 healthy cows were obtained from the right or left rear quarter of the mammary gland according to published procedures (Bionaz and Loor, Reference Bionaz and Loor2008). Briefly, the skin of the biopsy site was washed and sterilized with 75% alcohol and iodine. The area at the biopsy site was anesthetized by subcutaneous injection of 3 mL of lidocaine hydrochloride (20 mg/ml). After making a skin incision, we performed blunt dissection of the mammary capsule to ensure tissue obtained during the biopsy was mammary parenchyma. Immediately after removal of the biopsy instrument from the capsule, pressure was applied to the wound until visual signs of bleeding were absent. The skin incision was closed with 4 or 5 Michel clips (11 mm; Henry Schein, http://www.henryschein.com). The incision site was sprayed with topical antiseptic (Povidone Iodine Ointment, 10%; Taro Pharmaceuticals). Rectal temperature, milk yield, and feed intake were recorded daily for 7 d to monitor post-operative health condition. Tissue samples for quantitation of protein were frozen immediately in liquid nitrogen and stored at −80°C until use.
Primary cell culture
Primary mammary epithelial cell isolation from lactating mammary tissue of 3 dairy cows was as described previously (Wang et al., Reference Wang, Xu, Wang, Bu, Wang and Loor2014). Immediately after exsanguination, parenchyma samples were aseptically removed from the core of the mammary gland. The tissue was minced into small pieces and digested with 0.5% collagenase III (C8490, Solarbio, Beijing, China) for 3 h at 38°C. The resulting solution was filtered sequentially with a 74-μm strainer and centrifuged at 150 × g for 10 min.
The cells were cultured with complete Dulbecco's modified Eagle's medium containing: Nutrient Mixture F-12 medium (DMEM/F-12, Grand Island, New York, USA) supplemented with 10% fetal bovine serum (Grand Island, New York, USA), 500 ng/ml hydrocortisone (Sigma-Aldrich, St. Louis, MO, USA), 1 μg/ml PRL (100-07, Peprotech, Rocky Hill, NJ), 10 ng/ml epidermal growth factor (Peprotech, Rocky Hill, NJ), and 100 IU/ml penicillin/streptomycin (Baoman Biotechnology, Shanghai, China) in an incubator at 37°C under 5% CO2. Prior to experimental treatments, cells were detached with trypsin for purification. After passaging three times, cells were seeded into a six-well tissue culture plate (2 ml per well) with DMEM/F-12 supplemented with 10% fetal bovine serum and 100 IU/ml penicillin/streptomycin. The medium was changed once every 24 h.
Fatty acids and methionine (Met)/PRL treatments
The fatty acids components (oleic, linoleic, palmitic, stearic, and palmitoleic acids; Sigma Aldrich) used in this study were chosen based on profiles reported in the blood of ketotic cows (Yamdagni and Schultz, Reference Yamdagni and Schultz1970). The fatty acids were diluted in 0.1 m KOH at 60°C and pH of the solution adjusted to 7.4 with hydrochloric acid (1 m). The NEFA stock (52.7 mm) solution contained oleic (22.9 mm), linoleic (2.6 mm), palmitic (16.8 mm), stearic (7.6 mm) and palmitoleic acids (2.8 mm) (Li et al., Reference Li, Li, Bai, Chen, Deng, Liu, Zhang, Liu and Wang2012). Before treatments, cells were serum-starved for 12 h. Then, the BMEC were cultured with 0, 0.3, 0.6, or 1.2 mm fatty acids and 2% fatty acid-free bovine serum albumin (BSA) for 24 h at 37°C under 5% CO2. In addition, cells were cultured with Met (0.6 mm; Lu et al. Reference Lu, Gao, Li, Huang, Liu and Li2012) and PRL (5 μg/ml; Zhang et al., Reference Zhang, Guo, Yang, Li, Zou, Loor, Xia and Xu2019a, Reference Zhang, Qi, Wen, Li, Gao and Ao2019b) for 24 h or co-cultured with 1.2 mm fatty acids and 0.6 mm Met or 5 μg/ml PRL for 24 h before collection for analyses. Cell culture was performed in triplicate.
RNA extraction and quantitative reverse-transcription PCR assay
Total RNA from cultured BMEC was extracted using Trizol. Purity was assessed: the OD260/OD280 ratio of the total RNA was determined to be 1.9. One μg total RNA was reverse-transcribed to cDNA using a commercial kit (TaKaRa Biotechnology Co., Ltd., Tokyo, Japan). The abundance of mRNA was measured via SYBR green plus a reagent kit (Roche, Norwalk, CT, USA) with the 7500 Real-Time PCR System (Applied Biosystems). Primer sets are reported in online Supplemental Table S3. The relative abundance of target genes was normalized to β-actin, and analyzed using the 2−ΔΔCT method. The PCR reaction was performed in triplicate from each of the 3 individual cell preps.
Protein extraction and western blotting
Total protein in BMEC was extracted using a protein extraction kit (Sangon Biotech Co., Ltd, Shanghai, China) and the content quantified using a BCA Protein Assay Kit (P1511; Applygen Technologies). Total protein (30 μg per lane) from each sample was separated by 12% SDS-PAGE and electro-transferred to a polyvinylidenedifluoride membranes (PVDF; 0.45 μm). Then, the PVDF membranes were washed, blocked, and incubated overnight at 4°C with primary antibodies (online Supplemental Table S4), respectively. Subsequently, membranes were washed and incubated with horseradish peroxidase-conjugated anti-mouse or anti-rabbit antibody (1 : 5,000, Boster, Wuhan, China) at room temperature for 45 min. Immunoreactive bands were visualized by enhanced chemiluminescence solution (Pierce Biotechnology Inc., Chicago, USA). Lastly, the bands were imaged using a protein imager (ProteinSimple, San Jose, CA, USA).
Statistical analysis
All data were tested for normality and homogeneity of variance. In vivo data from Western Blotting were normally distributed and analyzed with paired t-tests. Other in vivo data did not have a normal distribution, thus, were analyzed with the Wilcoxon-signed-rank-test. In the in vitro studies, comparisons of groups were done by one-way ANOVA, and the Bonferroni's multiple comparison post-test was applied to examine all possible pairwise comparisons. Statistical analysis was performed using GraphPad Prism 6.01 (Graph Pad Software, San Diego, CA) or SPSS (Statistical Package for the Social Sciences) 19.0 software (IBM, Armonk, NY). All data are expressed as the mean ± sem; P < 0.05 was considered statistically significant.
Results
Baseline characteristics and blood parameters
As shown in online Supplemental Table S1, the milk production and milk protein concentration were lower in cows with clinical ketosis (P < 0.05). The milk fat was greater in cows with clinical ketosis (P < 0.05). The plasma concentration of fatty acids and BHB was greater (P < 0.05) while glucose concentration was lower (P < 0.05) in cows with clinical ketosis.
Decreased β-casein content in the mammary gland of clinically-ketotic cows
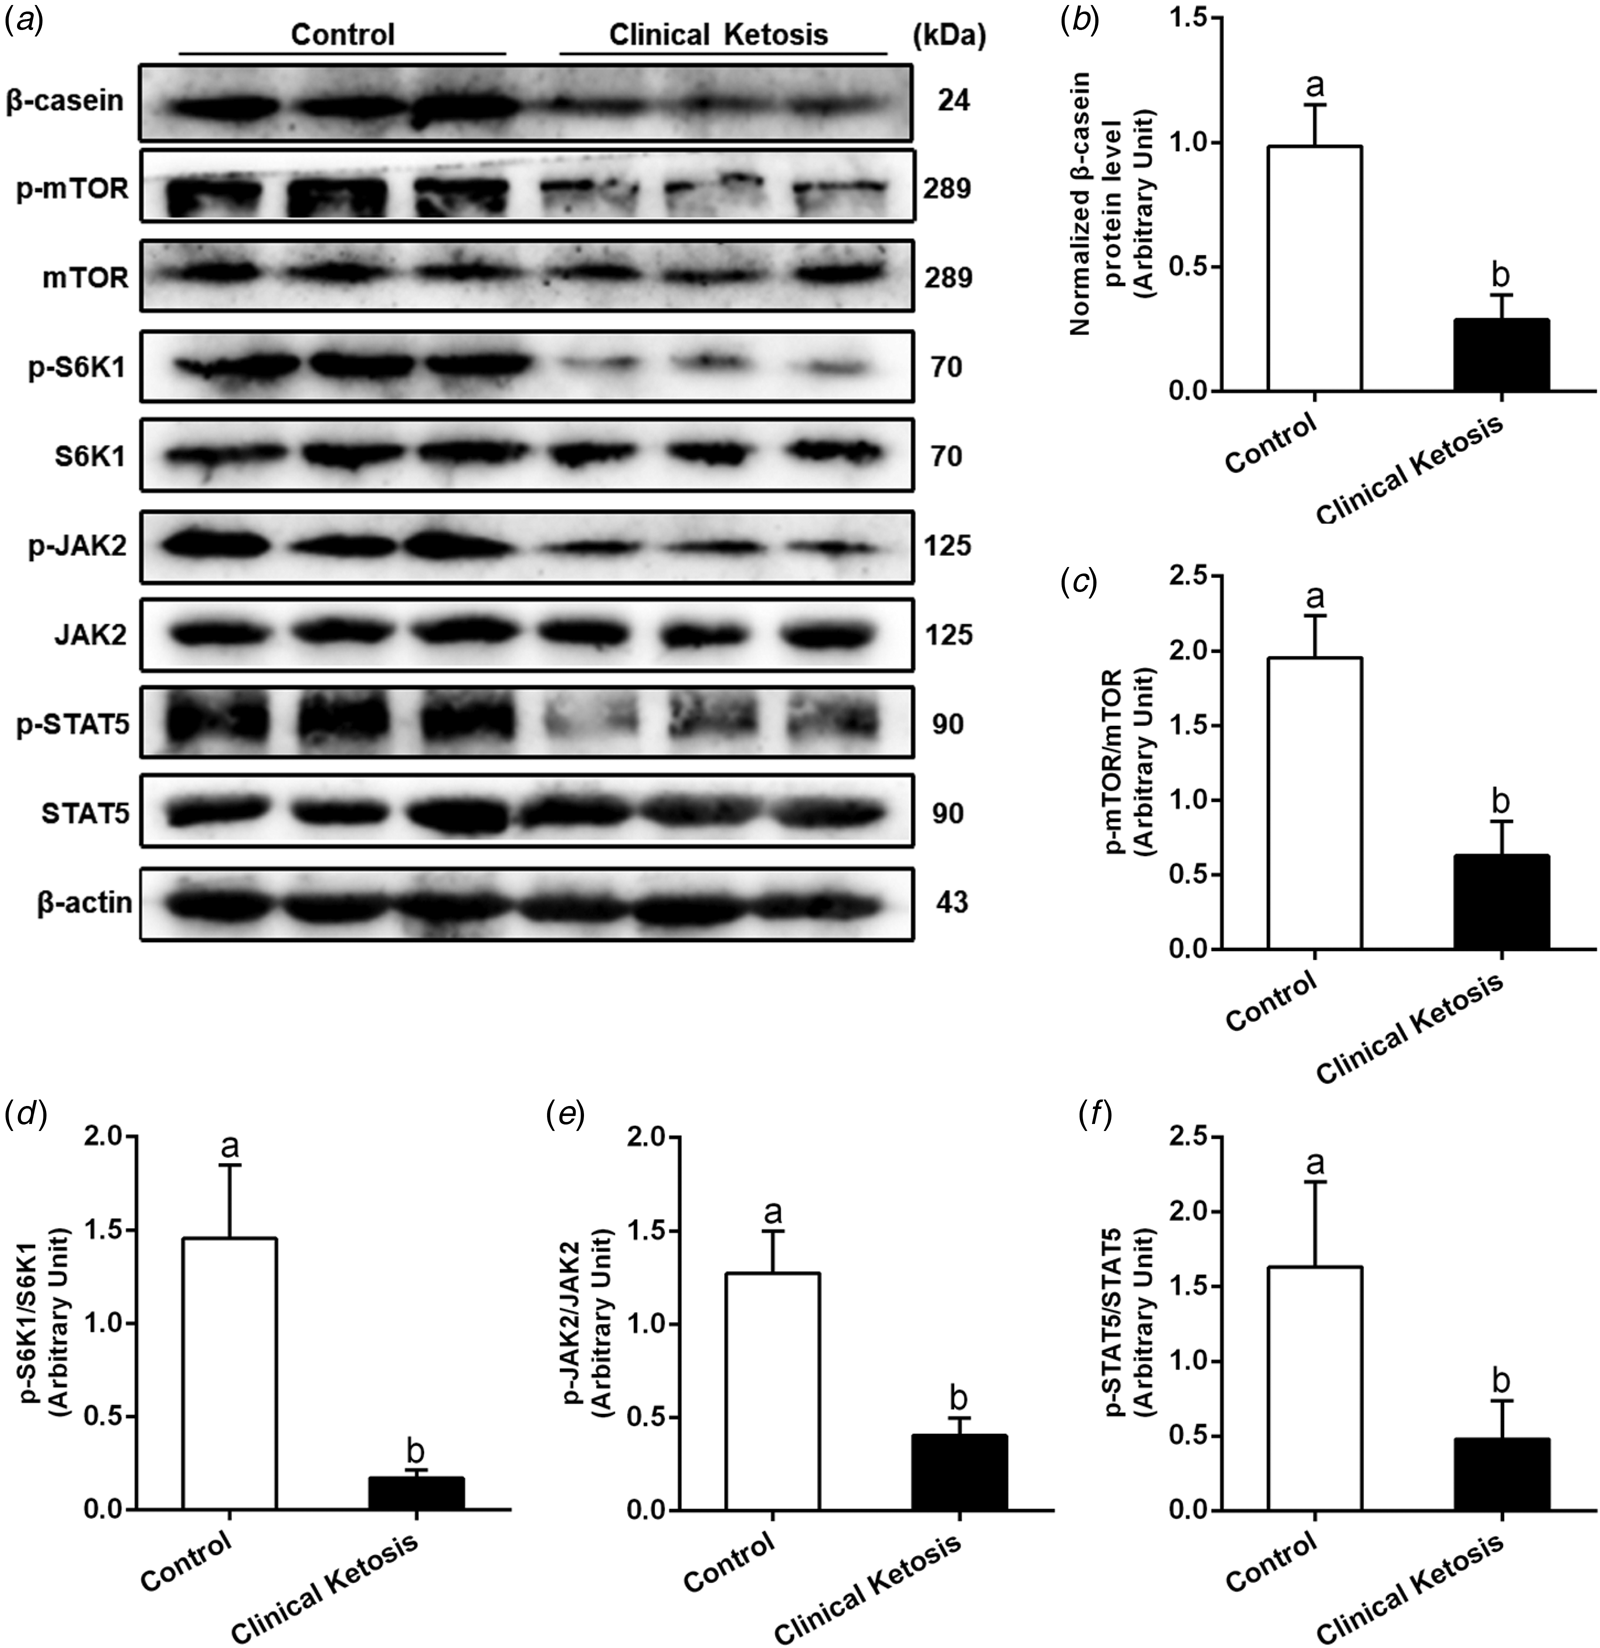
Compared with the control cows, the ratios of p-mTOR/mTOR, p-S6K1/S6K1, p-JAK2/JAK2 and p-STAT5/STAT5 were significantly lower in the cows with clinical ketosis (P < 0.05; Fig. 1a and c–f). Furthermore, the protein abundance of β-casein in the mammary tissue of cows with clinical ketosis was also markedly lower (P < 0.05; Fig. 1a and b). These results suggest that the suppression of mTOR and JAK2-STAT5 pathways decreases the synthesis of β-casein, and further leads to lower milk protein percentage.

Fig. 1. The abundance of mTOR, JAK2-STAT5 signaling and β-casein are lower in the mammary gland of clinically ketotic cows. (a) Western blot analysis of β-casein, p-mTOR, mTOR, p-S6K1, S6K1 p-JAK2, JAK2, p-STAT5 and STAT5 in mammary gland of clinically-ketotic cows. (b) Relative protein abundance of β-casein. (c–f) The ratio of p-mTOR/mTOR, p-S6K1/S6K1, p-JAK2/JAK2 and p-STAT5/STAT5 in BMEC. The data were analyzed with paired t tests and expressed as the mean ± sem (n = 15 per group). In the bar charts, different superscript lowercase letters indicate significant differences (P < 0.05).
Effect of fatty acids on the content of β-casein, mTOR and JAK2-STAT5 signaling in BMEC
The protein and mRNA abundance of β-casein were markedly decreased in the 0.6 and 1.2 mm fatty acids treatment groups (P < 0.05; Fig. 2a–c). Additionally, compared with the control, the ratios of p-mTOR/mTOR, p-S6K1/S6K1, p-JAK2/JAK2 and p-STAT5/STAT5 decreased gradually in response to incremental fatty acids (0.6 and 1.2 mm) (P < 0.05; Fig. 3a–e). Exogenous fatty acid treatment markedly downregulated the mRNA abundance of S6K1, 4EBP1, and STAT5 (P < 0.05; Fig. 3f–h). These results suggested that fatty acids are a negative regulator of mTOR and JAK2-STAT5 signaling pathways and β-casein content in BMEC.
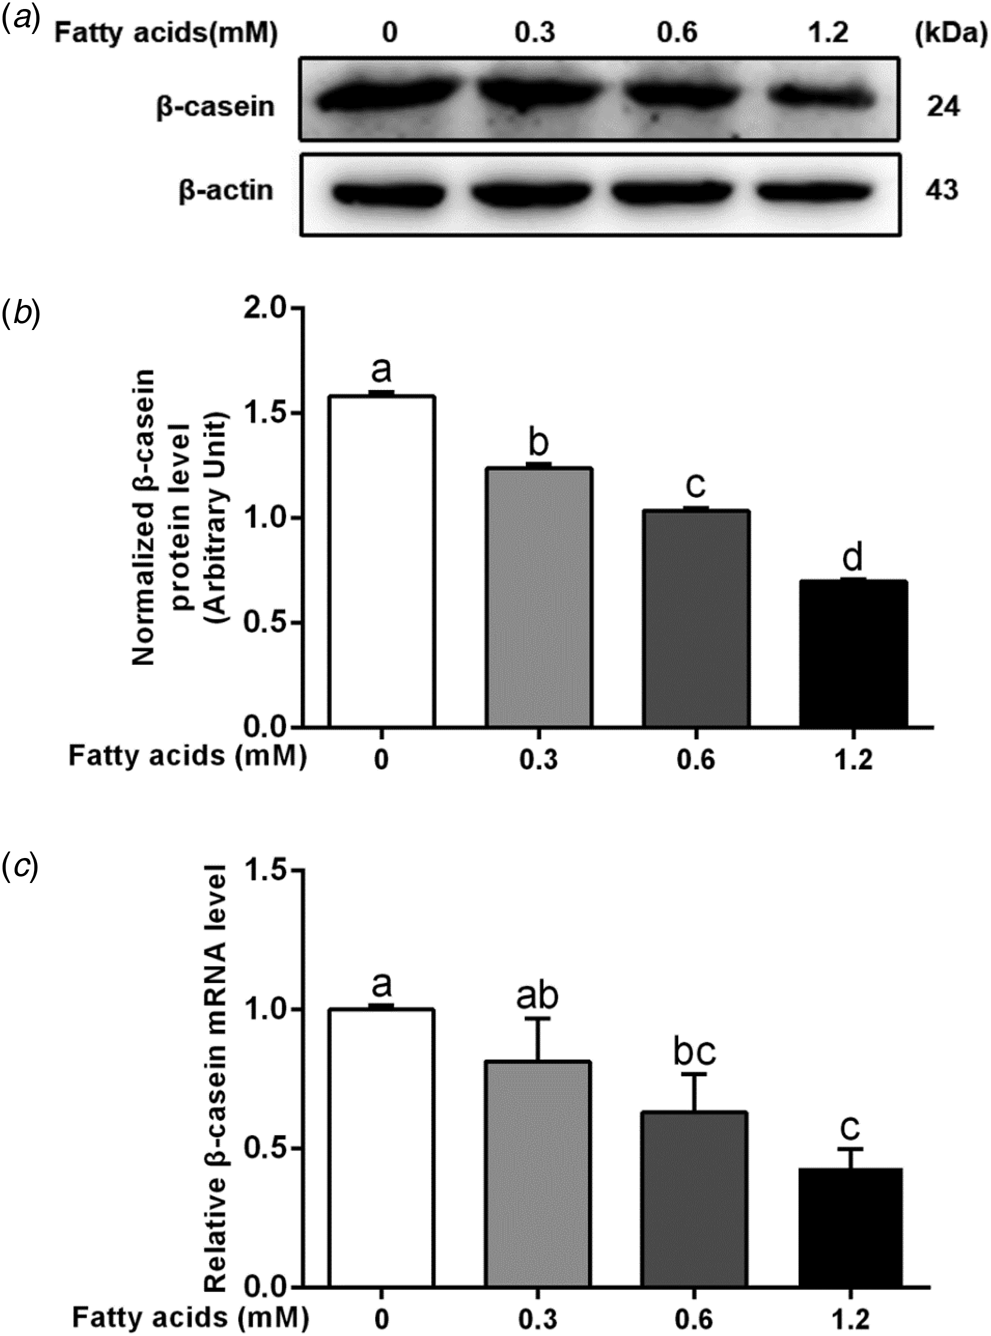
Fig. 2. Fatty acids negative regulates β-casein content in BMEC. The cells were incubated in DMEM/F-12 and cultured with 0, 0.3, 0.6, or 1.2 mm of a fatty acids-2% fatty acid-free bovine serum albumin (BSA) mixture for 24 h. (a) Western blotting analysis of β-casein in BMEC. (b) Relative protein abundance of β-casein. (c) Relative mRNA abundance of β-casein in BMEC. Results were representative of at least three independent experiments. The data of control group was used to normalize the data of each treatment group. Comparisons among groups were calculated using one-way ANOVA with subsequent Bonferroni correction. The data presented are the mean ± sem. In the bar charts, different superscript lowercase letters indicate significant differences (P < 0.05), while the same letters represent no significant difference (P > 0.05).

Fig. 3. The negative effect of fatty acids on mTOR and JAK2-STAT5 signaling pathways in bovine mammary epithelial cells (BMEC). The cells were incubated in DMEM/F-12 and cultured with 0, 0.3, 0.6, or 1.2 mm of a fatty acids-2% fatty acid-free BSA mixture for 24 h. (a) Western blotting analysis of p-mTOR, mTOR, p-S6K1, S6K1 p-JAK2, JAK2, p-STAT5 and STAT5 in BMEC. (b–e) The ratios of p-mTOR/mTOR, p-S6K1/S6K1, p-JAK2/JAK2 and p-STAT5/STAT5 in BMEC. (f–h) Relative mRNA abundance of S6K1, 4EBP1 and STAT5 in BMEC. Results were representative of at least three independent experiments. The data of control group was used to normalize the data of each treatment group. Comparisons among groups were calculated using one-way ANOVA with subsequent Bonferroni correction. The data presented are the mean ± sem. In the bar charts, different superscript lowercase letters indicate significant differences (P < 0.05), while the same letters represent no significant difference (P > 0.05).
Excessive fatty acids significantly alleviated the activation of exogenous Met/PRL on mTOR and JAK2-STAT5 signaling and β-casein content
Although exogenous Met and PRL significantly increased β-casein protein abundance, exogenous fatty acids significantly diminished the positive effect of Met and PRL on β-casein protein abundance (P < 0.05; Figs. 4a and b, 5a and b). The phosphorylation of mTOR, S6K1, JAK2 and STAT5 were enhanced by Met and PRL, and these effects were markedly diminished by co-treatment with fatty acids (P < 0.05; Figs. 4a and c–f, 5a and c–f). Additionally, exogenous fatty acids also significantly inhibited the positive effect of Met on mRNA abundance of S6K1, 4EBP1 and STAT5 (P < 0.05; Fig. 4g–i). These data reveal that high concentration of fatty acids inhibits mTOR and JAK2-STAT5 signaling, and further suppresses the content of β-casein in BMEC.

Fig. 4. Exogenous methionine (Met) alleviated the inhibition of fatty acids on milk protein synthesis in bovine mammary epithelial cells (BMEC). The cells were incubated in DMEM/F-12 with 2% fatty acid-free BSA, and cultured with 0, 1.2 mm fatty acids, 0.6 mm Met or co-cultured with 1.2 mm fatty acids and 0.6 mm Met for 24 h. (a) Western blot analysis of β-casein, p-mTOR, mTOR, p-S6K1, S6K1, p-JAK2, JAK2, p-STAT5 and STAT5. (b) Relative protein abundance of β-casein. (c–f) The ratio of p-mTOR/mTOR, p-S6K1/S6K1, p-JAK2/JAK2 and p-STAT5/STAT5. (g–i) Relative mRNA abundance of S6K1, 4EBP1 and STAT5. Results were representative of at least three independent experiments. The data of control group was used to normalize the data of each treatment group. Comparisons among groups were calculated using one-way ANOVA with subsequent Bonferroni correction. The data presented are the mean ± sem. In the bar charts, different superscript lowercase letters indicate significant differences (P < 0.05), while the same letters represent no significant difference (P > 0.05).

Fig. 5. Exogenous prolactin (PRL) alleviated the inhibition of fatty acids on milk protein synthesis in bovine mammary epithelial cells (BMEC). The cells were incubated in DMEM/F-12 with 2% fatty acid-free BSA, and cultured with 0, 1.2 mm fatty acids, 5 μg/mL PRL or co-cultured with 1.2 mM fatty acids and 5 μg/ml PRL for 24 h. (a) Western blot analysis of β-casein, p-mTOR, mTOR, p-S6K1, S6K1, p-JAK2, JAK2, p-STAT5 and STAT5. (b) Relative protein abundance of β-casein. (c–f) The ratio of p-mTOR/mTOR, p-S6K1/S6K1, p-JAK2/JAK2 and p-STAT5/STAT5. Results are representative of at least three independent experiments. The data of control group was used to normalize the data of each treatment group. Comparisons among groups were calculated using one-way ANOVA with subsequent Bonferroni correction. The data presented are the mean ± sem. In the bar charts, different superscript lowercase letters indicate significant differences (P < 0.05), while the same letters represent no significant difference (P > 0.05).
Discussion
The inhibition of mTOR and JAK2-STAT5 signaling pathways and lower abundance of β-casein in mammary tissue of cows with clinical ketosis, along with the inhibitory effect of fatty acids on mTOR and JAK2-STAT5 signaling pathways and β-casein synthesis in BMEC partly explain the lower milk protein percentage detected during clinical ketosis. Because previous studies have demonstrated that mTOR and JAK2-STAT5 signaling pathways play important roles in milk protein synthesis in the bovine mammary gland (Yang et al., Reference Yang, Kennelly and Baracos2000; Bionaz and Loor, Reference Bionaz and Loor2011), results from the present study suggest a mechanistic link between excessive fatty acid influx into mammary gland during ketosis and the reduction in milk protein percentage.
Casein is not merely an important component of milk protein but also a significant index of milk quality (Gao et al., Reference Gao, Zhao, Zheng, Zhang, Wang, Zhou and Wang2017). β-casein accounts for a high percentage of milk protein, thus, the factors that affect β-casein abundance have a large effect on milk protein synthesis in BMEC (Davies and Law, Reference Davies and Law Andrew1983). In this study, the lower protein abundance of β-casein in mammary tissue and the lower milk protein percentage in cows with clinical ketosis are consistent with a previous study (Duffield et al., Reference Duffield, Lissemore, McBride and Leslie2009). The high concentrations of fatty acids along with the increase in lipotoxicity they induced within BMEC can inhibit the activity of enzymes involved in milk protein synthesis (Ingvartsen, Reference Ingvartsen2006; Ospina et al., Reference Ospina, Nydam, Stokol and Overton2010). Thus, we speculate that fatty acids might be one of the factors which regulate the abundance of β-casein. The very potent negative effect of fatty acids on milk protein synthesis was underscored in the present study by data from co-incubations of fatty acids and Met or PRL. Exogenous Met (0.6 mm) treatment increases the abundance of β-casein in BMEC (Lu et al., Reference Lu, Gao, Li, Huang, Liu and Li2012). Furthermore, PRL is one of the major hormones that regulate milk protein synthesis (Hennighausen et al., Reference Hennighausen, Robinson, Wagner and Liu1997). Thus, both in vivo and in vitro data clearly reinforce negative effects of high availability of fatty acids on casein content, and partly explain the reduction in milk protein percentage during clinical ketosis.
The JAK2-STAT5 and mTOR signaling pathways are central to the regulation of milk protein synthesis (Bionaz and Loor, Reference Bionaz and Loor2011; Jiang et al., Reference Jiang, Wang, Yu, Hu, Liu, Gao and Zheng2015). Phosphorylated JAK2-STAT5 stimulates milk protein synthesis at the transcriptional level (Yamashita et al., Reference Yamashita, Nevalainen, Xu, LeBaron, Wagner, Erwin and Rui2001). The mTOR signaling pathway is also an essential signaling pathway involved in the long-term regulation of milk protein synthesis (Bionaz and Loor, Reference Bionaz and Loor2011). In this study, the phosphorylation levels of JAK2, STAT5 and mTOR were significantly decreased in the mammary gland of dairy cows with clinical ketosis. Furthermore, high concentrations of fatty acids markedly downregulated the phosphorylation levels of JAK2 and STAT5 (along with lower mRNA abundance), mTOR, and S6K1, and mRNA abundance of 4EBP1 and S6K1 in BMEC. These results indicate that high levels of fatty acids inhibit JAK2-STAT5 and mTOR pathway in the mammary gland of dairy cows with clinical ketosis, which further underscores the sensitivity of the β-casein synthesis machinery to intracellular fatty acids.
The role of exogenous AA availability and lactogenic hormones on the regulation of cellular protein synthesis through mTOR and JAK2-STAT5 signaling pathways are well-known (Kim, Reference Kim2009; Yang et al., Reference Yang, Hong, Xu, Zhao, Liu and Liu2015). For example, exogenous Met (0.6 mm) treatment was used to activate mTOR and JAK2-STAT5 signaling pathways and further increased the abundance of β-casein in BMEC (Burgos et al., Reference Burgos, Kim, Dai and Cant2013; Yang et al., Reference Yang, Hong, Xu, Zhao, Liu and Liu2015). The hormone PRL can trigger the dimerization of PRL receptor and activate JAK2 and STAT5 (Imada and Leonard, Reference Imada and Leonard2000), thus, the results we observed with Met and PRL on JAK2-STAT5 and mTOR pathways and β-casein content support a role for these pathways in the control of protein synthesis in BMEC. Furthermore, the mTOR inhibitor rapamycin induced a strong attenuation of the PRL-induced β-casein synthesis in mouse mammary epithelial cells (Pauloin and Chanat, Reference Pauloin and Chanat2012). The fact that fatty acids treatment diminished the activation by Met and PRL of p-TOR, p-S6K1, JAK2 and STAT5 along with the upregulation of S6K1, 4EBP1, STAT5, and β-casein to some extent offers additional support for the involvement of fatty acids in the inhibition of mTOR and JAK2-STAT5 pathways and β-casein synthesis in BMEC.
Nutrients such as AA not only function as signaling molecules regulating the abundance of casein via JAK2-STAT5 and mTOR signaling pathways in BMEC but also serve as building blocks and anabolic factors for milk protein synthesis (Arriola Apelo et al., Reference Arriola Apelo, Singer, Lin, McGilliard, St-Pierre and Hanigan2014). AA are small polar compounds that need the help of transporters to pass through the cell membrane, and some AA transporters act as sensors as well as carriers (Wang et al., Reference Wang, Liu, Wu, Fang, Chen and Zhang2017). In the context of mechanisms linking fatty acids and AA signaling, one intriguing possibility is that above a certain concentration, the fatty acids may interfere with AA transport into cells or interfere in the sensing of extracellular AA concentrations. For instance, a recent study revealed that the bovine mammary tissue G protein-coupled receptor TAS1R1/TAS1R3 can sense and transport AA into mammary cells to elicit activation of mTOR signaling in part via increases in intracellular Ca2+ (Wang et al., Reference Wang, Liu, Wu, Fang, Chen and Zhang2017; Zhou et al., Reference Zhou, Zhou, Peng and Loor2018). Clearly, a growing body of data is revealing complex mechanisms in the control of milk protein synthesis. Further research should help to clarify the biological relevance of fatty acids in the control of milk protein synthesis.
In summary, the milk protein percentage is negatively associated with the concentration of fatty acids in clinically ketotic cows. High concentration of fatty acids inhibits mTOR and JAK2-STAT5 signaling pathways in mammary epithelial cells of cows with clinical ketosis, which further decreases the β-casein content, thereby leading to a decrease of milk protein percentage. This can partly explain the lower milk protein percentage detected during clinical ketosis.
Supplementary material
The supplementary material for this article can be found at https://doi.org/10.1017/S0022029920000175.
Acknowledgements
This work was supported by the National Natural Science Foundation of China (Beijing, China; grant nos. 31772810), and Natural Science Foundation of Jilin Province (Changchun, China; Grant No. 20170101148JC).