


In ruminants, a switch from net lipid accumulation to mobilization takes place at the end of gestation and lactation in order to satisfy the metabolic demands of the mammary gland (Vernon et al. Reference Vernon, Clegg and Flint1981). Dietary fatty acids (FA) as well as those released from adipose tissue through lipolysis are taken up by the lactating udder to synthesize milk fat (Yonezawa et al. Reference Yonezawa, Haga, Kobayashi, Katoh and Obara2008). This process is accompanied by a reduction in serum levels of insulin (Vernon et al. Reference Vernon, Clegg and Flint1981). Hormone-sensitive lipase (LIPE) is the main enzyme regulating lipid mobilization by hydrolysing triacylglycerol, diacylglycerol and monoacylglycerol molecules (Wang et al. Reference Wang, Soni, Semache, Casavant, Fortier, Pan and Mitchell2008). Moreover, LIPE fulfils an important role in tissues such as adrenal cortex and ovary by cleaving cholesterol esters and providing free cholesterol that can be used as a precursor in steroidogenesis (Cook et al. Reference Cook, Yeaman, Strålfors, Fredrikson and Belfrage1982; Wang et al. Reference Wang, Soni, Semache, Casavant, Fortier, Pan and Mitchell2008). Catecholamines, glucagon and other lipolytic hormones activate LIPE through a reversible phosphorylation mechanism involving protein kinase A, while insulin has the opposite effect (Kraemer & Shen, Reference Kraemer and Shen2002). There is evidence that this enzyme is also regulated by nutrition because saturated FA stimulate the expression of bovine LIPE (Yonezawa et al. Reference Yonezawa, Haga, Kobayashi, Katoh and Obara2008). Loss of LIPE function in mice is associated with several abnormalities including a significant reduction of body fat mass, low levels of circulating FA, adipocyte hypertrophy, lipid-filled macrophages and, paradoxically, an increase in basal lipolysis (Wang et al. Reference Wang, Soni, Semache, Casavant, Fortier, Pan and Mitchell2008). Moreover, the polymorphism of the human LIPE gene is associated with variation in plasma lipid concentrations (Qi et al. Reference Qi, Shen, Larson, Barnard, Schaefer and Ordovas2004; Garenc et al. Reference Garenc, Vohl, Bouchard and Pérusse2009). Although LIPE has been characterized at the structural and transcriptional levels in sheep (Lampidonis et al. Reference Lampidonis, Argyrokastritis, Stravopodis, Voutsinas, Ntouroupi, Margaritis, Bizelis and Rogdakis2008) and cattle (Yonezawa et al. Reference Yonezawa, Haga, Kobayashi, Katoh and Obara2008) the effects of LIPE genotype on dairy traits has not been investigated. Herewith, we provide data on the sequence and polymorphism of the caprine LIPE gene as well as its relationship with milk yield and composition.
Materials and Methods
Animal material
Milk traits were recorded in two Murciano-Granadina goat populations. Population 1 included 133 goats distributed in three disconnected herds as reported in Badaoui et al. (Reference Badaoui, Serradilla, Tomàs, Urrutia, Ares, Carrizosa, Sànchez, Jordana and Amills2007). A minimum of four independent records were taken in each goat (Badaoui et al. Reference Badaoui, Serradilla, Tomàs, Urrutia, Ares, Carrizosa, Sànchez, Jordana and Amills2007). Experimental protocols used in the measurement of dairy traits in Population 1 are thoroughly reported in Badaoui et al. (Reference Badaoui, Serradilla, Tomàs, Urrutia, Ares, Carrizosa, Sànchez, Jordana and Amills2007). Population 2 was formed by one herd (n=176). Whole milk was obtained in the first of the two daily milkings from each goat with a periodicity of every 2 months. Milk traits were recorded 3 months after parturition. Protein, fat, lactose, dry matter contents as well as somatic cell count (SCC) were measured with a CombiFoss 600 FC instrument (constituted by a MilkoScan FT 6000 for the analysis of milk components and a Fossomatic FC for SCC).
Milk FA composition was evaluated in the 176 goats of Population 2. Separation and quantification of FA methyl esters were performed with a GC Agilent 6890N Network GS System (Agilent, Santa Clara CA, USA) equipped with a flame ionization detector and fitted with a HP-88 capillary column (100 m, 0·25 mm i.d., 0·2-μm film thickness). Nonanoic acid methyl ester (C9:0 ME, 4 mg/ml) was used as an internal standard. Extraction and direct methylation were performed in a single step method following the procedures reported by Sukhija & Palmquist (Reference Sukhija and Palmquist1998). Individual FA were identified by comparing their retention times with those of an authenticated standard FA mix Supelco 37 (Sigma Chemical Co. Ltd., Poole, UK). Identification of the CLA isomers cis-9 trans-11, cis-11 trans-13, trans-10 cis-12 and cis-10 cis-12 CLA was achieved by comparing retention times with those of another authenticated standard mix (Sigma Chemical Co. Ltd., Poole, UK). Fatty acid content was expressed as the percentage of total methyl esters identified.
Sequence analysis and genotyping of the goat LIPE gene
Mammary gland tissue biopsies of Murciano-Granadina (N=3) and Malagueña goats (N=3) were taken after slaughter and frozen in liquid nitrogen. Total RNA was extracted with the RiboPure Kit (Ambion Inc., Austin TX, USA) reverse transcribed to complementary DNA with the ThermoScript RT-PCR kit (Invitrogen S.A., Barcelona, Spain). Three pairs of primers (Supplementary Table 1) were designed to amplify most of the coding region of the goat LIPE gene (spanning nucleotides 54 to 2147, GenBank accession no. NM_001080220). PCR included 2·5 μl PCR buffer, 1 μl MgCl2 (50 mm), 1 μl dNTP (5 mm), 1·25 μl of each primer (10 μm), 2 μl cDNA and 0·25 μl of Taq DNA polymerase (5 U/μl, Ecogen S.R.L., Barcelona, Spain) in a final volume of 25 μl. Amplification reactions consisted of 35 cycles of 94°C for 1 min, annealing temperature (Supplementary Table 1) for 1 min, and 72°C for 2 min. Amplicons were sequenced in forward and reverse directions and purified by using the Montage SEQ96 Cleanup kit (Millipore Corporation, Billerica MA, USA). Subsequently, they were analysed in an ABI PRISM 3730 capillary electrophoresis device (Applied Biosystems, Foster City CA, USA).
A total of 452 goats were genotyped for the three LIPE polymorphisms. Genomic DNA was extracted from blood samples as previously described (Caravaca et al. Reference Caravaca, Carrizosa, Urrutia, Baena, Jordana, Amills, Badaoui, Sànchez, Angiolillo and Serradilla2009). Amplification of regions containing polymorphisms was achieved with primers SNP1-Fw and SNP1-Rv (exon 2); SNP2-Fw and SNP2-Rv (exon 3); and SNP3-Fw and SNP3-Rv (exon 6). Composition of the PCR targeting exon 2 included 2·5 μl PCR buffer, 0·75 μl MgCl2 (50 mm), 0·5 μl dNTP (5 mm), 1·25 μl of each primer (10 μm), 100 ng genomic DNA and 0·25 μl of Taq DNA polymerase (5 U/μl, Ecogen S.R.L., Barcelona, Spain) in a final volume of 25 μl. In the case of PCRs amplifying exons 3 and 6, the PCR mixture included 2·5 μl PCR buffer, 2·5 μl MgCl2 (25 mm), 1 μl dNTP (5 mm), 1·25 μl of each primer (10 μm), 100 ng genomic DNA and 0·33 μl of TaqGold DNA polymerase (5 U/μl, Applied Biosystems) in a final volume of 25 μl. The thermal profile was of 35 cycles of 94°C (c.327C>A>T) or 95°C (c.558C>T and c.1162G>T) for 1 min, annealing temperature (Supplementary Table 1) for 1 min, and 72°C for 2 min. PCR products were purified with the ExoSAP-IT kit (Amersham Biosciences Europe GmbH, Barcelona, Spain). The three LIPE polymorphisms were initially typed with the SnaPshot ddNTP Primer Extension kit (Applied Biosystems) in about one hundred goats to confirm their segregation in the population. Extension primers were 5′-GTA GGC CTC GAG CTC-3′ (polymorphism c.327C>A>T), 5′-TGC AGA CCA TCT CCA T-3′ (polymorphism c.558C>T), and 5′-TCC CTG GCC CCC GAG-3′ (polymorphism c.1162G>T). Genotyping of the whole population (N=452) was achieved by using a Sequenom MassARRAY iPLEX platform (Spanish National Genotyping Centre, CeGen).
Statistical Analysis
Association analyses between LIPE genotypes and traits were performed with the SAS software (SAS 9.2 Inst. Inc., Cary NC, USA) in the framework of a mixed model for repeated measurements (Littell et al. Reference Littell, Henry and Ammerman1998). Dairy traits such as milk yield, milk protein, fat, lactose and dry percentage and logSCC were recorded in 309 out of 452 goats, while milk FA composition data were obtained from a subset of 176 individuals. The statistical model included as fixed effects LIPE genotype or haplotype, ordinal number of lactation, number of kids born, month of lactation, month of lactation and herd. The model also took into consideration a random animal effect and a residual error term. Fatty acid profile was determined from milk of goats from a single herd, so herd effect was not included in the corresponding statistical model. In contrast, season of sampling was included as a fixed effect in the statistical model because there is a seasonal effect on lipid composition of plant pastures and this might influence milk FA composition (Mel'uchová et al. Reference Mel'uchová, Blaško, Kubinec, Górová, Dubravská, Margetín and Soják2008). Moreover, logSCC was used as a covariate in the statistical model. In this sense, Jensen (Reference Jensen2002) reported that the clinical status of the udder might have an impact on milk FA composition. Statistical analyses were done for each SNP and trait independently and under-represented genotypic classes were not taken into consideration. LIPE haplotypes were reconstructed with Phase 2.1.1 (Stephens et al. Reference Stephens, Smith and Donnelly2001) because parental haplotypes were unknown. Haplotype substitution effects were estimated considering each haplotype as a variable that can take values of −1, 0, and 1 depending on the number of copies (0, 1, or 2) harboured by each individual. Bonferroni threshold of significance was computed as the ratio between the original significance level (e.g. 0·05) and the number of hypothesis tests. Bonferroni thresholds of significance for FA composition and dairy traits were 0·0013 and 0·0083, respectively. Results with P values between the Bonferroni threshold and 0·01 have been considered as highly suggestive and those with P values between 0·01 and 0·05 as suggestive.
Results and Discussion
Most of the coding region of the goat LIPE gene (83%, 1890 bp) has been amplified and sequenced (GenBank accession no. GQ927175). In-silico analysis of the partial amino acid sequence (from position 37 to 666; Supplementary Fig. 1) allowed us to identify three distinct domains: the NH2-terminal domain (located between amino acid positions 37–315 of sequence GQ927175), the catalytic domain (333–499) that contains a serine active site at position 424, and an α/β hydrolase fold domain that goes from position 346 to 550 (Lampidonis et al. Reference Lampidonis, Argyrokastritis, Stravopodis, Voutsinas, Ntouroupi, Margaritis, Bizelis and Rogdakis2008). The serine residue at position 424 which forms part of the catalytic triad (Lampidonis et al. Reference Lampidonis, Argyrokastritis, Stravopodis, Voutsinas, Ntouroupi, Margaritis, Bizelis and Rogdakis2008) was located within a GXSXG motif (Brenner, Reference Brenner1988). Two putative phosphorylation sites conserved in sheep (Lampidonis et al. Reference Lampidonis, Argyrokastritis, Stravopodis, Voutsinas, Ntouroupi, Margaritis, Bizelis and Rogdakis2008) and cattle (Garton et al. Reference Garton, Campbell, Carling, Hardie, Colbran and Yeaman1989) were also identified in the LIPE goat sequence (Ser552 and Ser554). The phosphorylation of the first (regulatory) site might activate the protein, whereas the phosphorylation of the second (basal) one might reduce the subsequent phosphorylation of the first site and the activation of LIPE, and thus it might have an antilipolytic effect (Garton & Yeaman, Reference Garton and Yeaman1990). Finally, the N-terminal region could be involved in LIPE regulation by interacting with other proteins involved in lipolysis or via interactions with the substrates or products of the LIPE-catalysed reaction (Yeaman, Reference Yeaman2004).
The main goal of our study was to characterize genetic variation of the goat LIPE gene and its association with dairy traits and milk FA composition. Sequence alignment allowed us to identify three single nucleotide polymorphisms (SNP). Of these, two were synonymous (c.327C>A>T at exon 2 and c.558C>T at exon 3) and one involved an alanine to serine substitution at position 388 (c.1162G>T at exon 6). In general, SNP are diallelic but we detected three alleles (A, C and T) at position 327. Genotype and haplotype frequencies of these three SNP are summarized in Table 1. The triallelic c.327C>A>T SNP had two minority alleles (A and T) that segregated at very low frequencies in the Murciano-Granadina population. Similarly, the two remaining diallelic SNP had unbalanced frequencies. Structural consequences of the non-synonymous SNP were evaluated with the Panther (Thomas & Kejariwal, Reference Thomas and Kejariwal2004) and Polyphen (Ramensky et al. Reference Ramensky, Bork and Sunyaev2002) softwares. Both approaches allowed us to conclude that the A388S substitution is not expected to alter enzyme function. Moreover, analysis with the NetPhos 2.0 Server (Blom et al. Reference Blom, Gammeltoft and Brunak1999, http://www.cbs.dtu.dk/services/NetPhos) evidenced that the aforementioned replacement does not involve the gain/loss of a phosphorylation site. Similar results were obtained with Scansite (http://scansite.mit.edu) when run at a high stringency.
Table 1. Hormone-sensitive lipase (LIPE) genotype and haplotype frequencies in Murciano-Granadina goats (N=452)

† CCT+CTT+TCT+TTG+TTT
Performance of an association analysis revealed that the caprine LIPE genotype has effects on phenotypic variation of dairy traits (Table 2; Supplementary Table 2). More specifically, c.558C>T genotype displayed a highly suggestive association with milk yield (P=0·0032) and fat percentage (P=0·019) as shown in Table 2. A relationship between LIPE genotype and milk fat content is to be expected given the biochemical function of this enzyme, but the observed effect was only suggestive and needs to be confirmed. The highly suggestive association detected between the c.558C>T polymorphism and milk yield (P=0·0032) might be related to the fact that the amount of energy available to the mammary gland to produce milk is highly dependent on the levels of lipid mobilization. In fact, it is well known that dietary supplementation with fat contributes to meeting the energy requirements of high-producing dairy cows (Wu & Huber, Reference Wu and Huber1994). However, we should keep in mind that none of the LIPE polymorphisms appears to have consequences at the functional level and that associations vary from one SNP to another.
Table 2. Relevant associations between the most abundant LIPE genotypes and dairy traits (suggestive and highly suggestive associations are shown in bold)
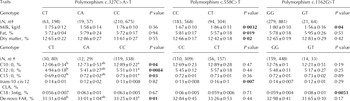
a,b Means within rows without a common superscript show either highly suggestive (0·0013<P<0·01) or suggestive (0·01<P<0·05) differences
† N=Sample size, n=number of records
‡ Calculated as indicated by Moate et al. (Reference Moate, Chalupa, RC and Lean2007)
With regard to milk FA composition (Table 2, Supplementary Tables 3–5), polymorphism c.327C>A>T showed a highly suggestive association (P=0·0084) with 12:0 FA, while suggestive associations were found for FA synthesized de novo, 10:0 and 15:0 (Table 2). Highly suggestive associations were also detected between c.558C>T and c.1162G>T genotypes and trans-10 cis-12 CLA (P=0·007) and 18:3 n-6g (P=0·0051) contents, respectively (Table 2). We also performed a haplotype analysis that was very consistent with the single-SNP data presented so far. In this way, the comparison of CCG v. CTG haplotypes yielded highly suggestive differences for milk yield (P=0·005) and 10-trans 12-cis CLA milk content (P=0·005), while suggestive differences were observed for 14:0 (P=0·04) and 15:1 (P=0·04) contents. Moreover, the comparison of CCG v. TCG haplotypes allowed us to detect suggestive differences for 10:0 (P=0·03), 15:0 (P=0·03) and contents of fatty acids synthesized de novo (P=0·02).
These associations should be interpreted with caution because of limited sample size and the fact that just a single breed has been analysed, two features that make it difficult to draw general conclusions that could be extrapolated to other goat populations. However, it should be mentioned that the associations we have found recapitulate the preference of LIPE to release medium-chain and unsaturated FA in fat cells (Raclot & Groscolas, Reference Raclot and Groscolas1993). In this way, one of the strongest associations detected in our study was the one relating LIPE genotype with 18:3n-6g abundance (Table 2), while highly suggestive effects were also demonstrated for trans-10 cis-12 CLA. This agrees well with the observation of Gavino & Gavino (Reference Gavino and Gavino1992) indicating that LIPE selectively mobilizes polyunsaturated FA. The highly suggestive association between goat LIPE genotype and milk 12:0 content was also quite remarkable since Raclot & Groscolas (Reference Raclot and Groscolas1993) have shown that this is one of the saturated FA more efficiently hydrolysed by LIPE. The existence of these relationships does not imply that any of the SNP we have found has a causal effect. In fact, we do not have any evidence to believe so, but these SNP might be linked to a yet to be found polymorphism with such effects. Future identification of causal SNP affecting the γ-linolenic levels of milk would be very relevant because this FA is the precursor of prostaglandins of the 1-series (PGE1) and of 15-(S)-hydroxy-8,11,13-eicosatrienoic acid, two molecules with a marked impact on human health (Fan & Chapkin, Reference Fan and Chapkin1998). These two metabolites are reported to exert clinical efficacy in a variety of pathological conditions, including abolition of chronic inflammation, vasodilation and decreasing of blood pressure, and the inhibition of smooth muscle cell proliferation associated with progression of atherosclerosis (Fan & Chapkin, Reference Fan and Chapkin1998). Moreover, there is evidence that γ-linolenic acid has antitumourigenic and antimetastatic properties (Fan & Chapkin, Reference Fan and Chapkin1998). In consequence, augmentation of γ-linolenic acid levels in milk through genetic manipulation would represent an important advance in order to improve the nutritional properties and consumer perception of this food product.
This research was funded by projects AGL2007-66161-C02-01 and AGL2007-66161-C02-02 awarded by the Spanish Ministry of Science and Innovation. A Zidi received fellowships from the Spanish Agency of International Cooperation and Development and of the Center of Agrigenomic Research.
Supplementary Table 1. Primers used for the amplification of the goat LIPE cDNA and annealing temperatures

Primer locations with regard to sequence NM_001080220 were LIPE-Fw1 (54-73), LIPE-Rv1 (961-982), LIPE-Fw2 (753-772), LIPE-Rv2 (1620-1639) LIPE-Fw3 (1386-1406), LIPE-Rv3 (2127-2147), SNP1-Fw (309-328), SNP1-Rv (424-443), SNP2-Fw (579-598), SNP2-Rv (634-655), SNP3-Fw (1166-1185), SNP3-Rv (1249-1268)
Supplementary Table 2. Association between the goat LIPE genotype and dairy traits

† Decimal logarithm of SCC value/1000
Supplementary Table 3. Association between polymorphism c.327C>A>T LIPE genotype and milk fatty acid composition in Murciano-Granadina goats

a,b Means within rows without a common superscript show either highly suggestive (0·0013<P<0·01) or suggestive (0·01<P<0·05) differences
† Geometric and position isomers of cis-9, trans-11 and trans-10, cis-12 CLA
‡ Calculated as indicated by Moate et al. (Reference Moate, Chalupa, RC and Lean2007)
Supplementary Table 4. Association between polymorphism c.558C>T LIPE genotype and milk fatty acid composition in Murciano-Granadina goats

† Geometric and position isomers of cis-9, trans-11 and trans-10, cis-12 CLA
‡ Calculated as indicated by Moate et al. (Reference Moate, Chalupa, RC and Lean2007)
Supplementary Table 5. Association between polymorphism c.1162G>T LIPE genotype and milk fatty acid composition in Murciano-Granadina goats

† Geometric and position isomers of cis-9, trans-11 and trans-10, cis-12 CLA
‡ Calculated as indicated by Moate et al. (Reference Moate, Chalupa, RC and Lean2007)

Supplementary Fig. 1. Partial amino acid sequence of goat LIPE enzyme. The NH2-terminal domain is underlined. The α/β hydrolase fold domain is shown in bold letter. The GXSXG motif is indicated with a black box. Phosphorylation sites are marked with grey boxes.


