


Uric acid (i.e. urate) excretion in bovine milk and urine has recently attracted attention for two primary reasons. First, uric acid in milk is considered a potent antioxidant, similar to α-tocopherol, carotenoids, and ascorbic acid, and is believed to increase the oxidative stability of milk and dairy products (Østdal et al. Reference Østdal, Andersen and Nielsen2000). Second, purine derivatives, i.e. hypoxanthine, xanthine, uric acid, and allantoin, that originate via the digestion and metabolism of purine bases, are believed to reflect the microbial nitrogen flow to the duodenum; which may, in turn, be used as potential indicators of rumen microbial protein yield in high-yielding dairy cows (Gonzáles-Ronquillo et al. Reference Gonzáles-Ronquillo, Balcells, Belenquer, Castrillo and Mota2004; Tas & Susenbeth, Reference Tas and Susenbeth2007).
The metabolites hypoxanthin, xanthine, uric acid and allantoin are all found in urine and milk to varying extents (Tiemeyer et al. Reference Tiemeyer, Stohrer and Giesecke1984). The enzyme xanthine oxidase (XO; EC 1.17.3.2), which mediates the conversion of hypoxanthin to xanthine and further to uric acid, is abundant in milk (Fox & Kelly, Reference Fox and Kelly2006). However, whether substrate availability of hypoxanthine and xanthine reflect increases in uric acid production during the handling of the sample is unknown and warrants further investigation. Allantion, is a product of uric acid degradation, and originates primarily from hepatic synthesis. From the liver, allantoin is secreted into circulation (Giesecke et al. Reference Giesecke, Ehrentreich, Stangassinger and Ahrens1994). The oxidation of urate to allantoin includes multiple steps involving more enzymes and intermediate compounds (KEGG information). However, the first step converts urate to 5-hydroxyisourate and is believed to be the hydrogen peroxide (H2O2) generating step. Uric acid oxidase (i.e. uricase; EC 1.7.3.3) which mediates the production of 5-hydroxyisourate from uric acid (Kahn et al. Reference Kahn, Serfozo and Tipton1997) is, to our knowledge, not present in bovine milk and is therefore an appropriate enzyme to utilize for an enzymatic-fluorometric assay for the determination of uric acid in milk. For this paper, the determination of uric acid is based on the enzymatic oxidation of uric acid to 5-hydroxyisourate via uricase. The liberated H2O2 reacts stochiometrically with ADHP (10-acetyl-3,7-dihydroxyphenoxazine) mediated by the peroxidase enzyme and the fluorescent product, resorufin, is measured fluorometrically.
Several analytical methods have been practiced in measurements of uric acid in dairy products. Most methods involved extensive pre-treatment of samples including deproteinization (Indyk & Woollard, Reference Indyk and Wollard2004; Østdal et al. Reference Østdal, Andersen and Nielsen2000) and homogenization, centrifugation, and filtration (Dinkci et al. Reference Dinkci, Akalin, Gönc and Unal2007) coupled with time consuming analyses such as HPLC with UV detection (Giesecke et al. Reference Giesecke, Ehrentreich, Stangassinger and Ahrens1994; Indyk & Woollard, Reference Indyk and Wollard2004), capillary electrophoresis (Izco et al. Reference Izco, Tormo and Jiménez-Flores2002) or cyclic voltammetry (Chen et al. Reference Chen, Gorton and Åkesson2002).
The determination of uric acid via an enzymatic-fluorometric assay with minimal pre-treatment of milk samples is discussed in this paper. The method is fast to conduct and well-suited for large scale analyses of raw milk. The objectives of this study are to (1) validate a new method for determination of uric acid in milk via an enzymatic-fluorometric method; (2) to examine the effect of storage and preserving treatments on uric acid concentration using the current method; and (3) to relate uric acid concentration in milk with other cow (e.g. breed and parity) and milk (e.g. fat, protein and lactose) parameters.
Materials and Methods
Sample collection
Fresh composite milk samples (n=1,072) were collected at random from both Jersey (n=38) and Danish Holstein (n=106) cows from one local herd. The milking system is a robotic system, where representative milk samples are taken to a 10 ml tube, pre-dosed with the preservative Bronopol® to obtain 100 mg/kg sample. Milk samples were collected daily every morning over an 8 week period and stored at 4°C until further analysis on the same day.
Enzymatic-fluorometric determination of uric acid
The present determination of uric acid is based on the enzymatic oxidation of uric acid to 5-hydroxyisourate via uricase (Fig. 1; EC 1.7.3.3). The liberated H2O2 reacts stochiometrically with ADHP (MW 257.24; Synchem OHG, D-34587 Flesberg/Altenburg, Germany) mediated by the peroxidase enzyme (EC 1.11.1.7) and the fluorescent product, resorufin, is measured fluorometrically (ex 544, em 590).
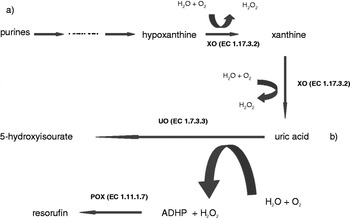
Fig. 1. Description of chemical pathway for assay. (a) The degradation pathway from purines to uric acid. (b) The degradation of uric acid to the fluoroscent product resorufin, used in the present analysis. XO is xanthine oxidase, UO is uric acid oxidase, POX is peroxidase, ADHP is 10-acetyl-3,7-dihydroxyphenoxazine.
Reagents
Reagent 1: Immediately before use, uricase enzyme (UAO-211; Toyobo Enzymes, Osaka, Japan) was adjusted to 4·0 U/ml with borate buffer (pH 8·0, 25 mm with 0·25 mm-EDTA and 0·005% Triton X-100). Reagent 2a: Na/K-phosphate buffer, pH 6·0, 25 mm-Reagent 2b: ADHP stock solution consisting of 4·0 mg ADHP solubilized in 0·5 ml dimethyl sulfoxide (DMSO). To this, 4·0 ml Reagent 2a was added. Reagent 2c: Peroxidase enzyme (PEO 302; Toyobo Enzymes) was solubilized in Reagent 2a to obtain a final concentration of 100 U/ml. Reagent 2 (final working reagent): Reagents 2a, 2b and 2c were mixed in a 56:8:1 ratio immediately before use.
Procedure
A stock standard was prepared consisting of uric acid (51 449; Fluka Analytical, Exeter, Devon, UK) diluted in deionized water to obtain a final concentration of 200 μm-uric acid. A standard curve was generated from the stock standard (200 μm-uric acid) and included 0, 10, 20, 30, 50, 80, 120 and 180 μm-uric acid. Fresh milk samples were heat treated (82°C for 10 min) and then diluted 1:4 (milk:water) with deionized water. After heat treatment and dilution, 30 μl of samples and prepared standards were added to 96-well plates in either duplicate, triplicate or quadruplicate (see below). To each well, 100 μl Reagent 1 was added and plates were incubated for 3 min at 37°C. Following incubation, 100 μl working Reagent 2 was added to each well and plates were incubated for 8 min at 37°C. Plates were immediately read using a fluometer (Fluostar Galaxy; BMG LABTECH GmbH, Offenburg, Germany; ex 544, em 590 nm).
Precision
Intra assay variation was tested using a total of 1,072 fresh milk samples. Of these, 832 samples were run in duplicate, 160 samples in triplicate and 80 samples in quadruplicate following the assay procedure described above. For determination of inter assay variation (i.e. between days), 20 standard curves were generated on separate days (n=20) as described above.
Linearity and recovery
A total of 36 fresh milk samples were subjected to spiking with three levels of uric acid, i.e. plus 20, 40, and 60 μm. Each milk sample was divided into 4 tubes and subjected to either no addition of standard or spiked with 20, 40 or 60 μm-uric acid standard. All samples were analyzed for uric acid concentration in duplicate following procedures described above. Spiking recovery was calculated as recovery (%)=(expected/observed)∗100; where the expected (μm)=[uric acid] of unspiked sample+internal standard (spike; i.e. 20, 40 or 60 μm), and the observed=[uric acid] of spiked sample.
Detection limit of the assay
9 replicates of 0, 1, 2, 3, 5, and 8 μm-uric acid respectively, were measured on a micro plate with ordinary standards.
Comparison with a reference method for uric acid analysis
A total of 140 fresh milk samples were each divided into two tubes and analyzed for uric acid concentration using the present enzymatic-fluorometric method and a reference method. The reference is a standard colorimetric method used primarily for determination of uric acid in plasma/serum and urine samples. Prior to analysis, milk samples were precipitated as follows: 3·0 ml fresh milk was supplied with 1·75 ml 12% TCA solution, mixed and filtered (Whatman Grade No. 4 Filter Papers; Northbrook, IL, USA). To neutralize, 0·6 ml of the filtrate was added to 0·1 ml 1·25 m-NaOH solution. The neutralized filtrate was analysed for uric acid using an autoanalyzer (ADVIA 1650; Siemens Diagnostics; Deerfield, IL, USA) according to standard operating procedures (uricase/peroxidase/4-aminofenazon/N-ethyl-N-(2-hydroxy-3-sulfopropyl)-3-methylanilin). Data were reported in mm. Intra and inter assay CV precision was 2·5 and 3·5%, respectively; accuracy (i.e. bias) −0·3% and +0·3% for low and high control material, respectively.
The effect of preserving-treatment on uric acid concentration
Experiment I
The objective of Experiment I was to determine the effect of storage temperature (4°C and −18°C) on uric acid concentration in milk. A total of 72 fresh milk samples were heat treated immediately after arrival and each sample was then divided into three separate tubes (A, B and C). For tube A, samples were analysed for uric acid immediately after the heat treatment; for tube B, samples were stored at 4°C for 24 h before analysis; and for tube C, samples were stored at −18°C for 24 h before analysis. All samples were analyzed in triplicate following procedures described above.
Experiment II
The objective of Experiment II was to determine the effect of supplementing preservatives (DMSO and DMSO+allopurinol) and storage temperature (4°C and −18°C) on uric acid concentrations. Allopurinol (3,5,7,8-tetrabicyclo(4.3.0) nona-3,5,9-trien-2-one) is a known xanthine oxidase inhibitor. DMSO (dimethylsulfoxide) is a potent solvent for allopurinol; the terminal concentration of allopurinol was 1·4 mm in the sample. A total of 24 fresh milk samples were immediately heat treated. Each milk samples was then divided into 2 tubes (A and B; 1·0 ml total volume per tube) and either 50 μl DMSO (tube A) or DMSO+allopurinol (tube B) was added. Both samples A and B were then further divided into three fractions: 1) sample was analysed immediately; 2) sample was analysed after 24 h at 4°C; and 3) sample was analysed after 24 h at −18°C. All samples were analyzed in triplicate following procedures described above.
Relationship between uric acid and other cow- and milk-level parameters
A subset of random milk samples (n=455) were used to 1) determine relationship between uric acid and other milk components (e.g. fat, protein and lactose) and 2) examine the effect of cow-level parameters (e.g. breed and parity) on uric acid concentration using the enzymatic-fluorometric method as described above. Data consisted of 83 Danish Holstein and 35 Jersey cows ranging from 2 to 302 d in milk (DIM; mean=164±86). Within breed, cows were classified as primiparous (1st parity; n=34 Danish Holstein; n=17 Jersey) or multiparous (⩾2nd parity; n=49 Danish Holstein; n=18 Jersey). Milk samples were analyzed for urea, citrate, lactose, fat and protein by IR-spectroscopy (CombiFoss 4000, Foss Electric Ltd., Hillerød, DK) and SCC via a commercial laboratory (Eurofins, Holstebro, DK) using standard Fossomatic cell counter (EN ISO 13366-3; Foss Electric Ltd., Hillerød, DK).
Statistical analysis
Assay validation
Data were analyzed using SAS version 9.2 (SAS, 2008). PROC CORR was used to generate correlations between the expected and observed values (i.e. linearity) and correlations between ADVIA and the present enzymatic-fluorometric method (i.e. EZ). The MIXED procedure of SAS was used to determine differences in uric acid concentration between ADVIA and EZ and the model included assay only.
Effect of preserving treatment on uric acid concentrations
The MIXED procedure of SAS was used to determine differences in uric acid concentration for Experiments I and II. Experiment I was analyzed to determine the effect of storage (i.e. none, 4°C for 24 h, and −18°C for 24 h) on uric acid concentration in milk. For Experiment II, the model included storage, preservative and the interaction of preservative×storage.
Relationship between uric acid, cow parameters and milk components
Milk SCC were transformed to log10 values for statistical analysis. Data for this study were analyzed using the MIXED procedure of SAS. The model was used to determine the effect of parity (primiparous and multiparous), breed (Danish Holstein and Jersey) and stage of lactation on uric acid concentrations during lactation. Stage of lactation was classified as early (2–100 DIM), mid (101–200 DIM) and late (201–302 DIM) lactation. The model included breed, parity, stage of lactation and their interactions.
For all models described above, the random effect was sample and the degrees of freedom were estimated with the Kenward-Roger specification in the model statement. Data are presented as least square means (LSM) and standard error of the mean (SEM). Separation of LSM for significant effects was accomplished using the Tukey's option within the MIXED procedure of SAS.
Results
Assay validation
Tables 1 and 2 show the intra and inter assay variation, respectively, for 1,072 samples analyzed uric acid concentration using the present enzymatic-fluorometric method. For samples ran in duplicate, triplicate and quadruplicate, the averages were 3·0, 3·1 and 2·9%, respectively, with an overall intra assay variation of 3·0% (Table 1). For the inter assay variation (Table 2), the highest CV (30·2%) and lowest (1·8%) was observed with standards 10 μm and 80 μm, respectively.
Table 1. Mean and intra assay variation (CV%) of milk samples analyzed for uric acid concentration μm), in either duplicate, triplicate or quadruplicate, using an enzymatic-fluorometric method
Table 2. Twenty standard curves were generated on separate days for determination of inter assay variation (i.e. day to day variation; CV%) for an enzymatic-fluorometric method for quantification of milk uric acid (μm)
Table 3 shows the means of the expected, observed and recovery (%) for samples spiked with 0 (i.e. no spike), 20, 40 or 60 μm-standard. The % recovery averaged 103·4, 107·0 and 107·5% for samples spiked with 20, 40 or 60 μm-standard, respectively. Figure 2 shows the Pearson correlation between the observed and expected uric acid concentrations in milk after spiking with standards. A highly significant correlation (r=0·98) was observed between the observed and expected uric acid concentrations. When comparing the present EZ with the ADVIA reference method, the overall mean uric acid concentration in milk was higher (P<0·01) using the EZ (115±2·7 μm) when compared with the ADVIA method (108±2·7 μm; Fig. 3). Even though differences were observed with regards to the overall means, we observed a highly significant positive correlation (r=0·96) between EZ and ADVIA methods. The detection limit of the assay is below 1 μm, all tested standards (1, 2, 3, 5, and 8 μm) were significantly different from the 0-standard (P<0·01; data not shown).
Fig. 2. Relationships between the observed and expected uric acid concentrations in milk using an enzymatic-fluorometric method after spiking with 20 (○), 40 (□), and 60 (x) μm-uric acid standards.

Fig. 3. Relationships between uric acid concentrations in milk (n=140) using either the present enzymatic-fluorometric method (EZ) or a standard colorimetric method after precipitation of protein and fat (ADVIA).
Table 3. Means±standard deviations (STD) of spike and recovery (%) results for milk samples (n=36) analyzed for uric acid concentration (μm) using an enzymatic-fluorometric method after spiking with either no spike (0) or 20, 40, and 60 μm-uric acid standards
1 % Recovery=(observed/expected)∗100
Effect of storage and preserving treatment on uric acid concentrations
For Experiment I, storage of fresh milk samples after heat treatment at 4°C for 24 h resulted in the lowest concentration of uric acid when compared with no storage (i.e. none) and samples stored at −18°C for 24 h (Fig. 4A). In addition, heat treating milk samples prior to storage at −18°C for 24 h (i.e. Experiment I) resulted in higher concentrations of uric acid than heat treating after storage (data not shown).

Fig. 4. The effect of storage level (i.e. none, 4°C or −18°C for 24 h) on uric acid concentrations in milk for Experiment 1 (A). Fresh milk samples were heat treated prior to storage and analysis. a,b,c. Least square means with differing letters differ (P<0·01). Figure 4B shows the effect of preservative (DMSO [closed bars] or DMSO+allopurinol [open bars]) and storage on milk uric acid concentration using an enzymatic-fluorometric assay. No differences (P<0·01) were observed between preservatives within storage level.
Figure 4B shows the effect of preservative (i.e. DMSO and DMSO+allopurinol) and storage on milk uric acid concentration (i.e. Experiment II). Type of preservative did not affect milk uric acid concentrations (P=0·96). Similar to results from Experiment I, storage of milk samples at 4°C for 24 h resulted in lower concentrations of uric acid when compared to no storage or storage at −18°C for 24 h (data not shown). Although the interaction of preservative x storage was significant (P<0·01), no differences were observed between preservatives within storage level (i.e. none, 4°C or −18°C for 24 h).
Relationship between uric acid, cow parameters and milk components
Milk uric acid concentrations were not different (P=0·65) between Danish Holstein (118±5·3 μm) and Jersey cows (109±8·1 μm). In addition, no differences (P=0·48) in uric acid concentration were observed between primiparous (114±4·8 μm) and multiparious cows (118±4·0 μm); and stage of lactation had no effect (P=0·65) on milk uric acid concentration. In addition, the interactions among breed, parity and stage of lactation were not significant. Table 4 shows the means, standard deviations, and Pearson correlations between uric acid and other components in milk. Milk SCC and urea had positive and negative relationships with uric acid, respectively. However, the correlation coefficients were very weak (0·10 and −0·11, n=455, respectively). No other milk parameters, including DIM, were related to uric acid concentration in milk.
Table 4. Means, standard deviations (sd) and Pearson correlation coefficients (r) between uric acid and other componentsFootnote 1 in milk using an enzymatic-fluorometric method
1 Units for milk components include uric acid (μm), milk (kg per milking), fat (%), somatic cell count (SCC; log10[SCC]), protein (%), lactose (%), urea (mM) and citrate (%)
Discussion
This paper introduces a new enzymatic fluorometric method for determination of uric acid in milk and other opaque or transparent matrices. In order to inactivate indigenous enzymes (e.g. catalase, peroxidases and XO) that might interfere with the present enzymatic determination of uric acid, milk samples were heat treated before analyses (82°C for 10 min). The present heating conditions should be well within denaturation limits for most indigenous enzymes (Jenness & Patton, Reference Jenness and Patton1959; Andrews et al. Reference Andrews, Anderson and Goodenough1987; Farkye, Reference Farkye2003). However, xanthine oxidase appears to be one of the most heat resistant indigenous enzymes (Greenbank & Pallansch, Reference Greenbank and Pallansch1962; Demott & Praepanitchai, Reference Demott and Praepanitchai1978; Griffiths, Reference Griffiths1986). In addition, it is well known that many enzymes including XO may “reactivate” following termal inactivation (e.g. Greenbank & Pallansch, Reference Greenbank and Pallansch1962). Whether the present heat treatment at 82°C for 10 min resulted in complete destruction of XO activity remains unknown.
To our knowledge, no studies have examined the effect of storage on milk urate concentration. The observed decrease in urate after storage at 4°C for 24 h (Experiments I and II) may be partly ascribed to the degradation of urate. In this context, the non-enzymatic oxidative degradation of urate cannot be ignored. Uric acid, due to its properties as antioxidant and radical scavenger, may have been converted to allantoin, allantoic acid, glyoxylate, and possibly glycine and oxalate (Becker, Reference Becker1993); however, these compounds were not measured in this study.
Increase in urate during storage (Experiment I) may be partly explained by the oxidation of intrinsic xanthine and hypoxanthine (Fig. 1). The oxidation of xanthine and hypoxanthine (producing H2O2) to uric acid is believed to be non-reversible and the working XO under consideration, may have been reactivated after heat treatment. This increase in XO activity is believed to be due to the availability of the enzyme from the milk fat globule membrane (Fox & Kelly, Reference Fox and Kelly2006). This might explain a moderate generation of urate from the precursors hypoxanthine and xanthine. The content of these metabolites in composite bovine milk is generally considered to be low, i.e. from 1–2% of the urate level or less (Gonzáles-Ronquillo et al. Reference Gonzáles-Ronquillo, Balcells, Guada and Vicente2003 & Reference Gonzáles-Ronquillo, Balcells, Belenquer, Castrillo and Mota2004). However, in the present study, re-analyses of samples with DMSO and allopurinol, a XO inhibitor, after storage revealed no marked effect of either allopurinol or DMSO, whereas an effect of storage was still evident.
Several studies have examined the use of purine derivatives as an indicator of bacterial nitrogen flow through the digestive system of ruminants. Non-invasive methods are preferred, and milk is an ideal candidate due to the ease of collection, on-farm information of milk production, and the opportunity for application commercially. The main focus has furthermore been on allantoin and urate for quantitative and analytical reasons. Some researchers speculate that the detection of urinary allantion and urate are better predictors of bacterial N flow than milk purine derivatives (Timmermans et al. Reference Timmermans, Johnson, Harrison and Davidson2000; Gonzáles-Ronquillo et al. Reference Gonzáles-Ronquillo, Balcells, Guada and Vicente2003 & Reference Gonzáles-Ronquillo, Balcells, Belenquer, Castrillo and Mota2004; Tas & Susenbeth, Reference Tas and Susenbeth2007 (review)). Milk yield has been postulated to be a factor that might influence the potential of uric acid as a predictor of microbial protein passage in the duodenum. Tiemeyer et al. (Reference Tiemeyer, Stohrer and Giesecke1984) found a decrease in the uric acid concentration when milk yield increased. Giesecke et al. (Reference Giesecke, Ehrentreich, Stangassinger and Ahrens1994) found a significant (P<0·05) relationship between energy intake and uric acid excretion in milk (r=0·61; n=16), suggesting increased rates of mammary purine turnover at higher milk yields. However, nitrogen intake or excretion was not measured. For this study, no relationship was observed between milk uric acid concentration and milk yield or milk components. Unfortunately, feed energy intake was not measured for this study. Therefore, future studies examining the effect of feed intake on milk uric acid concentration and its potential use as an indicator of rumen nitrogen flow is warranted.
Conclusions
The present enzymatic-fluorometric determination of uric acid in milk and other matrices is a reliable analytical method. The pre-treatment of samples is minimal, the analytical time is almost negligible compared with other methods, and the method is ideal for analysis of large number of samples. Simple heat treatment prior to storage and analysis is recommended in order to reduce the potential impact of intrinsic enzymes. The addition of a XO inhibitor did not influence milk urate concentrations and may indicate that heat treatment before analysis was sufficient to degrade XO in milk. Storage of milk samples at 4°C or −18°C for 24 h may influence the uric acid content of milk. No relationship was observed between milk uric acid and cow parameters such as milk yield and milk components. Authors recommend a heat treatment followed by either an immediate analysis of fresh milk samples or storage at −18°C until further analysis.
Carsten Berthelsen is kindly acknowledged for excellent technical assistance and skilled analytical work. This study, which was part of the Biosens project, was funded by the Danish Ministry of Food, Agriculture and Fisheries and the Danish Cattle Association.


