Lacaune sheep originated in France and produce the milk used to prepare Roquefort cheese. This breed has become one of the world's highest-yielding milk sheep breeds, with average daily milk yields of 1·59 l and a total milk yield of 270 l over a 165-d lactation period (Barillet et al. Reference Barillet, Marie, Jacquin, Lagriffoul and Astruc2001). Since 1992, 17 countries have officially imported dairy Lacaune from France. In Spain, for example, the Lacaune breed produces a standard daily milk yield of 1·43 l, compared with Manchega production of 0·75 l (Such & Caja, Reference Such and Caja1995). In Spain, our group has observed mean milk yields of 448 l/ewe over a 238-d lactation period (Hernandez et al. Reference Hernandez, Elvira, Gonzalez-Martin, Gonzalez-Bulnes and Astiz2011). In Canada, the productivity of the Lacaune is 330 l in the first lactation (lactation period, 220 d) and 392 l in the second and subsequent lactations over a 241-d lactation period (Regli, Reference Regli1999).
Production of Roquefort cheese is strictly regulated by legislation of the European ‘protected designation of origin’ (PDO) scheme. This legislation mandates animal management involving only one lambing per year and a 30-d suckling period. For producers outside the Roquefort Designation of Origin, who cannot charge the high prices of true Roquefort cheese, these production conditions are not cost-effective, and intensive management is the only way to achieve profitable and sustainable farms. However, little is known about the dairy performance of Lacaune sheep during complete lactation periods under intensive management.
Fitting an appropriate mathematical model to lactation curves is required in order to study the factors that may affect milk yield (Pollot & Gootwine, Reference Pollott and Gootwine2000). Moreover, reliable models of lactation curves allow prediction of milk yield and detection of systematic changes in yield caused by environmental or management factors (Morant & Gnanasakthy, Reference Morant and Gnanasakthy1989). Our group recently determined that the Pollott additive function is one of the best for estimating lactation curves for Lacaune dairy sheep under intensive management in Spain (Elvira et al. Reference Elvira, Hernandez, Cuesta, Cano, Gonzalez-Martin and Astiz2013). In fact, this mathematical model achieved the best individual fits for lactation curves from lactation numbers 1–5 (L1–L5).
Cluster analysis, or clustering, involves grouping individuals into ‘clusters’ or ‘types’ such that members of one cluster are more similar to each other than to members of other clusters based on one or more characteristics. After clustering, explorative analyses can be performed to determine the specific characteristics of each cluster. The differential characteristics of the clustering methods are: there is no previous requirement of determined relationships nor characteristics, in order to derive the clusters or types within a set of cases. Therefore, the clusters found can be described as ‘naturally’ or ‘really’ occurring. On the other hand, no variable of interest for the characterisation of a subset is previously included in the clustering process. Finally, the complete set of lactation data can be simultaneously included into the analysis. Hence there is no need to simplify the study of the cases through partial characteristics, as is the case with classical statistical methods, such as GLM or Regression Analyses. These characteristics of the mathematical clustering process make the methodology very robust, when differences or relationships among characteristics of groups have to be found. These statistical analyses are used in many fields, including machine learning, pattern recognition, image analysis, information retrieval, and bioinformatics (Lebart et al. Reference Lebart, Morineau and Piron1995; Bécue Bertaut & Valls i Marsal, Reference Bécue Bertaut and Valls i Marsal2011). Recently this approach has been used to define clusters of lactation curves (Cardenas, Reference Cardenas2009), which can identify factors in the animals or in their environment that are associated with particular types of lactation curve.
Milk yield is affected by many factors, which have been extensively studied for animals under traditional management (Ruiz et al. Reference Ruiz, Oregui and Herrero2000; Peralta-Lailson et al. Reference Peralta-Lailson, Trejo-González, Pedraza-Villagómez, Berruecos-Villalobos and Vasquez2005; Oravcová et al. Reference Oravcová, Margetín, Peškovičová, Daňo, Milerski, Hetényi and Polák2006) as well as under intensive management (Pollott & Gootwine, Reference Gootwine and Pollott2000). Some factors are physiological characteristics of the ewe, such as lactation number (Gabiña et al. Reference Gabiña, Arrese, Arranz and Beltran de Heredia1993; Ruiz et al. Reference Ruiz, Oregui and Herrero2000; Pollott & Gootwine, Reference Pollott and Gootwine2004), age at first lambing (Hernandez et al. Reference Hernandez, Elvira, Gonzalez-Martin, Gonzalez-Bulnes and Astiz2011), length of the dry period (Hernandez et al. Reference Hernandez, Elvira, Gonzalez-Martin and Astiz2012), and prolificacy (Butler et al. Reference Butler, Fullenkamp, Cappitello and Handwerger1981; Schoknecht et al. Reference Schoknecht, Nobrega, Petterson, Ehrhardt, Slepetis and Bell1991; Byatt et al. Reference Byatt, Warren, Eppard, Staten, Krivi and Collier1992; Gootwine & Pollott, Reference Gootwine and Pollott2000). Pregnancy itself has also been shown to affect milk production (Gootwine & Pollott, Reference Gootwine and Pollott2000; Pollott & Gootwine, Reference Pollott and Gootwine2004). Other factors are environmental. For example, lambing in early spring is associated with higher yields in ewes under traditional management (Barillet, Reference Barillet1985; Gabiña et al. Reference Gabiña, Arrese, Arranz and Beltran de Heredia1993; Carta et al. Reference Carta, Sanna and Casu1995; Ruiz et al. Reference Ruiz, Oregui and Herrero2000). In animals under intensive conditions (without grazing), Gootwine & Pollott (Reference Gootwine and Pollott2000) observed seasonal differences in milk production due to photoperiod: yields were higher during the last month of pregnancy, when days were longer. Nutrition level during pregnancy, particularly during the last third of pregnancy, is another environmental factor shown to affect milk productivity (Byatt et al. Reference Byatt, Warren, Eppard, Staten, Krivi and Collier1992; Bizellis et al. Reference Bizelis, Charismiadou and Rogdakis2000; Charismiadou et al. Reference Charismiadou, Bizelis and Rogdakis2000; Cannas et al. Reference Cannas, Nudda and Giuseppe2002).
A detailed understanding of factors affecting milk productivity of Lacaune sheep would greatly benefit producers outside the Roquefort region, yet little information is available on complete lactations in Lacaune dairy sheep and the factors affecting yield of this breed under intensive management. Therefore, the present study used the Pollott additive model to fit lactation curves of Lacaune dairy sheep under intensive management, and then cluster analysis to investigate factors affecting lactation curve parameters and milk yield. This approach should help to establish the most profitable management guidelines for intensive Lacaune dairy farms.
Material and methods
Flock and management
This study includes data collected between 2005 and 2010 for 3652 sheep from a flock of 4000 on the Cerromonte Farm in Avila, Spain (latitude, 40·90 N; altitude, 900 m). The original flock was imported between 2005 and 2006 from the French Lacaune Association (Upra Lacaune Region of Aveiron). Flock management, described by Hernandez et al. (Reference Hernandez, Elvira, Gonzalez-Martin, Gonzalez-Bulnes and Astiz2011, Reference Hernandez, Elvira, Gonzalez-Martin and Astiz2012), can be summarised as follows. Animals were housed indoors, and food was rationed according to the sheep's production level. Reproductive management included five mating periods per year; different groups of ewes were kept with males for 25 d to allow natural mating. Ewe lambs were mated for the first time between 8 and 10 months of age. The mean age at first lambing was 432±77·4 d (14·4 months). The ewes were mated again approximately 100–140 d after lambing. From the day after lambing, ewes were milked twice a day, with no suckling period for lambs, and milking continued until production dropped below 0·5 l/d or until 30 d before the next lambing, when they were dried off.
The following data were collected for individual ewes: month of birth (MB), date of birth, month of first conception (MFC), month of first lambing (MFL), date of first lambing, age at first lambing (AFL), age at current lambing (AGE), month of lambing (ML), interval between lambing (IL) and month of conception (MC). Milk production and reproductive records were collected, stored and validated using the on-farm software Alpro Windows (DeLaval, Tumba, Sweden). Altogether, 642 109 daily milk yield records were taken from 7788 lactations, with an average of 82·45 daily records per lactation. There were 246 109 weekly milk yield records and an average of 31·71 weekly milk yield records per lactation. Of these lactations, 2690 were first (L1), 2318 were L2, 1605 were L3, 834 were L4 and 341 were L5. A total of 241 ewes gave L1–L5 complete lactations, 283 L1–L4; 581, L1–L3; 631, L1–L2; 1099, only L1.
The following yield data were collected for the current lactation: total milk yield (MY), days in milk (DIM), length of the dry period (DP), milk yield per day in milk (YDIM), peak yield (PY) and day of peak yield (DPY). Three persistency parameters were calculated to assess loss of milk yield per day: persistency at day 150 of lactation (P150), at day 105 (P105) and at day 70 (P70). The following parameters for previous lactation were collected: total milk yield (P-MY), days in milk (P-DIM), length of the dry period (P-DP) and previous interval between lambings (P-IL).
Data modelling and statistical analysis
Descriptive data were processed with SPSS® 19.0 (IBM Corporation, NY, USA). Cluster Analysis (Hartigan, Reference Hartigan1975) is based on the core idea of objects being more related to nearby objects than to objects farther away. As such, these algorithms connect ‘objects’ to form ‘clusters’ based on their distance. Cluster analysis was performed using SPAD.N (Système Portable pour l'Analyse des Données, version 5.6; DECISIA, France). The strategy used to perform the mathematical clustering was the ‘mixed strategy’ which combines divisive and agglomerative techniques, and which is the advised method for such a large amount number of data.
A total of 7788 lactations were included in the clustering analysis. Each lactation was made up of a total of 70 weekly yield data per lactation. Using the standard statistical terminology it was worked with 7788 cases and 70 variables.
The distance observed, in order to discriminate clusters or types was euclidean squared. The aggregation criterion for data was the minimal variance of Ward. The number of clusters is determined by the aggregation process that describes the hierarchical tree (Fig. 1) and the histogram of aggregation. Finally, a ‘consolidation’ process follows, which consists of re-allocating each case to the nearest cluster, by the k-average method.
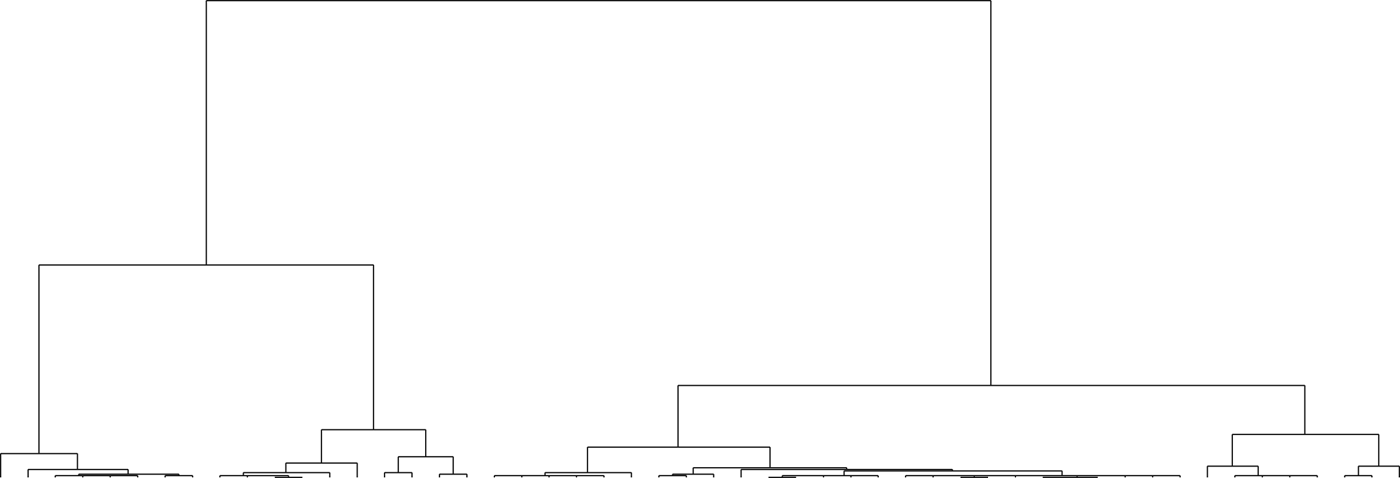
Fig. 1. Hierarchical tree obtained after performing the clustering analysis including weekly milk yield records of 7788 complete lactations of Lacunae sheep under intensive management conditions. Four clusters or types can be differentiated.
Once the definitive clusters or types have been discovered, the decision of the number of clusters used is taken by the observer, based on the hierarchical tree and on the aggregation index histogram. In this study, both the hierarchical tree and the histogram suggested that the optimal number of clusters was four. Afterwards, the description of the characteristics of each cluster is performed. The characterisation of the clusters consists of the comparison of the values of the variables studied in the n k cases of the cluster C k with the values of the same variable in the total set (studied population). The comparison is performed between the mean value of the variable in the cluster and that of the population through the following statistical process (Lebart et al. Reference Lebart, Morineau and Piron1995):
With  $\overline V_j $ being the average of the variable V j calculated based on the total set of n cases and with s j2 being the related variance.
With  $\overline V_k $ being the average of n k cases from the characterised cluster.
Under the null hypothesis that the n k cases were placed at random into the cluster C k, extracting without re-emplacement among the n possible cases, the expected value and variance of $\overline V_k $ are calculated:
 $$E\left( {\overline V_k} \right) = \overline V_j \quad Var\left( {\overline V_k} \right) = \displaystyle{{n - n_{ \bullet k}} \over {n - 1}}\displaystyle{{s_j^2} \over {n_{ \bullet k}}} = s_k^2 $$
Then, if n and n k are not too small the following expression
 $$t_k (\,j) = \displaystyle{{\overline V_k - \overline V_j} \over {s_k}} $$
follows approximately a normal distribution N(0,1).
When the null hypothesis is not rejected for one variable, this variable has no relevance for the characterisation of the cluster C k, because their values are not different from the n k values randomly chosen from the total set (Lebart et al. Reference Lebart, Morineau and Piron1995).
The method calculates a statistic for comparisons called the ‘T-value’; this value is compared with a normal distribution N(0,1) to determine the significance level of the difference between the cluster average and the global average. In the case of categorical variables, the method works in a similar way. It characterises the clusters based on the frequency distribution of values of the categorical variables that are higher or lower than the global frequency. The significance level for differences between the cluster percentage and global percentage is assessed by comparing the T-value with a normal distribution N(0,1). Based on the large muestral size of the current study, significance was defined as P<0·001, in order to enhance the robustness of the analyses.
The Pollott additive function was chosen to estimate lactation curves (Pollott, Reference Pollott2000) because this model was successful for fitting data from an intensive dairy Lacaune farm (Elvira et al. Reference Elvira, Hernandez, Cuesta, Cano, Gonzalez-Martin and Astiz2013). Modelling was performed as described in that study. In brief, the lactation curve parameters (Table 1) for each complete lactation were calculated using the Pollott additive model (Pollott, Reference Pollott2000) using an iterative least-squares non-linear curve fitting procedure (Procedure NLIN in SAS). The ‘best fit’ curve was obtained for each lactation. The parameters MS, MSL, NO, GR, NOD and DR of the Pollott additive function provide information about the following productivity and physiology parameters: milk secretion potential (MS), milk secretion loss of potential (MSL), proportion of MS at parturition (NO), udder tissue growth rate (GR), proportion of MS potential lost at parturition (NOD), and udder cell death rate (DR).
To compare the present data with those of other studies, fits using the central day of each week (t=day=7*week-3; week=1 to 40) were performed.
Results
Flock performance
Productive and reproductive characteristics of lactations included in the final analysis were as follows: AFL, 432·9±77·4 d (14·4 months); age of the ewes, 3·22±1·07 years; IL, 302±65 d; MY, 434±183 l; DP, 62±49·6 d and DIM, 234±63 d.
Clustering results: lactation types
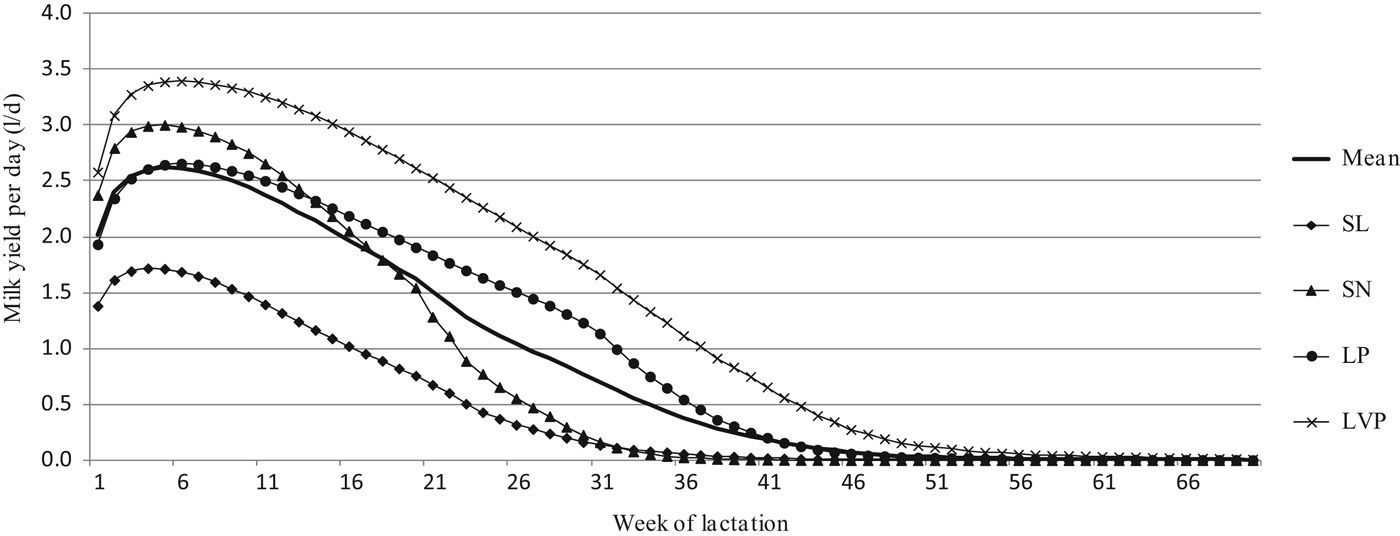
Cluster analysis identified four types of lactation curves for Lacaunae dairy sheep (Fig. 1). Based on the characteristics (length and area under the curve i.e. milk yield) of the average lactation curve of each cluster, the denominations used for each cluster were the following: ‘short and less productive’ (SL) lactations, which lasted ⩽23 weeks and produced >0·5 l/d, n=2137 (27·4% of the total); ‘short and normal’ (SN) lactations, which lasted ⩽27 weeks and produced >0·5 l/d, n=2039 (26·2%); ‘long and productive’ (LP) lactations, which lasted ⩽37 weeks and produced >0·5 l/d, n=2169 (27·9%); and ‘long and very productive’ (LVP) lactations, which lasted ⩽43 weeks and produced >0·5 l/d, n=1443 (18·5%) (Fig. 2).

Fig. 2. Mean lactation curves for each type identified by cluster analysis of 7788 lactation curves of Lacunae dairy sheep under intensive management. The following types were identified: SL=short and less productive lactations (n=2137); SN=short lactations of normal productivity (n=2039); LP=long and productive lactations (n=2169); LVP=long and very productive lactations (n=1443). The mean curve shows the global curve for all lactations (n=7488).
Table 1. Pollott additive function used to generate lactation curves of Lacaunae sheep under intensive management

† M t=daily milk yield on day t. MS and MSL are the milk secretion potential and loss of potential, respectively. NO and NOD are the proportions of MS and MSL achieved at lambing, and GR and DR are parameters reflecting the growth and death rates (Pollott, Reference Pollott2000)
Characterisation of lactation curves: continuous variables
Milk yield
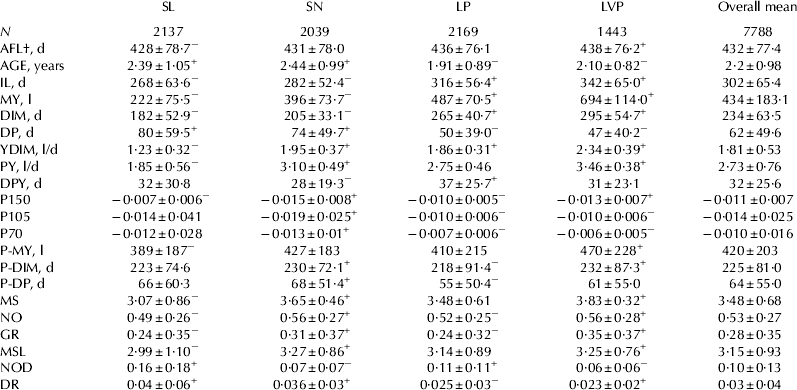
Table 2 summarises the characterisation of lactation types using continuous variables. Lactation type SL gave approximately 50% less milk production than the average (222±75·5 vs. 434±183·1 l; P<0·0001), lower yield per DIM, and lower production in the previous lactation (389±187 vs. 420±203 l; P<0·0001).
Table 2. Characterization of the four lactation types identified: SL=short and less productive lactations; SN=short lactations with normal productivity; LP=long and productive lactations; LVP=long and very productive lactations. Mean=global lactation curve. Data are shown as mean±sd
† AFL=Age at first lambing; AGE=age at current lambing; IL=interval between lambing; MY=total milk yield; DIM=days in milk; DP=length of the dry period; YDIM=milk yield per day in milk; PY=peak yield; DPY=day of peak yield; P150=persistency at day 150 of lactation; P105=persistency at day 105 of lactation; P70=persistency at day 70 of lactation; P-MY=total milk yield of the previous lactation; P-DIM=DIM of the previous lactation ; P-DP=DP of the previous lactation. Pollott parameters (Pollott, Reference Pollott2000): MS=milk secretion potential; MSL=loss of secretion potential; NO=proportion of MS achieved at lambing; NOD=proportion of MSL achieved at lambing; GR=growth rate parameter; DR=death rate parameter. Superscripts ‘+’ and ‘−’ indicate values significantly larger or smaller than the mean value in the last column of the same row (P<0·0001)
The parameters of the SL Pollott curve differed significantly from the average, indicating lower MS, NO, and GR, as well as higher NOD and DR (P<0·0001 in all cases).
Lactation type SN was associated with higher than average yield per DIM (1·95±0·37 vs. 1·81±0·53 l; P<0·0001) but lower total production, due to the fact that the lactation curve was shorter. It was associated with higher secretion capacity, as indicated by larger values for Pollott parameters MS, NO and GR; and shorter lactation, as indicated by larger values of Pollott parameters MSL and DR (P<0·0001 in all cases respective to global average values). Peak production was high, but persistency parameters were small, particularly P105 and P70. The length of the dry period before the current lactation, was larger than the average (68±51·4 vs. 64±55·0 d; P<0·0001).
All productivity parameters of lactation type LP were better than the average, with peak yield occurring later (37±25·7 vs. 32±25·6 d; P<0·0001). This type was also associated with a shorter dry period both before and after the current lactation (P<0·0001 in both cases).
Lactation type LVP was associated with the best productive results, with MY much greater than the average (694±114·0 vs. 434±183 l; P<0·0001) and lactation length much longer (295±54·7 vs. 234±63·5 d; P<0·0001). Peak yield (3·46±0·38 l) was the highest of all types and occurred around the same time as the average (31±23·1 vs. 32±25·6 d; P>0·05). This type was also associated with productive parameters for the previous lactation that were much better than the average (MY, 470±228 vs. 420±203 l; P-DIM, 232±87·3 vs. 225±81·0 d; P<0·0001 in both cases). Pollott parameters MS, NO and GR were significantly better for this type than for the average, while parameters NOD and DR were significantly smaller. P-IL was larger than the average (316±68·6 vs. 305±64·8 d; P<0·001).
Reproductive results
Lactation type SL featured lactations with significantly shorter IL than the average (268±63·6 vs. 302±65·4 d; P<0·0001), lower DIM and longer DP.
Influence of age
The AFL of ewes showing lactation type SL was slightly lower than the average, even though these ewes had higher average age (P<0·0001). Ewes with lactation type SN were older than the average (2·44±0·99 vs. 2·2±0·98 years) and had a shorter lambing interval for the current lactation (282±52·4 vs. 302±65 d; P<0·0001 in both cases). Lactation type LP was associated with the youngest ewes (1·91±0·89 vs. 2·2±0·98 years; P<0·0001) and with an IL larger than the average. Lactation type LVP was also associated with ewes younger than the average (2·10±0·82 vs. 2·2±0·98 years; P<0·0001) and these animals showed slightly higher AFL (438±76·2 vs. 432±77·4 d; P<0·0001).
Relationship between lactation number (L1 to L5) and lactation type
Analysis of lactation number showed that type SL occurred significantly more often among lactations fourth and fifth (P<0·0001). Lactation type SN occurred significantly more often among lactations third, fourth and fifth (P<0·01). Lactation type LP occurred significantly more often in first lactations (P<0·0001), and finally, lactation type LVP occurred more often among lactations first and second (P<0·01). Similarly, the distribution of lactation types among each lactation number for L1 to L5 was significantly different between lactation numbers (P<0·0001). The higher the lactation number, the greater the proportion of lactations that fell into the less productive clusters SL and SN. In L1, more than 60% of lactations belonged to the highest-yielding types LP and LVP. In L4 and L5, 40·4 and 46·3% of lactations, respectively, fell into type SL, while more than 70 and 80% of lactations belonged to types SL and SN together.
Characterisation of lactation curves: categorical variables
Influence of month of birth, month of first lambing and month of lambing
Analysis of lactation type based on categorical variables showed that type SL occurred significantly more often among ewes with an MB of December (P=0·001), an ML of November (P<0·0001) or an MC of June (P=0·01). Lactation type SN occurred significantly more often among ewes with an MB of February (P<0·0001), an ML of January or June (P<0·0001), or an MFL of April (P=0·005). Lactation type LP occurred significantly more often among ewes with an MB of September (P=0·007), an ML of December (P<0·0001), or an MFL of September (P=0·004). The most productive type, LVP, occurred significantly more often among ewes with an MB of September (P<0·0001), an ML of October or March (P=0·001), or an MFL of October (P<0·0001).
Effects of individual ewes on lactation types
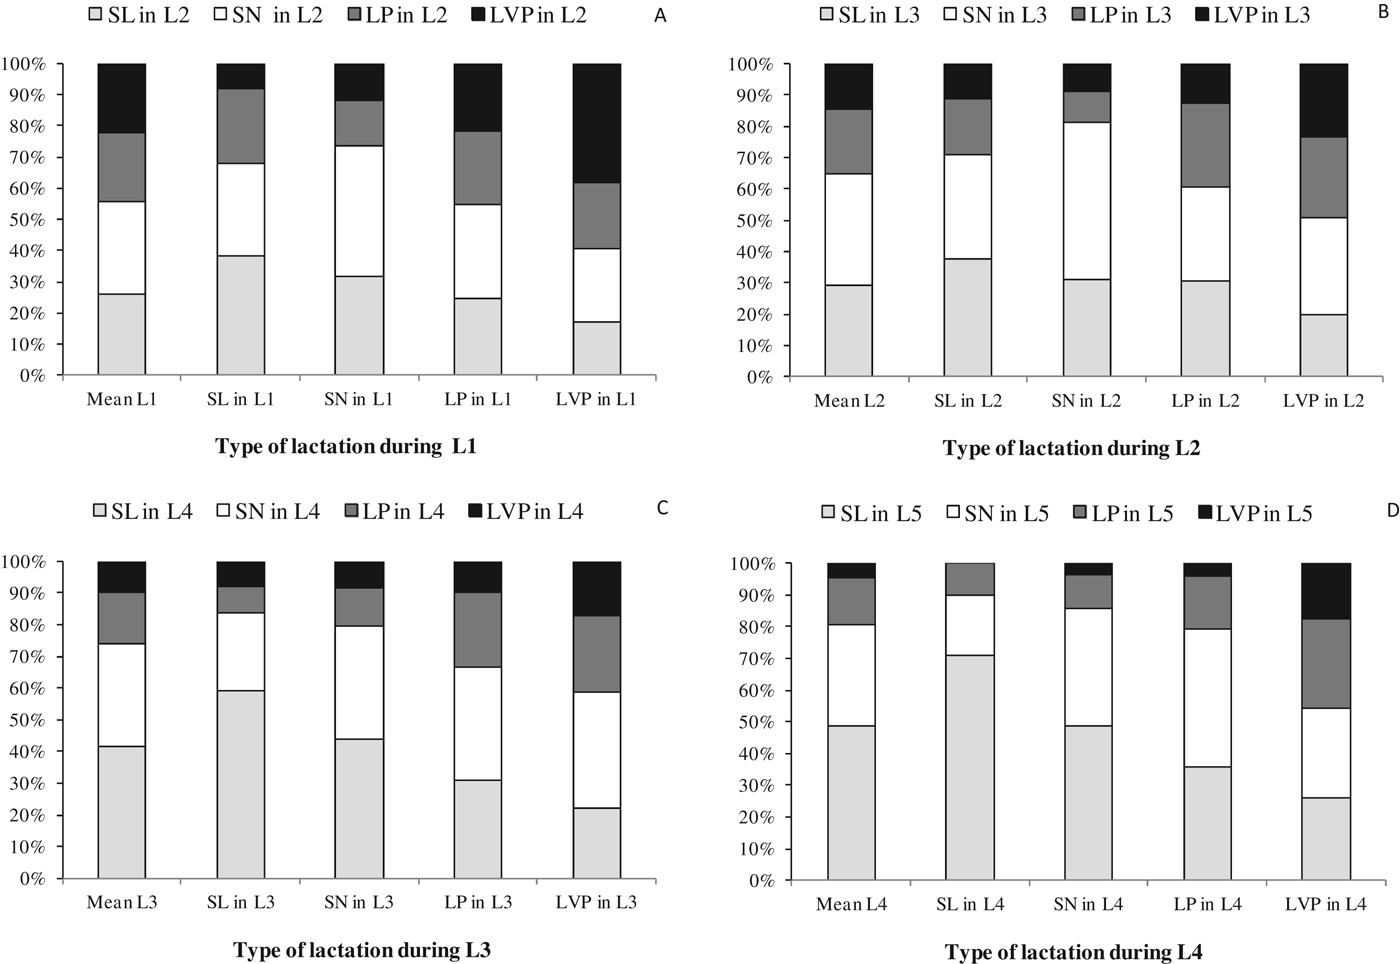
To compare lactation types for the same ewe between lactation numbers, 1534 sheep with complete L1 and L2 were analysed, 1456 with complete L2 and L3, 742 with complete L3 and L4, and 294 with complete L4 and L5. Figure 3 shows the distribution of lactation types in L1 to L5 based on the previous lactation. Within each lactation number L1–L4, the typology distribution for the previous lactation was significantly different from that of the types for the subsequent lactation (P<0·0001).
Fig. 3. Proportions of sheep showing each lactation type in each lactation number (L1 to L5), arranged based on the type in the previous lactation. Types are defined as in Fig. 2. The mean lactation (bar at far left) shows the aggregate data for each lactation number. The proportions in each lactation number were significantly different from those in the mean lactation (P<0·001).
L1 was followed by type SL in 26·0% of L2 lactations and 29·3% of L3 lactations, SN in 29·9% of L2 and 35·8% of L3, LP in 22·1% of L2 and 20·4% in L3, and LVP in 22·0% of L2 and 14·5% of L3. The frequency of high-yield types diminished with lactation number: 41·4% of L3 lactations were followed by type SL in L4, while only 10·0% of L3 lactations were followed by type LVP in L4. The corresponding percentages were 48·8 and 4·7% from L4 to L5.
More than 65% of L1 lactations belonging to type SL were followed by L2 lactations with the same type. At the other productivity extreme, L1 lactations belonging to type LVP showed the highest probability (38%) of being followed by L2 lactations with the same type. Similarly, lactations of one number with type SL or SN were most likely to be followed by another lactation with type SL or SN.
L1 lactations with type LP led to L2 lactations with type LP in 22% of cases and with type LVP in 22% of cases. For L2–L5, the probability of lactation with type SL or SN increased when the previous lactation belonged to type LP.
In fact, the frequency of the most productive lactations decreased with lactation number: 23·6% of L2 lactations with type LVP had L3 lactations with the same type, while the corresponding percentage was 17·4% going from L3 to L4, and tended to be stable from L4 onwards (17·4% going from L4 to L5).
Discussion
This clustering study identified four lactation types in Lacaune dairy sheep under intensive management. The types differed mainly in their productivity: curves SL and SN were less productive and accounted for approximately 53% of lactations; curves LP and LVP were very productive and accounted for 47% of lactations. Ewes whose lactations had the most productive types showed the following principal differences from ewes whose lactations were less productive: younger age, higher yield during the previous lactation, a shorter previous dry period, longer lambing intervals, birth during the month of September, first lambing during the months of September or October, and months of lambing during March, October or December. It can be concluded that the main factors influencing milk yield in Lacaune dairy sheep under intensive management are age (or lactation number), the individual productivity potential of the ewe, and the season/photoperiod.
The lactation curves in the present study were generated using the Pollott additive model. After generating lactation curves, the curves were analysed by cluster analysis in order to identify groups (types) with similar characteristics and identify characteristics differentiating one group from another (Bécue Bertaut & Valls i Marsal, Reference Bécue Bertaut and Valls i Marsal2011). An important advantage to cluster analysis for analysing milk production is that the entire lactation curve can be studied, instead of using multiple models to fit each curve parameter (e.g. milk yield, DIM, peak yield) individually. This approach can detect relationships between characteristics that would be invisible to other statistical methods, such as regression, ANOVA or correlation analyses (Cardenas, Reference Cardenas2009).
It was observed, that the four lactation types differed mainly in curve shape and length, with the most productive lasting the longest and showing higher yield persistency. This is consistent with previous research in cattle indicating that persistency is much more important than peak production for predicting overall flock productivity (Soelkner & Fuchs, Reference Soelkner and Fuchs1987; Capuco et al. Reference Capuco, Ellis, Hale, Long, Erdman, Zhao and Paape2003; Cole & VanRaden, Reference Cole and VanRaden2006).
Yield results
The present study found that mean milk yield declined with ewe age, confirming other studies (Hernandez et al. Reference Hernandez, Elvira, Gonzalez-Martin, Gonzalez-Bulnes and Astiz2011). Females with a mean AFL >420 d probably achieved maximal milk productivity at L1 because their udder development was complete by the time of their first lambing. These findings differ from results obtained with various sheep breeds, including Lacaune (Barillet et al. Reference Barillet, Boichard, Barbat, Astruc and Bonaiti1992), Latxa (Gabiña et al. Reference Gabiña, Arrese, Arranz and Beltran de Heredia1993) and Awassi (Gootwine & Pollott, Reference Gootwine and Pollott2000). These differences suggest the need to apply our approach to each situation individually and could be due to differences in management systems. In the present study, milk yield for lactation types LP and LVP was higher following a shorter dry period during the previous lactation, which corroborates previous results in ewes (Hernandez et al. Reference Hernandez, Elvira, Gonzalez-Martin and Astiz2012) and in dairy cattle (Natzke et al. Reference Natzke, Everett and Bray1975; Pinedo et al. Reference Pinedo, Risco and Melendez2011).
Pollott parameters help us to explain, in part, the characteristics of the different types. SL curves showed a reduced milk secretion potential from the beginning of the lactation (low MS and NO, maximal NOD), and little ability to overcome this situation (high GR, low DR). Conversely, LVP curves showed maximal secretion potential at the beginning (maximal MS and NO, minimal NOD), together with good GR and minimal DR. Research has shown that differences in mammary cell renewal strongly determine lactation persistency and productivity (Capuco et al. Reference Capuco, Ellis, Hale, Long, Erdman, Zhao and Paape2003). Less productive lactation may result from not only ewe age but also nutrition level (Pollott, Reference Pollott2000). In the present study, since all ewes received the same nutrition depending on their productivity and since no grazing was allowed, the ewes showing low-yielding lactation types probably had reduced yield capacity, and this could be hardly improved through management.
Reproductive results
The current study found that the timing of pregnancy can negatively affect the shape of the lactation curve. IL was smaller during less productive lactations (268±63·6 d) than during more productive ones (342±65·0 d). These findings support the practice on the farm of delaying conception in more productive ewes. Delaying conception was associated with higher yield not only in the current lactation but also the next one. Similarly, David et al. (Reference David, Astruc, Lagriffoul, Manfredi, Robert-Granié and Bodin2008) observed an inverse correlation between fertility of adult Lacaunae ewes and milk yield. Moreover, a longer post-partum period has been associated with greater milk production in Assaf and Awassi sheep (Eyal et al. Reference Eyal, Lawi, Folman and Morag1978; Kassem et al. Reference Kassem, Owen and Fedel1989; Gootwine & Pollott, Reference Gootwine and Pollott2000; Pollott & Gootwine, Reference Pollott and Gootwine2004).
Influence of age
The current results indicate that two important determinants of lactation type are ewe age at first lambing and ewe age at previous lambing before the current lactation. If ewes in this study were too young at first lambing, their productivity seemed to worsen. This is consistent with previous work, in which the optimal age at first lambing was 390–450 d (Hernandez et al. Reference Hernandez, Elvira, Gonzalez-Martin, Gonzalez-Bulnes and Astiz2011). However, the difference in AFL between the least productive type (SL, 428±78·7 d) and the most productive (VPL, 438±76·2 d) was only 10 d which, while statistically significant, is unlikely to make a difference in practice.
Influence of month of birth, month of first lambing and month of lambing
The present study detected a clear influence of the season of birth and lambing on milk productivity. A greater proportion of lactations were less productive for ewes born in December and February than for ewes born in September; this may reflect an association between delayed puberty and higher milk production. Ewes born in September reach puberty during the next breeding season after birth, such that their AFL falls within the ideal range of 390 to 450 d (Hernandez et al. Reference Hernandez, Elvira, Gonzalez-Martin, Gonzalez-Bulnes and Astiz2011). Previous studies have attributed the influence of birth month on milk productivity to the influence of photoperiod on maternal milk yield and on prepubertal growth (Gootwine & Pollott, Reference Gootwine and Pollott2000; Pollott & Gootwine, Reference Pollott and Gootwine2004; El-Saied et al. Reference El-Saied, de la Fuente and Primitivo2006). However, this factor is unlikely to explain the observed influence in the present study, since no lactation was allowed. Other studies have suggested that lambing month influences productive and reproductive performance of Assaf, Awassi and Churra dairy sheep, both under intensive management (Gootwine & Pollott, Reference Gootwine and Pollott2000; Pollott & Gootwine, Reference Pollott and Gootwine2004) and non-intensive management (El-Saied et al. Reference El-Saied, de la Fuente and Primitivo2006). The most productive lactations started in December, March and October, which is consistent with studies suggesting that lengthening photoperiod enhances productivity and persistency (Capuco et al. Reference Capuco, Ellis, Hale, Long, Erdman, Zhao and Paape2003; Pollott & Gootwine, Reference Pollott and Gootwine2004).
Effect of the individual ewe on the lactation curves
Most ewes tended to show lactations of the same type from one lactation number to the next (Fig. 3; P<0·0001). Given that all animals in this study belonged to the same flock subjected to uniform conditions of management, housing and nutrition, these results reinforce the importance of genetics in productivity, particularly for ewes showing extremely high or extremely low productivity. Studies in sheep have clearly demonstrated a genetic basis of milk yield potential as measured in lactation persistency and length (Jamrozik et al. Reference Jamrozik, Fatehi and Schaeffer2007; Jonas et al. Reference Jonas, Thomson, Hall, McGill, Lam and Raadsma2011).
Taken together, these results suggest that farmers can guide their decisions about which ewes they will breed and keep longer on the farm by examining the shape (type) of the first lactation. This approach promises to help farmers enhance the efficiency of their flocks.
Conclusion
These results indicate that ewe age, month at birth, month at lambing, and genetic background are the principal factors affecting milk productivity of the Lacaune breed under intensive management. Most ewes showed remarkably stable lactation curves from one lactation number to the next, suggesting that the shape (type) of the first lactation can guide decisions about which ewes to breed and which ewes to keep longer on the farm. This approach may help farmers enhance the efficiency of their flocks.
The authors thank Frank Wallner for assistance with data collection, Antonio Gonzalez-Bulnes for critical revision of the manuscript, and the farm staff for their collaboration.