Improving the suitability of milk for cheese making, and thus the efficiency of production, is of paramount importance to the cheese industry (Pretto et al. Reference Pretto, De Marchi, Penasa and Cassandro2013). Widely use indicators of milk suitability for cheese making are Milk Coagulation Properties (MCP) (Pretto et al. Reference Pretto, De Marchi, Penasa and Cassandro2013) which have a determinant effect on the cheese making process and the yield of cheese (O'Callaghan et al. Reference O'Callaghan, O'Donnell and Payne2000). MCP are mainly defined as Rennet Coagulation Time (RCT), Curd Firmness (CF) while the rate of development of the coagulum is also a useful additional indicator (Curd Firmness Rate: CFR) (Frederiksen et al. Reference Frederiksen, Hammershøj, Bakman, Andersen, Andersen, Qvist and Larsen2011b). Milk that exhibits a short RCT and a high CF and CFR has commonly been linked to higher cheese making suitability, however the optimal MCP will be dependent on the cheese varieties and cheese making production methods (Pretto et al. Reference Pretto, De Marchi, Penasa and Cassandro2013).
Studies on the effect of milk composition on MCP have typically focused on casein and protein content as they form the basis of the gel matrix and are associated with positive MCP traits (Ekstrand et al. Reference Ekstrand, Larsson-Raźnikiewicz and Perlmann1980). A high level of titratable acidity and calcium ions and a low pH and somatic cell count have also been shown to improve MCP (Pretto et al. Reference Pretto, De Marchi, Penasa and Cassandro2013). The effect of fat content has been subject to less research due to the common practice of standardisation of fat content by cheese makers however the findings of these limited studies were contradictory. On one hand fat globules were found to weaken the coagulum structure thus reducing CF (Guinee et al. Reference Guinee, Gorry, Callaghan, Brendan, Kennedy, Brien and Fenelon1997). Alternatively fat was found to restrict the movement of gel strands and thus increase rigidity and CF (Chapman, Reference Chapman1974). These contradictory findings could be due to differences in study design and whether the level of protein was kept constant and so diluted by the increase in fat content, or alternatively whether the protein to fat ratio was kept constant (Guinee et al. Reference Guinee, Mulholland, Kelly and Callaghan2007). This problem is seen in many studies where the effect of a single variable or small group of compositional variable was being examined and changes in other variable were not accounted for. For example, O'Mahony et al. (Reference O'Mahony, Auty and McSweeney2005) reported that larger fat globules were associated with increased RCT and lowered CF, but warned that varying protein levels could have affected the results. The precise relationship between milk composition and cheese making properties is thus still unclear due to the number of compositional variables which could impact MCP, and their interrelationships, which makes it difficult to determine which factors are causal and which are secondary to other relationships (Storry et al. Reference Storry, Grandison, Millard, Owen and Ford1983; Coulon et al. Reference Coulon, Delacroix-Buchet, Martin and Pirisi2004; Macciotta et al. Reference Macciotta, Cecchinato, Mele and Bittante2012). This has been seen particularly when standard regression or ANOVA techniques were used as they are not appropriate for elucidating the relationship between large numbers of collinear variables (Ikonen et al. Reference Ikonen, Morri, Tyrisevä, Ruottinen and Ojala2004; Vallas et al. Reference Vallas, Bovenhuis, Kaart, Pärna, Kiiman and Pärna2010). Hence, other, more sophisticated statistical techniques such as Principal Component Analysis (Auldist et al. Reference Auldist, Johnston, White, Fitzsimons and Boland2004), Multivariate Factor Analysis (Macciotta et al. Reference Macciotta, Cecchinato, Mele and Bittante2012), Survival Analysis (Cecchinato, Reference Cecchinato2013) and Partial Least Squares (PLS) (Lawlor et al. Reference Lawlor, Delahunty, Wilkinson and Sheehan2001; De Marchi et al. Reference De Marchi, Fagan, O'Donnell, Cecchinato, Dal Zotto, Cassandro, Penasa and Bittante2009) have been employed recently. In the present study, PLS regression was used as it can analyse data with strong colinearities and with numerous predictors against fewer observations. In addition, PLS forms new variables, termed ‘Latent Variables (LV)’, which reduces the dimensionality of the data, making it easier to interpret and reduce over fitting compared with generalised linear models (Wold & Sjostrom, Reference Wold and Sjostrom2001).
The present study builds on previous studies by evaluating the effect of a larger number of milk compositional variables than previously carried out, on RCT, CF and CFR using PLS. Holstein-Friesian (H-F) and Jersey (J) milk was used as they display significantly different milk composition and MCP (Storry et al. Reference Storry, Grandison, Millard, Owen and Ford1983; Czerniewicz et al. Reference Czerniewicz, Kielczewska and Kruk2006; Kielczewska et al. Reference Kielczewska, Czerniewicz and Kruk2008) which will facilitate the modelling. The study objectives were to determine whether using a wider range of compositional variables would improve the modelling of MCP and deepen the understanding of the effect of milk composition on RCT, CF and CFR. This could help improve predictive functions of MCP such as those used for predictions of the cutting time in automated or semi-automated systems of cheese production (Fagan et al. Reference Fagan, Castillo, Payne, O'Donnell, Leedy and O'Callaghan2007; Sundekilde et al. Reference Sundekilde, Frederiksen, Clausen, Larsen and Bertram2011) by using additional variables which have been shown to have important influence. In addition, a better understanding of which milk components improve MCP could guide cheese makers on selecting milk with higher suitability for cheese making
Materials and methods
Experimental design and milk composition
The experiment was carried out 5 times over a 12 month period spaced at regular intervals through the seasons. Milk samples from J and H-F herds were used at different ratios (0–100% at 10% intervals). Thus, 11 samples were analysed on each of the 5 sampling dates, giving a total of 55 observations.
The milk obtained from the University herd of H-F cows (CEDAR, Reading, UK) and two J farms (Brackley and Slough, UK on alternate repeats) was composed of the refrigerated bulked evening and morning milking and transported to the laboratory and stored at 4 °C. Analysis for fat, protein, lactose, casein, urea content and Somatic Cell Count (SCC) were performed by the National Milk Laboratory (Glasgow, UK) using infrared milk analyser (Combifoss 6000, FossEletric, Hillerød, Denmark). The ratio of protein to fat (P/F) and casein to protein (C/P) were calculated from that data. Size of casein micelles (CMS) was determined using a Zetasizer 500 (Malvern Instruments Ltd, Worcestershire, UK) and size of fat globules: mean volume D(4·3), mean surface area D(3·2), average size D(0·5) and size fat globule span using a Mastersizer S 2000 (Malvern Instruments Ltd, Worcestershire, UK) respectively. Calcium ion concentration (Ca2+) was determined using a Ciba Corning 634 ISE Ca2+/pH Analyzer (Bayer Ltd, Newbury, UK) at room temperature (20±1 °C) using the method of Lin (Reference Lin2002). Milk pH was measured using a FE20 desktop pH meter (Mettler-Toledo Ltd., Leicester, UK) and titratable acidity was measured using an acid-base titration with a Titralab automatic titrator (Radiometer Analytical, Villeurbanne, FR) titrated with 0·1 M NaOH to pH 8·70 and expressed as Dornic acid (°D). All analyses were performed within 24 h of collection.
Milk coagulation properties
Coagulation properties were measured using a C-VOR controlled stress rheometer (Bohlin Instruments Ltd., Gloucestershire, UK) following an oscillation method using a measuring system consisting of a bob and cup (C25DIN53019). The frequency and strain were kept constant throughout the test at 0·5 Hz and 2·5% (Guinee et al. Reference Guinee, Gorry, Callaghan, Brendan, Kennedy, Brien and Fenelon1997), respectively. Measurements were taken every 14 s. All samples were analysed in triplicate and randomised order in the 40 h following collection. On the day of measurement, the milk (which was not pasteurised or standardised) was heated over 10 min to the target coagulation temperature 33 °C. Each test was run until G′=3 Pa.
Marzyme 15 PF (210 IMCU/ml) microbial rennet (Danisco A/S, Copenhagen, DK) was added at a rate of 0·250 ml/l (after being diluted tenfold), to 50 ml of the heated milk at 33 °C at natural pH. A sample (13 ml) was then placed into the rheometer, and a layer of vegetable oil spread over the milk surface to prevent evaporation. The test was started 1 min after rennet addition allowing for 15 s mixing.
The following MCP parameters were obtained from the storage modulus: RCT the time in minutes at which the curd attained 0·5 Pa (O'Callaghan et al. Reference O'Callaghan, O'Donnell and Payne2000); CF the firmness of the curd (Pa), 10 min after RCT and CFR the increase in firmness (Pa/min) calculated from the time for the gel to firm from 0·5 Pa to 2 Pa.
Statistical analysis
Statistical analysis was carried out using PLS using statistical package XLStat (Addinsoft SARL, Anglesey, UK). The technique uses the method of least squares to fit a quadratic response surface regression where data is projected onto a small number of underlying latent variables and was based on the method of Wold & Sjostrom (Reference Wold and Sjostrom2001). All data were standardised (auto-scaled, centered μ=0 and normalised: 1/sd). The CFR results were non-linear and thus were expressed as log10. Each model was pruned; milk composition variables with the smallest coefficient were removed one by one and the model recalculated. Outliers were also removed when high dModY (distance to Y response model) values were found. The model was confirmed using full cross and random cross-validation with 9 segments and between 6 or 7 samples per segment. All prediction residuals were then combined to compute the Root Mean Squares Error of Cross-Validation (RMSECV). Several criteria were used to determine the proficiency of the predictive models: lowest RMSECV value, greatest R 2 and Q 2 value and lowest component as done by De Marchi et al. (Reference De Marchi, Fagan, O'Donnell, Cecchinato, Dal Zotto, Cassandro, Penasa and Bittante2009).
The practical utility of the models was assessed using the Range Error Ratio (RER). Values for this ratio were calculated by dividing the range of a parameter by the RMSECV for that parameter (Hubert & Vanden Branden, Reference Hubert and Vanden Branden2003). Models with RER<3 are of little practical utility, 3–10 indicate good practical utility and >10 high utility value (Hubert & Vanden Branden, Reference Hubert and Vanden Branden2003). A model with Q 2 lower than 0·66 was assumed to have no predictive ability, between 0·66 to 0·82 approximate predictions, between 0·82 and 0·90 good prediction and higher than 0·90 excellent prediction (Hubert & Vanden Branden, Reference Hubert and Vanden Branden2003). The standardised coefficients for each model were compared using T-test.
Results and discussion
Descriptive statistics
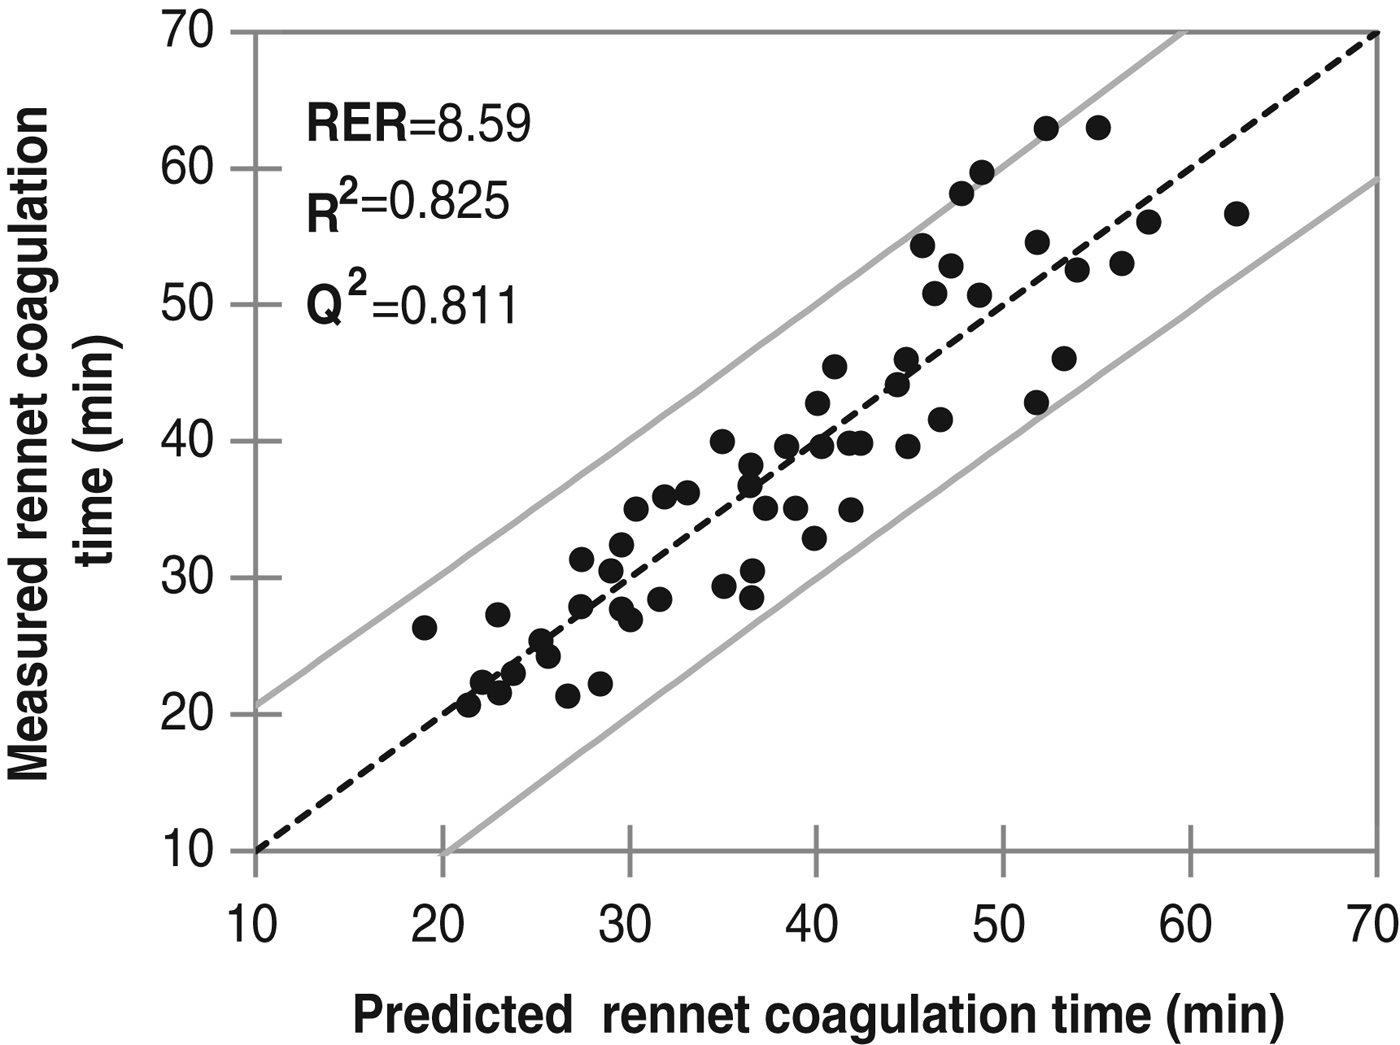
Milk composition and MCP variables mean and range are reported in Table 1. The milk composition is representative of average national milk (Centre for Dairy Information, 2010) with an increased range due to the use of J and H-F. The values for RCT, CF and CFR could not be compared with past findings due to the heavy influences of method of analysis and operational setup. The variability in RCT (Coefficient of Variation CV=30%), CF (CV=62%) and CFR (CV=50%) values facilitated the development of the model.
Table 1. Mean and range of milk composition studied (N=55)

Rennet coagulation time model
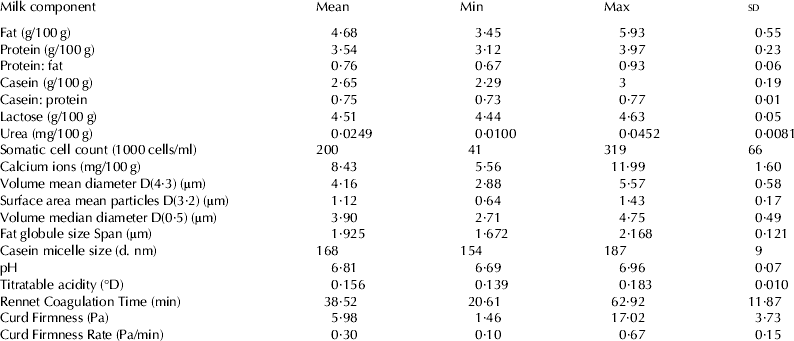
The most accurate model for RCT (R 2=0·825; Q 2=0·811; N=55) had 1 component, a RMSECV of 4·93 min and RER of 8·59. The model had higher R 2, Q 2 and RER than found in other studies (Auldist et al. Reference Auldist, Johnston, White, Fitzsimons and Boland2004; Wedholm et al. Reference Wedholm, Larsen, Lindmark-Månsson, Karlsson and Andrén2006; De Marchi et al. Reference De Marchi, Fagan, O'Donnell, Cecchinato, Dal Zotto, Cassandro, Penasa and Bittante2009). The model thus demonstrates that using a larger array of compositional variable improve the prediction of RCT. However, the current model RMSECV would be too high to be used commercially (Fig. 1).
Fig. 1. Measured vs. predicted rennet coagulation time using a PLS model (n=55).
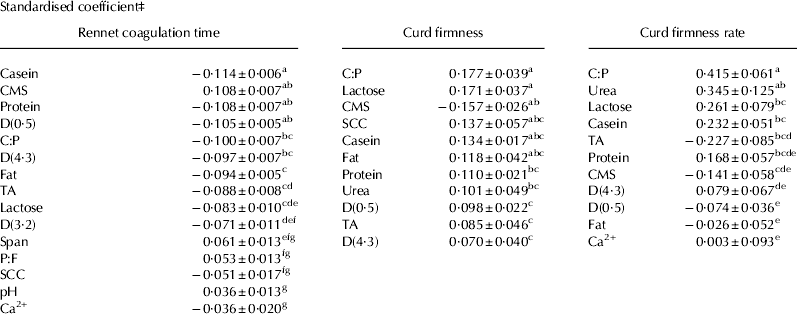
All compositional variables, except urea concentration, were found to have a significant effect on RCT and their standardised coefficients are shown in Table 2.
Table 2. Standardised coefficients and standardised deviation for rennet coagulation time, curd firmness and curd firmness rate†
† All variables included are significant at P<0·05
‡ Numbers in a row with different superscript are significantly different at P<0·05
CMS, Casein micelles size; SCC, Somatic cell count; TA, Titratable acidity; Span, Span of fat globule; C:P, casein to protein ratio; P:F, protein to fat ratio
As expected from past research and the kinetics of milk coagulation, casein, casein and protein ratio and protein were the key drivers of RCT (Chiofalo et al. Reference Chiofalo, Maldonato, Martin, Dupont and Coulon2000; Marchini et al. Reference Marchini, Malacarne, Franceschi, Formaggioni, Summer and Mariani2010). However, CMS and D(0·5) were shown to be equally important in determining RCT. The negative relationship between CMS and RCT is in agreement with larger CMS having lower amount of κ-casein and thus forming a gel more slowly (Grimley et al. Reference Grimley, Grandison and Lewis2009; Marchini et al. Reference Marchini, Malacarne, Franceschi, Formaggioni, Summer and Mariani2010). On the contrary the positive effect of D(0·5), but also fat content, D(4·3) and D(3·2), is in disagreement with the common assumption of the fat globule hindering the process of coagulation. Nevertheless, the findings of O'Mahony et al. (Reference O'Mahony, Auty and McSweeney2005), Martini et al. (Reference Martini, Scolozzi, Cecchi, Mele and Salari2008) and Grimley et al. (Reference Grimley, Grandison and Lewis2009) were in agreement with the current findings, indicating that the effect of fat on MCP warrants further investigation. The important effect of CMS and D(0·5) could explain why casein and protein level are not always good predictors of RCT as was found by Frederiksen et al. (Reference Frederiksen, Andersen, Hammershøj, Poulsen, Sørensen, Bakman, Qvist and Larsen2011a) where a J milk with lower casein content and casein to protein ratio had a shorter RCT than a H-F milk with a higher casein and casein to protein ratio. The effect of protein to fat ratio, SCC, pH and Ca2+ on RCT was small and would, in this case, not be a good indicator of RCT. This model suggests that a higher SCC reduces RCT which contradict past research (Politis & Ng-Kwai-Hang, Reference Politis and Ng-Kwai-Hang1988). However, the range examined in this study was much smaller and did not correspond to udder health problems as compared with the latter study. Modifying Ca2+ concentrations or pH level is widely used to improve RCT, however, a weak correlation of Ca2+ and pH with RCT was found, in agreement with Grimley et al. (Reference Grimley, Grandison and Lewis2009) and Nian et al. (Reference Nian, Chen, Aikman, Grandison and Lewis2012). Titratable acidity had a stronger correlation with RCT than pH, which was also found in the study of Formaggioni et al. (Reference Formaggioni, Malacarne, Summer, Fossa and Mariani2001), and presumably relates to the fact that titratable acidity measurement incorporates the buffering capacity of the milk. This suggests a switch from using pH to titratable acidity as an indicator of milk suitability for cheese making. Lactose was linked negatively to RCT which was also reported by Amenu & Deeth (Reference Amenu and Deeth2007) and Glantz et al. (Reference Glantz, Devold, Vegarud, Lindmark, ånsson, Stålhammar and Paulsson2010) without explanation of the mechanism.
Curd firmness model
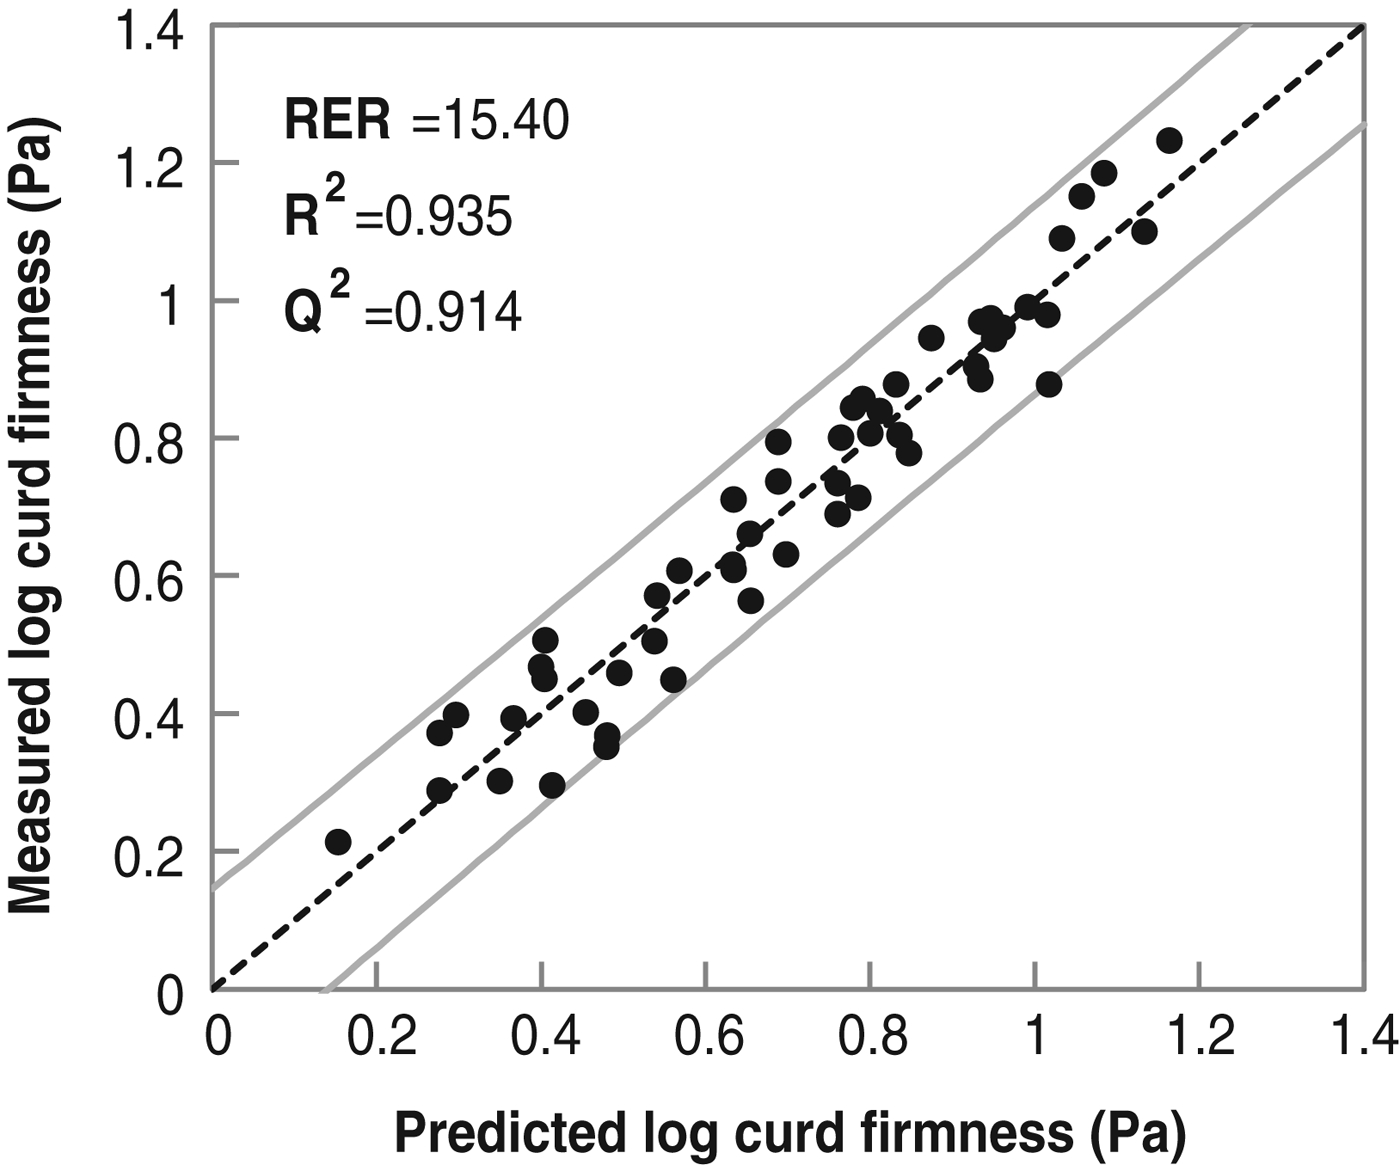
The preferred model for log CF (R 2=0·935; Q 2=0·914; N=52) had 2 components, a RMSECV of 0·066 Pa and RER of 15·40 and which, as for RCT, give a good prediction of the current data (Fig. 2). Protein to fat ratio, D(3·2), span, pH and Ca2+ did not influence CF. Protein to fat ratio was already found not to influence curd firmness in the study of Guinee et al. (Reference Guinee, Mulholland, Kelly and Callaghan2007).
Fig. 2. Measured vs. predicted log curd firmness using a PLS model (n=52).
The standardised coefficients for log CF are presented in Table 2 and represent the importance of each compositional factor for the models.
The casein and protein ratio and casein content had the expected major influence on log CF in agreement with Chiofalo et al. (Reference Chiofalo, Maldonato, Martin, Dupont and Coulon2000) and Storry et al. (Reference Storry, Grandison, Millard, Owen and Ford1983). However, lactose, CMS, somatic cell count and fat were found to be equally important to CF development. The strong effect of lactose content was unexpected, although it has been noted previously, and the mechanism is unclear (Grandison et al. Reference Grandison, Ford, Owen and Millard1984; Amenu & Deeth Reference Amenu and Deeth2007; Glantz et al. Reference Glantz, Devold, Vegarud, Lindmark, ånsson, Stålhammar and Paulsson2010). The positive effect of small CMS, somatic cell count and fat was again shown in the CF model in agreement with Grimley et al. (Reference Grimley, Grandison and Lewis2009) and Marchini et al. (Reference Marchini, Malacarne, Franceschi, Formaggioni, Summer and Mariani2010) for CMS and Martini et al. (Reference Martini, Scolozzi, Cecchi, Mele and Salari2008) for fat. However in contrast to RCT, the fat content had a stronger effect than D(0·5) and D(4·3) which had a secondary effect on Log CF.
Protein, urea and titratable acidity were also secondary contributors to the determination of CF. Urea concentration was positively correlated with log CF in agreement with the findings of Marziali & Ng-Kwai-Hang (Reference Marziali and Ng-Kwai-Hang1986) but it did not influence CF as much as protein.
Curd firmness rate model
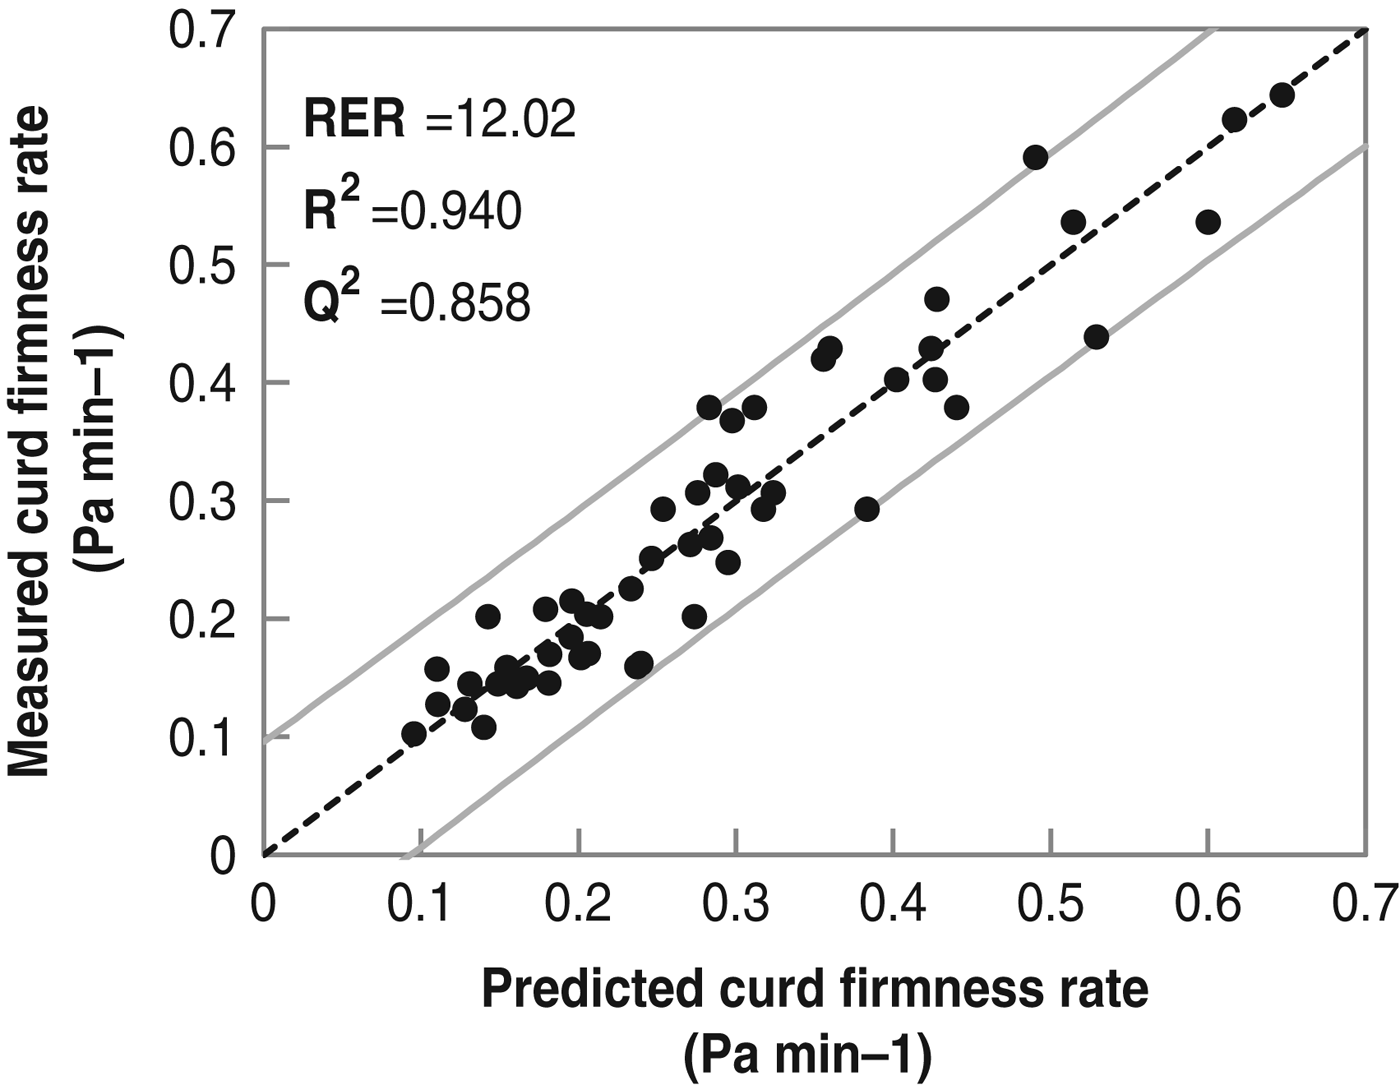
The most proficient model for CFR model (R 2=0·940; Q 2=0·858; N=51) had 3 components, a RMSECV of 0·045 Pa/min and RER of 12·02. Again, the model showed that using a large array of compositional value increased the fit and predictive abilities of the model (Fig. 3). The factors excluded from the model due to non-significant effect were protein to fat ratio, D(3·2), span of fat globule, pH and SCC, demonstrating that these parameters should not be used for the prediction of MCP having a small impact on RCT and no effect on CF and CFR.
Fig. 3. Measured vs. predicted curd firmness rate using a PLS model (n=51).
Figure 3 indicates a better predictive power at low CFR which was also seen for CF (Fig. 2), this could be linked to high CFR and CF being related to J milk which displayed stronger variation in milk composition than H-F (results not shown).
Standardised coefficients for the predictive equation of CFR are presented in Table 2. Casein to protein, urea concentration, lactose, casein and titratable acidity were the most important factors governing CFR. The importance of casein to protein ratio, protein and casein was again expected (Storry et al. Reference Storry, Grandison, Millard, Owen and Ford1983; Frederiksen et al. Reference Frederiksen, Hammershøj, Bakman, Andersen, Andersen, Qvist and Larsen2011b). The strong positive effect of urea concentration on CFR was however not expected and is in conflict with the study of Martin et al. (Reference Martin, Coulon, Chamba and Bugaud1997) which found a negative effect and the study of Marziali & Ng-Kwai-Hang (Reference Marziali and Ng-Kwai-Hang1986) which found no effect. Similarly lactose was again found to have a larger impact than expected. Again, the mechanisms behind the effect of urea and lactose on CFR are not understood and more research on their effect is needed. Fat content and D(0·5) had a small negative effect on CFR which is consistent with bigger and more numerous fat globules hindering the development of the matrix (Chiofalo et al. Reference Chiofalo, Maldonato, Martin, Dupont and Coulon2000). Again, D(4·3) was found to have a positive effect and more research is needed to understand the difference between the effect of D(0·5) representing the average size and D(4·3) representing the volume of the fat globule.
In addition a negative relationship between titratable acidity and CFR was found in accordance with Macciotta et al. (Reference Macciotta, Cecchinato, Mele and Bittante2012).There was a negative influence of CMS on CFR although to a lower extent than for RCT and CF.
Conclusions
The importance of considering a number of compositional variables was demonstrated through the modelling of the MCP. The models obtained in this study had greater predictive power than those previously developed, and having R 2>0·825 and Q 2>0·811 would indicate that most variation in MCP could be explained by the milk components examined. Moreover, the findings challenge the standard understanding of the milk casein and protein fractions being the main factors responsible for MCP. While they are clearly determinants, other factors were shown to play a key role such as CMS and fat globule sizes. In addition, this study indicates a strong influence of urea and lactose on MCP, although the mechanisms are not yet understood. Some established indicators of MCP such as protein to fat ratio, pH and Ca2+, were also shown not be very significant due to their relatively small influence. This knowledge could assist both the cheese industry to select milk with better MCP and the associations involved in animal selection to improve milk suitability. However, future research is needed if those models were to be used commercially by using a higher number of samples and using different breeds. In addition faster and cheaper methods of milk analysis should be developed if certain milk compositional variables were to be analysed routinely.
Funding for this research was provided by UK Jersey, the Dartington Cattle Breeding Trust, the Royal Bath and West of England Society, West Country Dairy Award and the Pocock Memorial trust.