Milk production responses to increased fat intake are often positive. Østergaard et al. (Reference Østergaard, Danfær, Daugaard, Hindhede and Thysen1981) observed that milk production responses to fat supplementation were greater in early lactation compared with responses later in the lactation (0·92 kg energy corrected milk (ECM) per day in early lactation and 0·56 kg ECM/d in later lactation (week 11–27) per 10 g fatty acid (FA) per kg dry matter (DM). Chilliard (Reference Chilliard1993) concluded from a literature review that responses generally were lower and contrary to the findings of Østergaard et al. (Reference Østergaard, Danfær, Daugaard, Hindhede and Thysen1981) the greatest responses were observed in late lactation. In a meta analysis by Onetti & Grummer (Reference Onetti and Grummer2004) fat supplementation increased milk production in early lactation, but not in mid lactation due to milk fat depression. Further, Onetti & Grummer (Reference Onetti and Grummer2004) found interactions between forage type and fat supplementation, with positive milk production response to fat supplementation when alfalfa made up at least half of the forage, but no response when corn silage was the main forage. This could be due to less hydrogenation of unsaturated FA in corn silage diets with low physical structure value (Harfoot & Hazlewood, Reference Harfoot, Hazlewood and Hobson1988). Hydrogenation of unsaturated FA in the rumen is excessive (Weisbjerg et al. Reference Weisbjerg, Børsting and Hvelplund1992a), and with higher hydrogenation activity negative effects of unsaturated FA on rumen fermentation are reduced. Different fat sources can differ considerably in milk production response, due to different effects on rumen fermentation (Doreau & Chilliard, Reference Doreau and Chilliard1997), caused by differences in FA chain length and saturation, where especially medium chain (C10–C14) and unsaturated FA reduce rumen cellulolytic activity (Weisbjerg & Børsting, Reference Weisbjerg and Børsting1989). On the other hand, FA are nonfermentable and therefore do not reduce rumen pH.
Also intestinal FA digestibility can vary depending on dietary FA level and composition (Weisbjerg et al. Reference Weisbjerg, Hvelplund and Børsting1992b), and thereby affects energy value.
In Danish recommendations (Strudsholm et al. Reference Strudsholm, Aaes, Madsen, Kristensen, Andersen, Hvelplund and Østergaard1999) ECM responses to increased FA supplementation are assumed to be proportional to the milk yield. However, the literature is inconclusive on this question, and in NRC (2001) it was concluded that milk-yield responses to supplemental fat in high producing cows are not well defined. The aim of the present study was to test the hypothesis that milk production response to supplemental dietary fat is proportional to cow's production level and to investigate the effects of supplemental dietary fat on milk production and milk quality variables.
Materials and methods
Cows, design, feeds, and treatments
The experiment compiled with the guidelines of the Danish Ministry of Justice (Act no 726, 1993) with respect to animal experimentation and care of animals under study.
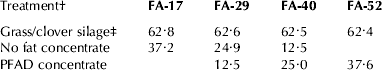
Sixteen Danish Holstein cows were split into two groups of eight cows according to their production level (high vs. medium milk yield) at the start of the experiment, where cows were fed the same standard ration. Both groups of eight cows were further divided into two groups on the basis of parity (2nd and 3rd parity), resulting in four 4×4 Latin squares. Each 4×4 square used four animals. Within square, animals were given one of the four treatments in each of the four periods. The periods lasted three weeks, i.e. a 12-week experiment. Production level was confounded with DIM (DIM; high yielding cows 74 (48–99); medium yielding cows 158 (53–208) at onset of the experiment). The four treatments differed by the dietary FA level: unsupplemented (17 g FA/kg ration DM) and three treatments with partial substitutions of barley with Palm Fatty Acid Distillate (PFAD) fat resulting in 29, 40 and 52 g FA/kg DM, respectively. FA concentration in ration DM is hereafter referred to as FAration and individual treatments as FA-17, FA-29, FA-40 and FA-52, respectively.
Rations were fed as total mixed rations (TMR) based on grass/clover silage and two concentrates with the same composition except for substitution of barley with PFAD on weight basis, and substitution of soybean meal with Soypass (rumen protected soybean meal) to account for the reduction in metabolizable protein when barley is substituted with PFAD. Composition of concentrates is given in Table 1. Increased FAration was obtained by substituting no-fat concentrate by increasing amounts of PFAD concentrate in the TMR, as shown in Table 2. Cows had free access to water.
Table 1. Composition of concentrates (kg/100 kg)

† Rumen protected soybean meal (Raiffeisen Hauptgenossenschaft Nord AG, Germany)
‡ Palm Fatty Acid Distillate (palm oil product), Scanfedt A/S, Århus, Denmark
Table 2. Composition of TMR for the four treatments (% of DM)

‡ FA-17, FA-29, FA-40 and FA-52 refer to 17, 29, 40 and 52 g FA/kg ration DM, respectively
† Botanical composition 82·9% grass and 17·1% clover, % of DM
Chemical composition of feeds
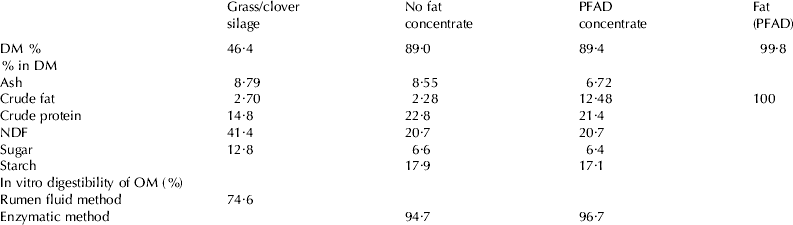
Chemical composition of grass/clover silage, concentrates and PFAD fat is given in Table 3, and fat and FA composition of feeds are given in Table 4. Grass silage FA were mainly linolenic, palmitic and linoleic acid. No-fat concentrate FA were mainly linoleic, palmitic, and oleic acid. Concentrate added PFAD contained mainly palmitic, oleic, and linoleic acid, similar to the PFAD fat.
Table 3. Chemical composition of feedstuffs
Tabel 4. Fat and fatty acid composition of ingredients in TMR and of PFAD

† Fatty acids below 0·25% of total FA (C8:0, C10:0, C13:0, C14:1, C15:0, C17:1, C20:3ω6, C20:4, C20:3ω3, C20:5, C22:1ω11, C22:1ω9, C22:5ω6, C22:5ω3, C22:6ω3, C24:1)
Management, sampling and recordings
Cows were fed equally sized portions at 08·15 and 14·00. The amount was adjusted daily to ensure minimum 5% orts. Feed offered and orts were recorded daily.
Cows were milked at 04·50 and 16·00. Milk yield and concentration of fat, protein, lactose, and citrate were recorded the three last days of each period. Milk yield was recorded and milk samples obtained using Tru Tester (Tru Test Distributors Ltd., Auckland, New Zealand). Milk samples for analysis of milk fat globule (MFG) diameter, milk free fatty acids (FFA), and milk FA were obtained from the morning milking on the last day of each period.
Cows were weighed and scored for body condition at 13·00 at onset of the experiment and on the second last day in each period. Body condition score (BCS) was recorded using a scale from 1 (thin) to 5 (fat).
Feed samples (silage and concentrates) were collected weekly and composited in samples covering the first half and the second half of the experiment, respectively.
Milk analysis
Milk samples were analysed for fat, protein, lactose (monohydrate), and citrate using a MilkoScan 4000 instrument (Foss Electric A/S, Hillerød, Danmark).
Particle size distribution of MFG was determined by laser light scattering using a Mastersizer 2000 (Malvern Instruments Ltd., Malvern, UK) as previously described by Wiking et al. (Reference Wiking, Björck and Nielsen2003). The volume-weighted diameter, d(4,3) (μm), was calculated by the integrated software.
Milk FFA were analysed using the B.D.I. method (International Dairy Federation, 1991). The milk was stored for 24 h at 4°C before determination of FFA. FFA were analysed on composite samples within treatment and within period (n=16).
Milk FA composition was determined by gas chromatography (GC) after methylation of the lipids. The GC used a FFAP-column (terephtalic acid modified polyethylene glycol 25m×200 μm×0·30 μm) with helium as carrier and a flame ionization detector as described in detail by Wiking et al. (Reference Wiking, Björck and Nielsen2003). One sample was lost and data on milk FA are based on 63 observations.
Feed Analysis
Concentrate DM was determined after drying in a forced air oven for 20 h at 103°C, and silage DM after drying at 80°C. Samples for chemical analyses were ground through a 1·0 mm screen. Ash was determined by combustion at 525°C for 6 h. Total N content was determined according to the Dumas principle (Hansen, Reference Hansen1989). Ash free neutral detergent fibre (NDF) was analysed using a Fibertec according to Mertens (Reference Mertens2002). Starch was determined as described by Åman & Hesselman (Reference Åman and Hesselman1984). Crude fat was determined using a Soxhlet-apparatus with petroleum ether extraction after 3 m-HCl hydrolysis (Stoldt, Reference Stoldt1952). Feed FA were analysed using gas chromatography on the extracted crude fat (Knarreborg et al. Reference Knarreborg, Lauritsen, Engberg and Jensen2004), except for PFAD which was extracted using Bligh & Dyer extraction according to Knarreborg et al. (Reference Knarreborg, Lauritsen, Engberg and Jensen2004). In vitro digestibility of forage organic matter (OM) was determined using the two step rumen fluid method described by Tilley & Terry (Reference Tilley and Terry1963). In vitro enzyme digestibility of concentrate OM was determined according to Weisbjerg & Hvelplund (Reference Weisbjerg and Hvelplund1993). Sugar was analysed as reducing sugars according to Jacobsen (Reference Jacobsen1981).
Calculations
Feed intake calculations were based on registrations from the seven last days in each period, and milk production on registrations the last three days in each period. Net energy intake based on chemical composition and in vitro OM digestibility is reported as feed unit cattle (FU), where one FU equals 7·89 MJ net energy (Weisbjerg & Hvelplund, Reference Weisbjerg and Hvelplund1993).
Energy corrected milk was calculated as: ECM (kg)=0·01M+12·2F+7·7P+5·0339L, where M is milk yield in kg and F, P, and L are fat, protein, and lactose (monohydrate) in kg, respectively (Sjaunja et al. Reference Sjaunja, Baevre, Junkkarinen, Pedersen and Setala1990).
Data were analysed using PROC GLM for analysis of variance and using PROC MIXED for random regression (SAS, 2001). Test for general linear effect and correlation between individual cow level (intercept) and response to FA supplementation (regression coefficient) were analysed by likelihood ratio tests using random regression in PROC MIXED with a model with period and cow as class variables and FAration as regression variable. Calculations were performed with a model assuming no correlation (type=VC) and a model assuming correlation (type=UN). Difference in -2 log likelihood between the two models was assumed χ2 distributed with one degree of freedom (=difference in estimated parameters in the two models), and ranges for P-values were obtained from statistical tables.
Error bars in figures are based on standard error of LSMEANS from a GLM model by production level and with FAration, block, and period as class variables.
Linear and quadratic effects and interactions between FAration and production level were tested by orthogonal contrasts in a model including FAration, production level, block, and period analysed with PROC GLM (data given in Figures).
Results and discussion
Feed intake
Feed intake responses to increased FAration are shown in Fig. 1. DM intake decreased (P=0·001) from 24·6 to 22·8 and from 22·9 to 21·7 kg/d for high and medium yielding cows, respectively, as FAration increased from 17 to 52 g/kg DM (Fig. 1a). However, as ration energy concentration increased with increased FAration, net energy intake was not affected by treatments (Fig. 1b). The general linear effect on DM intake with increasing FAration was −0·42 kg/d per 10 g FA/kg DM, and the response to increased FAration was not affected by cows actual feed intake level (Table 5). Total FA intake increased from 0·412 to 1·154 kg/d with increasing dietary FA level.

Fig. 1. Effect of FA intake on DM (a) and net energy (FU) (b) intake for the high and medium yielding cows. Significant linear effect for DM intake (P=0·001). Linear effect for FU, quadratic effects, and interactions between linear and quadratic FAration and production level for both dry matter and FU intake were non significant.
Table 5. Linear effects of increased dietary FA concentration on milk yield and composition, and test for correlation between individual cow parameter level (intercept) and response on FA concentration (regression coefficient) analysed by random regression

† Likelihood ratio test
‡ Increase when FA is increased with 10 g/kg DM (1% of DM)
§ Non significant
The negative response in DM intake with increasing FAration was greater than reported in a literature review by Chilliard (Reference Chilliard1993) who found DM intake to decrease by 0·20 kg when crude fat in feed DM was increased with 10 g/kg. The response to increased FA compared with increased crude fat should be 5–15% higher, as FA proportions of supplemental fat normally vary from 0·85–0·95. However, this can only explain part of the greater decrease in DM intake observed in the present study. In the experiments reviewed by Chilliard (Reference Chilliard1993) increased fat intake reduced DM intake less in very early lactation compared with later in lactation. In a meta analysis Onetti & Grummer (Reference Onetti and Grummer2004) concluded that cows in mid lactation reduced feed intake more than cows in early lactation when the level of dietary fat increased. In the present experiment high yielding cows (early lactation) numerically decreased DM intake slightly more than medium yielding cows (later lactation). However, the effect was far from significant (Figure 1, Table 5).
Cows weight and body condition
The cows gained weight during the experiment; average live weight (LW) was 620±15, 634±16, 641±18, 654±18 and 659±20 kg, and BCS was 2·7±0·2, 2·7±0·2, 2·9±0·2, 2·9±0·2 and 3·0±0·2 at experimental onset and at the end of period 1, 2, 3 and 4, respectively. Medium yielding cows increased LW with 53±9 kg and BSC with 0·5±0·1, whereas high yielding cows LW only increased with 25±6 kg and BSC with 0·1±0·1 during the experiment.
Milk yield
Milk (P=0·002) and ECM (P=0·004) yield responded positively to increased FAration (Fig. 2a,b). It was expected that ECM response on FAration was almost proportional to actual milk production, but the opposite was found. The response in ECM to the increase in dietary FA from 17 to 52 g FA/kg feed DM was 16% for the medium yielding cows, and only 8% for the high yielding cows. In absolute amounts, the response to increased FAration was almost similar for the medium and the high yielding cows, although numerically slightly higher for the medium yielding cows, as response seemed to be moderate on the higher FAration levels for the high yielding cows. However, interaction between FAration and production level was not significant. The response in ECM analysed on individual cow basis was negatively correlated to cows' production level. The general linear response was 1·1 kg ECM per 10 g/kg DM increase in FAration (Table 5). The milk production response was high compared to literature values, especially for the medium yielding cows. Onetti & Grummer (Reference Onetti and Grummer2004) found milk production to increase with 1·40 kg/d in early lactation, and decrease with −0·11 kg/d in mid lactation when ether extract was increased with an average of 3% of DM, and Østergaard et al. (Reference Østergaard, Danfær, Daugaard, Hindhede and Thysen1981) found fat corrected milk production to increase with 0·92 kg/d in early and 0·56 kg/d in later lactation when FA was increased with 10 g/kg feed DM. However, Chilliard (Reference Chilliard1993) in his review, found higher responses in later lactation compared with early, more in agreement with the present experiment.

Fig. 2. Effect of FA intake on milk (a), energy corrected milk (ECM) (b) and solid yield (c, d, e) for the high and medium yielding cows. Significant linear effects except for protein yield (P for a 0·002, b 0·004, c 0·003, d 0·3, e 0·0004). Quadratic effects, and interactions between linear and quadratic FAration and production level were non significant for all shown yield measures.
Energy evaluation systems might also be responsible for varying conclusions in different studies. Different classical energy evaluation systems differ considerably in the ratio between fat and starch energy value. Also milk production responses to increased supplemental fat related to energy supply will therefore differ according to the energy evaluation system and thereby affect conclusions. The considerable positive effects of increased FAration on milk production, despite constant net energy intake (Fig. 1b), indicate that the energy factor used in the Danish FU system (Weisbjerg & Hvelplund, Reference Weisbjerg and Hvelplund1993; Hvelplund et al. Reference Hvelplund, Weisbjerg and Lund2007) severely underestimates net energy value of supplemental fat compared to starch, when the supplemental fat is rich in FA as in the present experiment.
Increased FAration increased fat and lactose, but not protein yield in kg/d (Fig. 2c,d,e). The responses to increased FAration in daily yield of fat, protein and lactose were negatively correlated to the cows' actual yield of fat, protein, and lactose, respectively, but not significantly for fat (Table 5). General linear responses (kg/d) per 10 g increase in FAration were 0·061 (P<0·0001), 0·012 (P=0·09) and 0·052 (P=0·0002) for fat, protein, and lactose, respectively (Table 5).
Milk composition
Increased FAration increased fat, and decreased protein (P=0·0002) and lactose concentration in milk. However, only the effect on protein was significant (Fig. 3a,b,c). For milk fat concentration, response was positively correlated to cows' actual milk fat concentration (Table 5). General linear responses (percent units) per 10 g increase in FAration were 0·039 (P=0·07), −0·071 (P<0·0001) and −0·005 (P=0·3) for fat, protein, and lactose concentration, respectively (Table 5). However, the response was significant only for protein. The negative effect of dietary fat supplementation on milk protein concentration is normally regarded as a dilution of a constant protein production with an increased milk production in kg, which this experiment also indicates as total protein production in kg was positively, although insignificant, affected by increased FAration. However, it could also be due to a direct effect on protein synthesis, as DePeters & Palmquist (Reference DePeters and Palmquist1990) found that fat supplementation reduced casein concentration more than concentration of non protein and whey proteins.

Fig. 3. Effect of FA intake on milk composition for the high and medium yielding cows. Significant linear effects except for fat % and lactose % (P for a 0·3, b 0·0002, c 0·7, d 0·0002, e 0·0008). Quadratic effects, and interactions between linear and quadratic FAration and production level were non significant for all shown milk composition measures.
When FAration was increased from 17 to 52 g/kg ration DM, the combined effect of a reduced protein and a slightly increased fat concentration heavily reduced (P<0·0001) the protein/fat ratio in milk, which was reduced from 0·83 to 0·75 and 0·86 to 0·77 for medium and high yielding cows, respectively (Fig. 3d). The general linear response in protein/fat ratio was −0·024 per 10 g increase in FAration (P<0·0001) (Table 5). Thereby fat supplementation seriously affects the composition of the value solids in milk (protein and fat).
Citrate concentration was highly affected by increased FAration. Increased FAration from 17 to 29 g FA/kg ration DM affected only citrate concentration slightly (Fig. 3e). However, neither quadratic FAration effect nor interactions between production level and FAration were significant. The general linear response (percent units) per 10 g increase in FAration was 0·0064 (P<0·0001), and the response was not correlated to cows' actual citrate concentration (Table 5). A higher citrate concentration reflects a decreased de novo FA synthesis in the mammary gland, as citrate is involved in the de novo FA synthesis (Faulkner & Peaker, Reference Faulkner and Peaker1982; Garnsworthy et al. Reference Garnsworthy, Masson, Lock and Mottram2006). Therefore, the increased citrate concentration indicates a decreased de novo FA synthesis in the mammary gland as FAration is increased, which also milk FA composition indicates.
Milk FA composition was affected by FAration as shown in Fig. 4. Short and medium chain FA (<C16) proportion of FA decreased considerably (Fig. 4a,b). Short chain FA (<C12) did not change when FAration was increased from FA-17 to FA-29, but FA-40 and FA-52 resulted in more severe decreases (quadratic FAration effect significant, P=0·02). This indicates, that the increase in FAration from FA-17 to FA-29 mainly resulted in a dilution of the de novo synthesised FA, whereas FA-40 and FA-52 both diluted and reduced de novo synthesised FA. Also, daily FA production indicates that de novo synthesis is not reduced by FA-29, and when de novo synthesis was reduced, it was mainly due to reduced C12:0–C14:0 synthesis, whereas daily production of C4:0–C10:0 was more constant (Figure 4g). However, no significant quadratic effects of FAration were found for the respective milk FA groups. The negligible effect of FA addition on the proportion of short chain FA in total milk FA is in accordance with Avila et al. (Reference Avila, DePeters, Perez-Monti, Taylor and Zinn2000), who only found a minor decrease in C4–C8 proportion of milk FA when supplementing rations with fat differing in degree of saturation. The negative effect of increased FAration on de novo FA synthesis, seen in the FA proportions and daily productions, is in accordance with the positive effect on citrate concentration (Fig. 3e), which also mainly was affected by FA-40 and FA-52. Proportion of C18 FA in total milk FA increased with increased FAration, whereas C16:0 FA (palmitic acid) only decreased slightly, indicating that increased supply by the feed was counteracted by decreased de novo synthesis of C16:0 (Figure 4c,d,f). The negligible effect of increased FAration on C16:0 concentration in milk, although C16 proportion of added FA was high, is in accordance with prediction equations proposed by Hermansen (Reference Hermansen1995). According to these equations predicting C16:0 proportion of milk FA based on FA concentration and proportion of C12:0, C14:0 and C16:0 in the feed ration, C16:0 proportion in milk should have been 33·0, 35·3, 35·6 and 34·9 (weight %), where measured C16:0 proportion was 41·2, 39·5, 39·5 and 39·2 (weight %) for FA-17, FA-29, FA-40 and FA-52, respectively. The higher proportion of C16:0 was especially on the expence of C4:0–C10:0 FA.

Fig. 4. Effect of FA intake on milk FA composition (% of total FA) for the high and medium yielding cows (a, b, c, d, e), and relative changes in proportions (f) and in daily FA production for some FA groups (g). Significant linear effect for all shown FA composition measures (P for a <0·0001, b <0·0001, c 0·04, d <0·0001, e <0·0001), and significant quadratic effect on C4–C10 (P=0·02). Quadratic effects (except C4:0–C10:0), and interactions between linear and quadratic FAration and production level were non significant for all shown milk FA composition measures.
The proportion of CLA (9, 11) increased substantially with increased FAration (Fig. 4e).
Desaturase activity in the mammary gland estimated as C14:1/(C14:1+C14:0) as recently proposed by Garnsworthy et al. (Reference Garnsworthy, Masson, Lock and Mottram2006), decreased (P<0·0001) with increased FAration from 0·099 to 0·081 (values not shown), which is comparable to the range 0·081–0·087 found by Garnsworthy et al. (Reference Garnsworthy, Masson, Lock and Mottram2006).
Milk fat quality
Recently, studies have shown that cheese produced by small MFG is less firm compared with cheese produced from large MFG (Michalski et al. Reference Michalski, Gassi, Famelart, Leconte, Camier, Michel and Briard2003 & Reference Michalski, Camier, Briard, Leconte, Gassi, Goudédranche, Michel and Fauquant2004). In the present study, MFG diameter for the lowest FAration levels seemed to be lower for high than for medium yielding cows, accordingly to a lower fat concentration (Fig. 5 & Fig. 3a). However, interaction between production level and FAration was not significant. The average diameter of MFG in general increased by 0·092 μm (P<0·0001), when FAration was increased by 10 g/kg DM (Table 5). Recent studies have shown that feeding a diet with a high level of saturated fatty acids results in milk with MFG having a large average diameter (Wiking et al. Reference Wiking, Björck and Nielsen2003 & Reference Wiking, Bertram, Björck and Nielsen2005), and further the average diameter of MFG is positively correlated with daily fat yield (Wiking et al. Reference Wiking, Stagsted, Björck and Nielsen2004).

Fig. 5. Effect of FA intake on average milk fat globule diameter (μm) for the high and medium yielding cows. Significant linear effect (P=0·03). Quadratic effects, and interactions between linear and quadratic FAration and production level were non significant.
Within production level, positive correlation between average diameter of MFG and daily fat yield was confirmed by the present study, and in accordance with the findings of Carroll et al. (Reference Carroll, DePeters, Taylor, Rosenberg, Perez-Monti and Capps2006). Large MFGs have been associated with high concentration of FFA in milk (Wiking et al. Reference Wiking, Björck and Nielsen2003 & Reference Wiking, Bertram, Björck and Nielsen2005). In the present study, no effect on FFA was observed when FAration was increased (Table 6). This indicates that the use of moderately saturated dietary FA has no effect on spontaneous lipolysis in milk, in contrast to highly saturated dietary FA, which increases the FFA level in milk (Astrup et al. Reference Astrup, Vik-Mo, Skrøvseth and Ekern1980; Wiking et al. Reference Wiking, Björck and Nielsen2003). The reason could be that the increase in the average diameter of MFG is lower compared with the other studies.
Table 6. FFA in milk fat (mmol/100 g fat)
† FA-17, FA-29, FA-40 and FA-52 refer to 17, 29, 40 and 52 g FA/kg ration DM, respectively
‡ Proc GLM, model including period and treatment as class variables. Only composite samples over treatments per period were analysed
§ Linear contrast
¶ Quadratic contrast
High levels of saturated FA can impair the milk quality by increasing FFA in milk, which can result in rancid flavour in dairy products. In studies, which used high levels of palmitic acid as fat supplements, the result was milk with high FFA content both spontaneous (Astrup et al. Reference Astrup, Vik-Mo, Skrøvseth and Ekern1980) and after pumping (Wiking et al. Reference Wiking, Björck and Nielsen2003). In general, the FA supplement used in the present study increased the milk production without impairing the milk fat quality. Furthermore, the study demonstrates that it is feasible to design the distribution of MFG through feeding.
In conclusion, energy corrected milk yield increased with increased FAration, and milk protein concentration and especially protein/fat ratio in milk decreased. In contradiction to the hypothesis, the response to increased FAration in yield of energy corrected milk was negatively correlated to the individual cows' actual milk production level.
Proportion of short and medium chain FA in total milk FA decreased and C18 FA increased with increased FAration, whereas palmitic acid (C16) proportion only decreased slightly.
Based on milk FA composition and production, as well as milk citrate concentration, increased FAration up to 29 g/kg DM seemed to dilute de novo synthesised FA in the mammary gland only, whereas increasing FAration up to 40 and 52 g/kg DM also decreased de novo synthesis itself, especially of C12:0–C14:0.
Milk fat globule diameter increased with increased FAration, whereas FFA level was unaffected.
Scanfedt A/S, Århus, Denmark is acknowledged for sponsoring the PFAD fat.