The final 3 weeks of pregnancy and the first 3 weeks of lactation of dairy cattle are defined as the transition period (Grummer, Reference Grummer1995). This time is characterised by an onset of negative energy balance as a result of decreasing nutrient intake and a concurrent increase of energy demand. This results in a challenge of the metabolism with an unavoidable negative energy balance (Grummer, Reference Grummer1995; Drackley, Reference Drackley1999). After parturition cows mobilise fat depots which lead to increased concentrations of plasma non-esterified fatty acids (NEFA) and is frequently associated with a higher serum concentration of ketone bodies (acetoacetate, beta-hydroxybutyrate and acetone) and a decrease of glucose concentration (Emery et al. Reference Emery, Liesman and Herdt1992). Ketosis and excessive fat mobilisation typically occur within the first 7 weeks post-partum but may already start before parturition. The application of propylene glycol (PG) supporting the cows energy metabolism during this exceptional period has been used since the 1950s (Johnson, Reference Johnson1954). PG is a glucoplastic substance and reduces the negative energy balance and the risk of ketosis and fatty liver. PG is metabolised within the rumen to lactic but mainly to propionic acid; hepatocytes convert these metabolites into glucose. However, this pathway appears not to be the dominating metabolic pathway (Kristensen & Raun, Reference Kristensen and Raun2007). A larger portion of PG is absorbed directly from the rumen without being metabolised and enters gluconeogenesis via pyruvate. PG application results in a fast increase of serum insulin concentration which is responsible for the main metabolic effects (Krebs, Reference Krebs1966; Baird et al. Reference Baird, Heitzman and Hibbitt1972; Nielsen & Ingvartsen, Reference Nielsen and Ingvartsen2004). The application of PG is considered as an efficient prevention and treatment of ketosis, but higher doses (>500 g/d) may generate toxic effects in cattle. Sulphur-containing substances, which are produced during PG metabolism within the rumen, are considered to provoke the toxic effects (Trabue et al. Reference Trabue, Scoggin, Tjandrakusuma, Rasmussen and Reilly2007).
Although PG has been used over decades the literature provides controversial information about required dosages, application methods and differences in efficacy of PG at different periods of lactation (Sauer et al. Reference Sauer, Erfle and Fisher1973; Grummer et al. Reference Grummer, Winkler, Bertics and Studer1994; Cozzi et al. Reference Cozzi, Berzaghi, Gottardo, Gabai and Andrighetto1996). The aim of the study was to investigate the metabolic effects in dairy cows at different times around the transition period giving different doses of PG. We hypothesised that the temporary insulin resistance seen during the transition period may cause significant differences in the efficacy of PG at the four sampling periods (dry cows, close up cows, fresh cows and lactating cows) and that in some cases this effect will be dose dependent (100, 300 and 500 ml, per os, one application per day).
Materials and methods
Animals
An approval for the study was obtained from institutional and governmental animal protection bodies (BMWF-68.205/0161-II/3b/2013). The study was performed on a commercial Holstein Friesian dairy herd in the south of Austria (federal state Styria). During the sampling period (September 2013 to April 2014) there were 41 dairy cows and 45 heads of young stock on the farm. The cows had a 305-d milk yield of 10,700 kg on average; average milk protein concentration was 3·45%, milk fat was 4·2% and milk urea 19 mg/100 ml. The ration of the lactating cows was prepared from a horizontal silo every afternoon using a mixer wagon. It contained 24 kg (35% DM) corn silage, 20 kg (40% DM) grass silage, 0·5 kg hay, 3 kg of concentrates (10% ground corn, 20% ground barley, 28% soy meal, 30% canola meal, 10% dried beet pulp, 2% mineral mixture) and 150 g urea. The lactating cows were fed additional concentrate (30% ground corn, 20% ground barley, 27% soybean meal, 10% canola meal, 10% dried beet pulp, 3% mineral mixture) using an transponder controlled automatic feeder according to their body condition and milk yield (max.7 kg/d). Winter was chosen as study period because of the constant silage feeding from the same horizontal silo over the whole time.
The average age at first calving was 26 months. During parturition the cows were tied up in a separate barn area. Animals were separated 3 d antepartum (ap) up to 2 d post-partum (pp). Starting with their third lactation all cattle receive a prophylactic dose of Duphafral (Vitamin D3 10 Mio IU, IM; Zoetis GmbH, A-1210 Vienna) before parturition. Immediately after calving the cows were treated with 500 ml Calcitat (calcium solution, containing 2·28 g Ca/100 ml, IV; OGRIS Pharma A-4600 Wels) and with 50 ml Catosal (Butafosfan 100, Cyanocobalamin 0·05, n-Butanol 30 mg/ml, IV; Bayer B-1831 Diegem (Machelen)). Routinely the farmer applies 500 ml of PG after parturition, but the animals included in the study were excluded from this treatment. The lactating cows were milked twice a day at intervals of 10 and 14 h at a herringbone milking parlour (2 × 4). Every 5 to 6 weeks the milk yield and composition was measured by the Dairy Monitoring Association of Styria (LKV).
A convenience sample (animals which were in a suitable stage of pregnancy at that period before starting their 2nd to 5th lactation) of 7 pregnant cows was selected for the study. The cows entered the study according to their pregnancy status. The calculated calving dates were between November 2013 and March 2014; so the sampling period was determined from September 2013 to April 2014. The selected animals were subjected to a clinical examination. Cows had to be clinically healthy with an uneventful pregnancy. They showed a body condition score (BCS) of 3·0–4·0 (score 1–5), and respectively a back fat thickness of 20–30 mm. The measurement of back fat thickness was performed by ultrasonography (Staufenbiel, Reference Staufenbiel1997; Schroeder & Staufenbiel, Reference Schroeder and Staufenbiel2006).
Study design
The 7 selected cows were studied at four sampling periods of 3 d length each. Each cow contributed 12 measurement days to the overall 84 measurement days. During the measurement days cows were tied up in a separate barn area. Cows are used to be tied up in this area for other procedures like insemination, sample taking, treatment. The concentrate which was normally provided by the automatic feeding system was fed manually during these days. On each of these days 3 h after morning feeding PG was drenched in different dosages of 100, 300 or 500 ml orally, one application per day (cross over study). The different doses were applied in an alternating order following a Latin Square study design.
Following 4 sampling periods were defined:
-
1. dry cow period (D): days 40, 39 and 38 ap
-
2. close up cow period (C): days 10, 9 and 8 ap
-
3. fresh cow period (F): days 3, 4 and 5 pp
-
4. lactating cow period (L): days 38, 39 and 40 pp
Blood was collected from the jugular vein using a jugular catheter (Intraflon 2, 12 × G; 80 mm length; Hohenwallner, A-4060 Leonding). Before feeding the PG a blood sample was obtained to determine the base line (time 0). Further blood samples were taken every half an hour up to 4 h, after 6 h and finally 12 h past PG application. Since the PG administration results in an instant but short effect (Krebs, Reference Krebs1966; Baird et al. Reference Baird, Heitzman and Hibbitt1972; Nielsen & Ingvartsen, Reference Nielsen and Ingvartsen2004) a longer washout period was not necessary. Blood samples in serum tubes (10 ml; Sarstedt AG & Co, D-51582 Nümbrecht) were immediately placed in a refrigerator (4 °C) for 40 min and centrifuged (approx. 1500 g , 3 min.) afterwards. The serum was transferred into Eppendorf tubes (1·5 ml; Sarstedt AG & Co, D-51582 Nümbrecht) and stored in the freezer at −21 °C until analysed.
The following parameters to assess the energy metabolism were analysed: glucose, insulin, non-esterified fatty acids (NEFA), betahydroxybutyrate (BHB), bilirubin, cholesterol, aspartate aminotransferase (AST) and glutamate dehydrogenase (GLDH). Further potassium concentrations were measured. Glucose, insulin and potassium were measured in all samples. All the other parameters were analysed at 0, 2, 4, 6 and 12 h after applying PG. A Revised Quantitative Insulin Sensitivity Check Index (RQUICKI) was calculated. The calculation is based on serum concentrations of glucose, insulin and NEFA (concentrations of glucose (G) in mg/dl, insulin (I) in μU/ml and NEFA in mmol/l (Perseghin et al. Reference Perseghin, Caumo, Caloni, Testolin and Luzi2001; Holtenius & Holtenius, Reference Holtenius and Holtenius2007) using the equation: RQUICKI = 1/[log (G) + log (I) + log (NEFA)]. A low index value indicates decreased insulin sensitivity.
Laboratory analysis
Insulin was analysed by a commercial solid-phase-radioimmunoassay (RIA, Siemens). A125I-labeled insulin (tracer) competes with the insulin of the sample for the binding sites of the insulin-antibodies. Antibody-linked Insulin (=linked radioactivity) was measured by Gammacounter ‘WIZARD 1470’ (Perkin Elmer). Insulin concentration of the samples was directly proportional to the bound radioactivity; it was determined by the software ‘Multicalc’ (Perkin Elmer). The coefficients of variation (intra-, interassay) were 4·6 or 5·6%; the lower detection limit was 8·8 pmol/l.
The determination of glucose was done by the unit ‘GLUC3’ (cobas) using the hexokinase method (Burtis & Bruns, Reference Burtis and Bruns2014). A commercial analysis colorimetric method (Randox Laboratories Limited) was used for the quantitative determination of non-esterified fatty acids (NEFA) in serum (DeVries et al. Reference DeVries, Mamunes, Miller and Hayward1976). A quantitative kinetic enzymatic method (Ranbut RB 1007; Randox Laboratories Limited) was used for determination of D-3-hydroxybutyrate (McMurray et al. Reference McMurray, Blanchflower and Rice1984). The determination of bilirubin was done by the unit ‘BILT3’ (cobas, System-ID 07 7483 9) using a quantitative in vitro colorimetric diazo-method (Wahlefel et al. Reference Wahlefel, Bernt and Herz1972).The determination of GLDH was done by the unit ‘GLDH3’ (cobas; System-ID 07 6789 1) using a standardised quantitative in vitro UV-method (Greiling & Arndt, Reference Greiling and Arndt1995). The determination of AST was done by the unit ‘ASTLP’ (cobas; System-ID 07 6856 1) using a quantitative pyridoxalphosphate activating method (Bergmeyer et al. Reference Bergmeyer, Horder and Rej1986). The analysis of cholesterol was performed by the unit ‘CHOL2’ (cobas; System-ID 07 6726 3) using a quantitative enzymatic colour method (Greiling & Arndt, Reference Greiling and Arndt1995). The ‘ISE indirect Na-K-Cl for Gen.2’ was used for the quantitative determination of potassium, with an ion-selective electrode (Burtis & Bruns, Reference Burtis and Bruns2014).
Statistical analysis
Data are presented as arithmetic mean and standard deviation (AM ± sd). Normal distribution has been tested using the Kolmogorov–Smirnov-Test. Since a number of the parameters were not normally distributed all data were log transformed before analysed. Statistical analyses were performed using a mixed-effects linear model (dosage × treatment period × interaction dosage/treatment period) which allowed accounting for the repeated measurements and yield the treatment period, sequence of treatment, and carryover effects. The animals were considered a random factor to yield intra and inter-animal variability. P values < 0·05 have been considered to indicate significant differences.
Results
The effects of treatment period and dosage on serum concentrations of glucose, insulin and NEFA after oral application of 100, 300 or 500 ml PG during dry period, close up period, fresh cow period and lactation are shown in Figures 1–3. Amplitudes and duration of statistically significant PG induced effects are also shown in online Supplementary Tables S1, S2 and S3. PG application had a similar effect on both Insulin and serum potassium concentration; BHB and bilirubin have also been influenced by PG application. No significant effects of the PG application could be demonstrated in cholesterol, AST and GLDH. Further RQUICKI did not differ between the sampling periods and treatments. These parameters are given in online Supplementary Tables S1, S2 and S3.

Fig. 1. Serum glucose concentrations (AM ± sd) at different time (in h) after oral application of 100 ml propylene glycol (Fig. 1a), after oral application of 300 ml propylene glycol (Fig. 1b), and after oral application of 500 ml propylene glycol (Fig. 1c) in 7 cows during dry period (D), close up period (C), fresh cow period (F) and lactation (L). Different alphabetical indices in the upper row indicate differences between the groups of animals within the sampling period. Different symbols in the lower row indicate effects over sampling time within the groups in comparison to t0.

Fig. 2. Serum insulin concentrations (AM ± sd) at different time (in h) after oral application of 100 ml propylene glycol (Fig. 2a), after oral application of 300 ml propylene glycol (Fig. 2b), and after oral application of 500 ml propylene glycol (Fig. 2c) in 7 cows during dry period (D), close up period (C), fresh cow period (F) and lactation (L). Different alphabetical indices indicate differences within the sampling period. Different symbols in the lower row indicate effects over sampling time within the groups in comparison to t0.

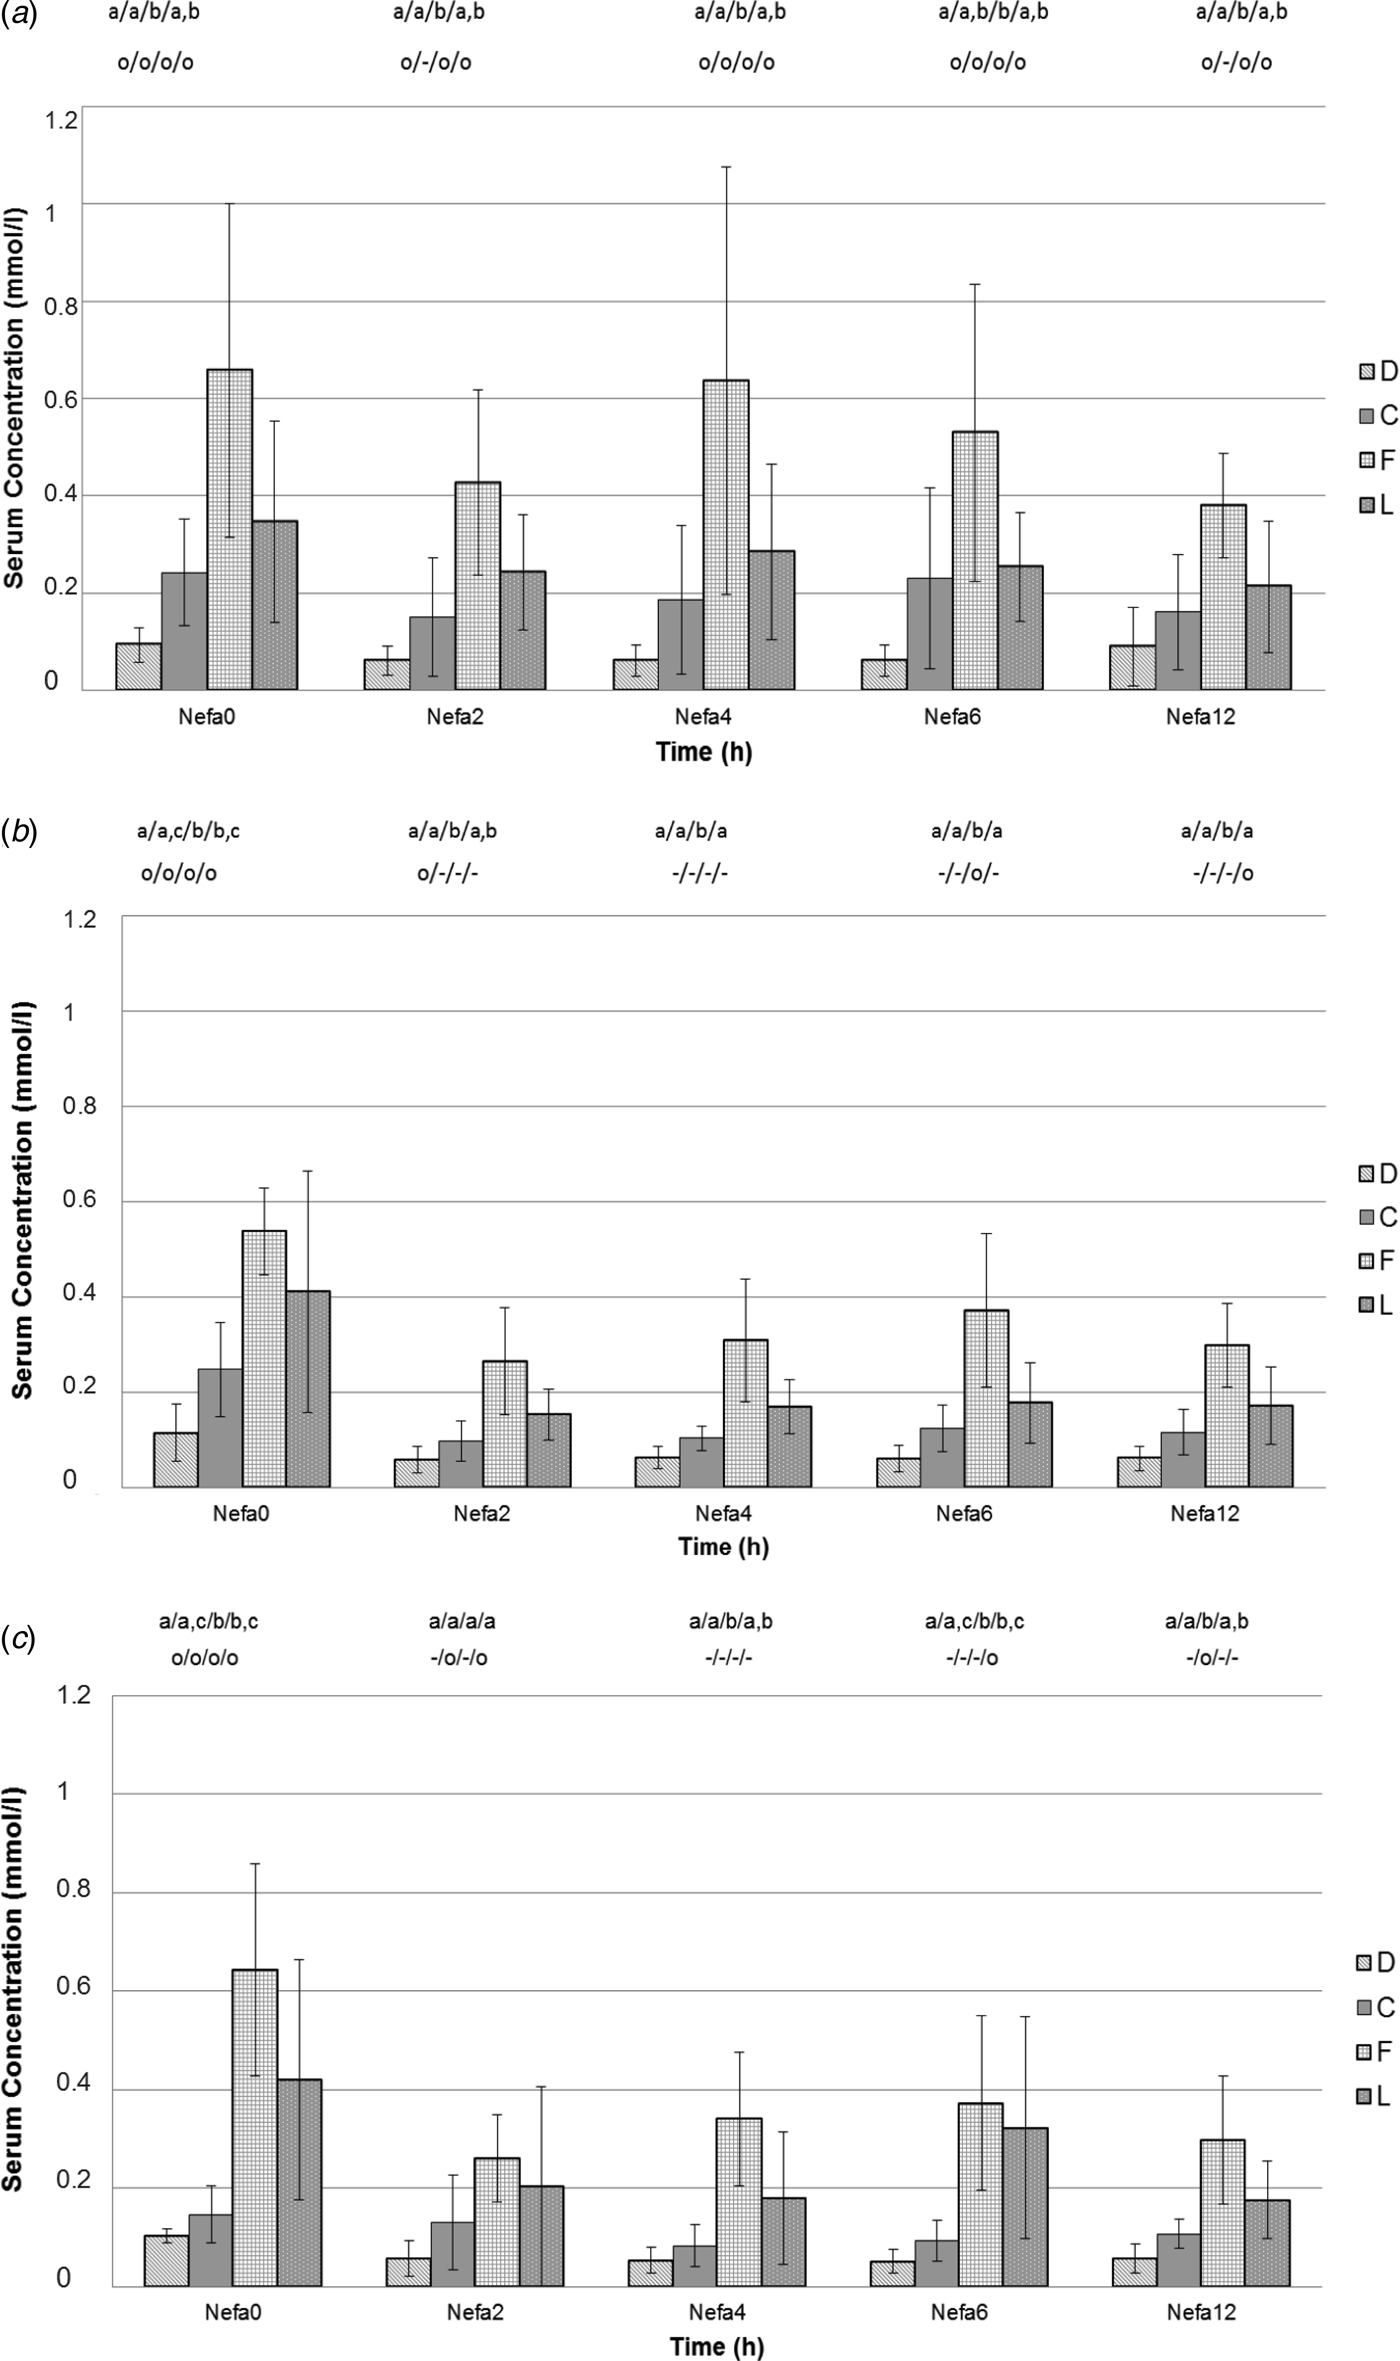
Fig. 3. Serum NEFA concentrations (AM ± sd) at different time (in h) after oral application of 100 ml propylene glycol (Fig. 3a), after oral application of 300 ml propylene glycol (Fig. 3b), and after oral application of 500 ml propylene glycol (Fig. 3c) in 7 cows during dry period (D), close up period (C), fresh cow period (F) and lactation (L). Different alphabetical indices indicate differences within the sampling period. Different symbols in the lower row indicate effects over sampling time within the groups in comparison to t0.
Dry cow period
In dry cows glucose and insulin concentrations increased after an application of 100, 300 and 500 ml of PG (Figs 1 and 2). These effects were dose dependent; the most extensive and longest lasting effect in dry cows was seen after applying the highest dosage for both parameters (Figs 1c and 2c). NEFA concentrations during dry cow period were low and within physiological range. Dry cows needed a minimum of 300 ml of PG to reduce their NEFA concentrations further. The decrease after 500 ml appeared faster, but the effect after 300 ml was stronger (Fig. 3b, c). In dry cows potassium concentration was influenced by a minimum of 300 ml of PG. The highest and longest lasting effect was seen after applying 500 ml. BHB and bilirubin were low and not affected by PG in dry cows.
Close up period
A minimum of 300 ml of PG was necessary in close up cows to show an increase in glucose concentration with a more prominent effect after applying 500 ml (Fig. 1b, c). Insulin concentration increased after all doses of PG (Fig. 2). In close up cows a decrease in NEFA concentration could also be seen after each dose of PG. The strongest effect was seen after the highest dose (Fig. 3c), but the effect appeared half an hour later than after applying the other dosages (Fig. 3a, b). Close up cows needed a minimum of 300 ml to show a decrease in bilirubin, the most extensive effect was seen after applying 500 ml. Close up cows showed a short-time decrease in potassium concentration only after 500 ml. BHB concentrations were low and not affected by PG in close up cows.
Fresh cow period
In fresh cows there was an increase of glucose concentration after each PG dosage, but after applying 300 ml it took half an hour longer to show a statistically significant effect (Fig. 1b). The strongest and longest lasting effect was seen after applying 500 ml (Fig. 1c). A short-time increase of insulin concentration in fresh cows was only presented after applying 500 ml (Fig. 2c), whereas lower concentrations did not have any effect (Fig. 2a, b). In fresh cow period the NEFA concentrations were increased 700 µmol/l. A minimum of 300 ml PG was needed to show a significant decrease in NEFA in fresh cows (Fig. 3b). The highest and longest lasting effect appeared after 500 ml (Fig. 3c). A minimum of 300 ml PG was necessary to decrease BHB concentration in fresh cows. Serum bilirubin and potassium concentrations decreased only after 500 ml of PG.
Lactation period
In lactating cows serum glucose concentration increased after application of 100, 300 and 500 ml of PG. The most profound and longest lasting effect was seen after the middle dosage (Fig. 1b). Insulin increased after all doses of PG with dose dependent effects. The highest and longest lasting effect in the lactating ones was shown after 500 ml (Fig. 2c). Lactating cows showed a more extensive and faster decrease of NEFA concentration after 300 ml in comparison to 500 ml PG (Fig. 3b, c). However, no effect was seen after applying 100 ml (Fig. 3a). BHB needed a minimum of 300 ml to show an effect. The decrease was more extensive and lasted longer after applying 500 ml. Bilirubin needed a minimum of 300 ml to show a decrease. The highest effect was seen after applying 500 ml. Lactating cows showed a short-lived decrease in potassium after 100 ml but not after 300 or 500 ml.
It can be summarised that in a number of parameters PG had a dose dependent effect which however was influenced by the sampling period. In fresh cows higher dosages were necessary to influence metabolic parameters (glucose, insulin, NEFA, BHB and bilirubin). Although we did not compare to topdressing of PG, the results indicate that it seems necessary to apply PG as a bolus of a specific volume especially to generate an increase of serum insulin concentration.
Discussion
The present study was conducted to determine significant effects of a single oral PG bolus administration on various metabolic parameters (glucose, insulin, NEFA, BHB, bilirubin, cholesterol, AST and GLDH) during different periods according to calving. PG is a glucoplastic substance for ruminants and may reduce the negative energy balance and the risk of ketosis and fatty liver. The effect is mediated by propionate which stimulates the increase of the blood insulin concentration (Kristensen & Raun, Reference Kristensen and Raun2007). Insulin is a key hormone in regulation of lipolysis in adipocytes (Vernon, Reference Vernon2005). Decreased plasma levels of ketone bodies and NEFA indicate decreased lipolysis induced by the increased insulin effects (Kristensen & Raun, Reference Kristensen and Raun2007).
Three different dosages (100, 300 or 500 ml once per day) have been used although higher PG dosages have been suggested in literature (Johnson, Reference Johnson1954; Trabue et al. Reference Trabue, Scoggin, Tjandrakusuma, Rasmussen and Reilly2007). It seems possible that a wider range of the dosages and a higher maximal dose of PG than used in the present study would have shown more distinctive effects; however, since higher dosages may result in toxic effects (sulphur-containing substances, which are produced during PG metabolism within the rumen, are considered to provoke these effects (Trabue et al. Reference Trabue, Scoggin, Tjandrakusuma, Rasmussen and Reilly2007)) the maximal dosage was limited to 500 ml. The present study used drenching as application method which is considered as the most reliable method of application (Piantoni & Allen, Reference Piantoni and Allen2015).
In dry cows the parameters glucose, insulin and NEFA were significantly influenced by the application of PG. Glucose and insulin concentrations increased promptly after applying each of our defined dosages, whereas NEFA needed a minimum of 300 ml of PG to show an effect. This corroborates the results of Christensen et al. (Reference Christensen, Grummer, Rasmussen and Bertics1997); they found that PG was more effective reducing NEFA during lactation than during end of pregnancy; however this effect is mainly because of the higher concentrations of these metabolites in lactating cows (Christensen et al. Reference Christensen, Grummer, Rasmussen and Bertics1997). Low NEFA concentrations of approximately 100 µmol/l before PG application are an indicator for a very low metabolic and hepatic challenge in our dry cow treatment group.
In close up cows insulin and NEFA concentrations were affected by all dosages of PG. Our findings do not agree with those of a Polish study, where no significant effects were seen in both parameters after applying 400 ml of PG in close up cows (Mikula et al. Reference Mikula, Nowak, Jaskowski, Mackowiak, Pruszynska and Wlodarek2008). This difference is most likely caused by the way of application. In the Polish study PG was administered by top dressing which does not guarantee that the PG is ingested as bolus, while cows were drenched in the present study. Glucose and bilirubin concentrations were influenced if a minimum of 300 ml PG was given to close up cows. Since insulin was already affected by 100 ml of PG, the glucose reaction at this level was probably overruled by the quick insulin answer.
In the present study no decreases in serum BHB were seen in dry and close up cows. This is most likely the consequence of the very low initial concentrations of BHB and NEFA in healthy, well eating cows during these periods, which did not allow a further reduction. Nielsen & Ingvartsen (Reference Nielsen and Ingvartsen2004) published similar findings: PG induces the most extensive decreases in serum BHB in cattle with higher NEFA concentrations, so in fresh cows, not in dry and close up cows. Cows with low antepartum BHB and NEFA concentrations are less likely to develop typical post-partum diseases like clinical ketosis, displaced abomasum, milk fever or retained placenta than animals with higher blood levels of NEFA and BHB antepartum (Coiatelli et al. Reference Coiatelli, Giordano, Sicilia, Moretti and Durel2015; Tatone et al. Reference Tatone, Gordon, LeBlanc and Duffield2015). Hence the administration of PG in cows with reduced feed intake antepartum is advisable. As mentioned above, dry cows react on 300 ml of PG. In close up cows 100 ml were sufficient to affect NEFA concentrations.
The present results show that in fresh cows the highest PG dosage (500 ml) was necessary to reduce NEFA concentrations. These results confirmed the results of a study done in 2003, in which concentrations of NEFA in plasma were decreased after applying 500 ml of PG to fresh lactating cows (Pickett et al. Reference Pickett, Piepenbrink and Overton2003). A study in 2008 however showed that a dose of 400 ml of PG did not influence the serum NEFA concentration in transition cows (Mikula et al. Reference Mikula, Nowak, Jaskowski, Mackowiak, Pruszynska and Wlodarek2008). This confirms our findings that a certain volume of PG has to be given as bolus to affect insulin, glucose and NEFA concentrations substantially. Further, as already mentioned PG was given as top dressing in the Polish study therefore no information on the actual intake could be made.
Although RQUICKI did not differ significantly fresh cows showed the expected insulin resistance as tendency. The lack of statistical significance was most likely caused by the relative low number of animals. These cows showed an insulin response only after applying 500 ml of PG. In 2008 it was shown, that 400 ml of PG did not significantly influence the serum insulin concentration of fresh cows at all (Mikula et al. Reference Mikula, Nowak, Jaskowski, Mackowiak, Pruszynska and Wlodarek2008); the limitation of that study has been mentioned before. The present results suggest that a minimal dose of 500 ml as bolus is necessary to achieve a significant effect on serum insulin concentration at this time of lactation. A former study showed that insulin concentrations were depressed in fresh cows, which was also observed in the present study (Studer et al. Reference Studer, Grummer, Bertics and Reynolds1993a). These authors described that the insulin concentration was increased after applying 1000 ml PG, a dosage which was not used in the present study to avoid toxic effects.
BHB concentrations were decreased after dosing with 300 ml PG in the fresh cows. Since BHB values have not been found to vary diurnally in fresh cows (Mahrt et al. Reference Mahrt, Burfeind and Heuwieser2014) the effects were most likely attributable to PG. Blood NEFA concentrations were higher in fresh cows than in the dry and close up group (Fig. 3a–c); so considerable decreases after applying PG were seen, which has also been found elsewhere (Nielsen & Ingvartsen, Reference Nielsen and Ingvartsen2004). The study of Lomander et al. (Reference Lomander, Frössling, Ingvartsen, Gustafsson and Svensson2012) did not find any effect on BHB during the first weeks in milk after applying 300 ml of PG. However, since the daily dose of PG was divided into two portions of 150 ml each and only 3 blood samples with a 3 weeks interval between them had been taken, these results are questionable. The results of the present study suggest that the PG effect is not only dose-dependent but perhaps may also be dependent on the frequency and way of administrating 300 ml of PG (given as an only once daily drench).
Lactating cows showed increasing glucose concentrations after applying 100 ml of PG. To increase insulin concentrations 300 ml of PG were necessary. The same effects on glucose were shown by feeding 200 ml of PG (Cozzi et al. Reference Cozzi, Berzaghi, Gottardo, Gabai and Andrighetto1996). It has been shown that there was no diurnal variation in glucose in lactating cows (Nielsen et al. Reference Nielsen, Ingvartsen and Larsen2003) indicating that the changes seen in the present study were induced by PG administration. However, Nielsen et al. (Reference Nielsen, Ingvartsen and Larsen2003) did find a diurnal variation in plasma NEFA concentrations in lactating cows (highest in the morning); on the other hand Eicher et al. (Reference Eicher, Liesegang, Bouchard and Tremblay1999) showed that there was no diurnal variation in NEFA (Eicher et al. Reference Eicher, Liesegang, Bouchard and Tremblay1999). In the present study a dose of 300 ml of PG was necessary to decrease NEFA concentration in lactation cows. Influences of diurnal variation on the results cannot be fully excluded; however since our study was always performed at the same time of the day it would have been a systemic influence on all measurements. The study of Nielsen et al. (Reference Nielsen, Ingvartsen and Larsen2003) also described that plasma BHB was higher in the evening. These results were confirmed by another study (Mahrt et al. Reference Mahrt, Burfeind and Heuwieser2014). In the present study a dose of 300 ml was needed to influence BHB and bilirubin concentrations. A study published in 2009 yielded similar results: nearly the same dose of PG (250 ml) decreased BHB concentration in lactating cows (Chung et al. Reference Chung, Brown, Martinez, Cassidy and Varga2009).
In all groups of the study and at all study periods the cholesterol concentration and the activities of AST and GLDH were not affected by PG, in agreement with the results published before (Hoedemaker et al. Reference Hoedemaker, Prange, Zerbe, Frank, Daxenberger and Meyer2004). However effects were seen in potassium concentration. The administration of PG resulted in a decrease in blood potassium concentration in all four groups. This is due to the fact that the increase in insulin causes absorption of potassium into the cell (Baynes & Dominiczak, Reference Baynes and Dominiczak2014). Potassium concentration in dry cows decreased after 300 and 500 ml. The higher dose resulted in a more prominent effect. Close up and fresh cows only showed a decreasing effect after the application of 500 ml. Lactating cows, curiously decreased their blood potassium concentration after applying 100 ml of PG, but not after 300 or 500 ml.
Summarising the study showed that for the major metabolic parameters (insulin, glucose, NEFA, and BHB) the impact of PG application is dose dependent and that the effect of PG is also dependent on time to or from calving. Fresh cows require higher dosages of PG to provoke similar effects in comparison to dry, close up or lactating cows. These finding might explain some of the conflicting reports about efficacy of PG application (Studer et al. Reference Studer, Grummer, Bertics and Reynolds1993b; Grummer et al. Reference Grummer, Winkler, Bertics and Studer1994). Overall a dose of 500 ml for post calving cows seems the most appropriate whereas during dry period or later in lactation dosage of 100 or 300 ml are sufficient. Although the study did not compare to topdressing of PG from it is reasonable to assume that bolus application of a specific PG volume is necessary to provoke the effect.
Supplementary material
The supplementary material for this article can be found at https://doi.org/10.1017/S0022029917000486.
We gratefully acknowledge the animal feed producing company ‘GARANT’ for providing the required volume of propylene glycol and for financial support of the study. Sincere appreciation is extended to the farmer Otto Jauschnegg for allowing using his cattle and for his help. Further we like to thank Prof. D. Loque for his help preparing the manuscript.