The European Union (EU) is the biggest world exporter of cheese, with about 790K tonnes in 2013, and among EU countries Italy is the main producer of Protected Designation of Origin (PDO) cheeses. The most popular PDO Italian cheese is Grana Padano, a hard, cooked and long ripened product manufactured using partially skimmed raw milk. Grana Padano has to be produced in a specific geographical area of North Italy (European Commission, 2006, 2009), following a strict manufacturing protocol (Grana Padano Cheese Consortium, 2015).
The ‘Trentingrana – Consorzio dei Caseifici Sociali Trentini s.c.a.’ is a consortium which groups several dairy factories located in the Trento province, an Alpine territory located in northeast Italy. Dairy factories collect milk from small to medium size herds rearing dairy and dual-purpose cattle breeds and they are allowed by Grana Padano cheese PDO Consortium to produce a geographic specification of Grana Padano cheese (Salvadori Del Prato, Reference Salvadori Del Prato1994) labelled as ‘Trentingrana’. The production rules of Trentingrana are more strict than those considered in the manufacturing protocol of Grana Padano cheese. In particular, the use of silages to feed cows and the addition of lysozyme during milk coagulation are not permitted. The Trento province is an heterogeneous area characterised by different dairy systems (Sturaro et al. Reference Sturaro, Marchiori, Cocca, Penasa, Ramanzin and Bittante2013) and farms are spread across several valleys, each having specific environmental features.
The milk quality payment system in Trento province involves several traits, including milk coagulation properties (MCP), which can be measured using a number of devices, the most common being the Formagraph and mid-infrared spectroscopy (De Marchi et al. Reference De Marchi, Toffanin, Cassandro and Penasa2013, Reference De Marchi, Toffanin, Cassandro and Penasa2014; Tiezzi et al. Reference Tiezzi, Pretto, De Marchi, Penasa and Cassandro2013; Visentin et al. Reference Visentin, McDermott, McParland, Berry, Kenny, Brodkorb, Fenelon and De Marchi2015). Milk coagulation properties are indicators of the efficiency of the cheese-making process (Summer et al. Reference Summer, Malacarne, Martuzzi and Mariani2002) and there is evidence that they influence cheese yield, especially in hard cheeses (Aleandri et al. Reference Aleandri, Schneider and Buttazzoni1989; Malacarne et al. Reference Malacarne, Summer, Fossa, Formaggioni, Franceschi, Pecorari and Mariani2006; Pretto et al. Reference Pretto, De Marchi, Penasa and Cassandro2013). However, the relationship between MCP and cheese yield has not been completely disentangled yet and it needs further investigation.
Milk coagulation properties have been extensively studied both from genetic and phenotypic point of view (e.g. Ikonen et al. Reference Ikonen, Morri, Tyrisevä, Ruottinen and Ojala2004; Malacarne et al. Reference Malacarne, Fieni, Tosi, Franceschi, Formaggioni and Summer2005; Cassandro et al. Reference Cassandro, Comin, Ojala, Dal Zotto, De Marchi, Gallo, Carnier and Bittante2008). However, there is a paucity of studies dealing with sources of variation of MCP in the dairy industry under field conditions. Therefore, the aim of this study was to investigate the impact of environmental factors, milk casein content and titratable acidity on MCP of bulk milk samples routinely collected in the Trento province for milk quality payment.
Materials and methods
Data
Data of bulk milk analyses were retrieved from the laboratory of the ‘Trentingrana – Consorzio dei Caseifici Sociali Trentini s.c.a.’ operating in Trento province and referred to milk samples processed in 2012. The consortium groups 17 dairy factories located across the Trento province and each dairy factory includes several farms. Quality traits of milk samples collected routinely from each associated herd are used in the payment system of the consortium to reward or penalise each associated herd according to results from milk analysis.
Fat, protein, and casein percentages were predicted by mid-infrared spectroscopy using a Milkoscan FT6000. Somatic cell (SCC) and bacterial counts (BC) were determined by flow cytometers with Fossomatic and Bactoscan FC, respectively (Foss Electric, Hillerød, Denmark). Titratable acidity (TA) was measured through a Hach-Lange Crison Titromatic S1 (HACH – Crison Italian unit, Milano, Italy) and expressed in Soxhlet-Henkel degrees (°SH/50 ml). Finally, MCP were assessed using the Formagraph (Foss Electric, Hillerød, Denmark) over a testing time of 30 min. The Formagraph provides 3 measures of MCP: rennet coagulation time (RCT, min), defined as the time between the addition of rennet to milk and the formation of the first coagulum; curd-firming time (k20, min), which corresponds to the time from the beginning of coagulation to the moment the width of the curve reaches 20 mm of firmness; and curd firmness (a30, mm), which is the final consistency of the curd 30 min after enzyme addition. Values of SCC and BC were not normally distributed and thus they were log-transformed to somatic cell score (SCS) and log bacterial count (LBC), respectively, to achieve normality and homogeneity of variances. Somatic cell score was calculated as SCS = 3 + log2(SCC/100 000), and LBC was obtained as LBC = log10(BC).
The initial dataset was edited to ensure that each farm conferred milk to the same dairy factory during 2012 and that it was sampled at least 12 times in the same year (i.e., once per month). Moreover, inconsistent information on studied traits were labelled as missing values in the dataset. After data editing, 14 971 milk samples from 635 herds were available for statistical analysis. The average number of herds associated to the 17 dairy factories was 37, and ranged from 8 to 109.
An index of milk aptitude to coagulate (IAC) standardised to mean 100 and sd 5 was built using the formula:
where meana30 and meanRCT are average values of a30 and RCT, respectively, as calculated from the dataset after editing, and sda30 and sdRCT are the corresponding standard deviations.
Statistical analysis
Data of MCP and IAC were analysed using the GLM procedure of the SAS software (SAS Institute Inc., Cary, NC) according to the following linear model:
 $$\eqalign{{y_{ijklmnopq}} & = \mu + {\rm D}{{\rm F}_i} + {\rm HER}{{\rm D}_j}\left( {{\rm D}{{\rm F}_i}} \right) + {{\rm M}_k} + {\rm FA}{{\rm T}_l} + {\rm CA}{{\rm S}_m} \cr & \quad + {\rm T}{{\rm A}_n} + {\rm SC}{{\rm S}_o} + {\rm LB}{{\rm C}_p} + {\left( {{\rm DF} \times {\rm M}} \right)_{ik}} \cr & \quad+ {\left( {{\rm CAS} \times {\rm TA}} \right)_{mn}} + {\left( {{\rm TA} \times {\rm LBC}} \right)_{np}} + {e_{ijklmnopq}},} $$
where y ijklmnopq is RCT, k20, a30 or IAC; μ is the overall intercept of the model; DFi is the fixed effect of the ith dairy factory (i = 1–17); HERDj(DFi) is the fixed effect of the jth herd (j = 1–635) nested within the ith dairy factory; Mk is the fixed effect of the kth month of analysis (k = 1–12); FATl is the fixed effect of the lth class of milk fat content (l = 1–3); CASm is the fixed effect of the mth class of milk casein content (m = 1–3); TAn is the fixed effect of the nth class of milk titratable acidity (n = 1–3); SCSo is the fixed effect of the oth class of somatic cell score (o = 1–3); LBCp is the fixed effect of the pth class of log bacterial count (p = 1–3); (DF x M)ik is the fixed interaction effect between the ith dairy factory and the kth month of analysis; (CAS × TA)mn is the fixed interaction effect between the mth class of milk casein content and the nth class of milk titratable acidity; (TA × LBC)np is the fixed interaction effect between the nth class of milk titratable acidity and the pth class of log bacterial count; and e ijklmnopq is the random residual ~ N (0, σ2e). Classes of fat content, casein content, TA, SCS and LBC were defined according to mean ± 1·0 sd so that class 1: ⩽−1·0 sd, class 2: from −1·0 sd to 1·0 sd, and class 3: ⩾1·0 sd. Significance of dairy factory effect was tested on the herd within dairy factory variance.
Pearson's correlations between the studied traits were estimated using the CORR procedure of SAS software (SAS Institute Inc., Cary, NC).
Results and discussion
Descriptive statistics of MCP
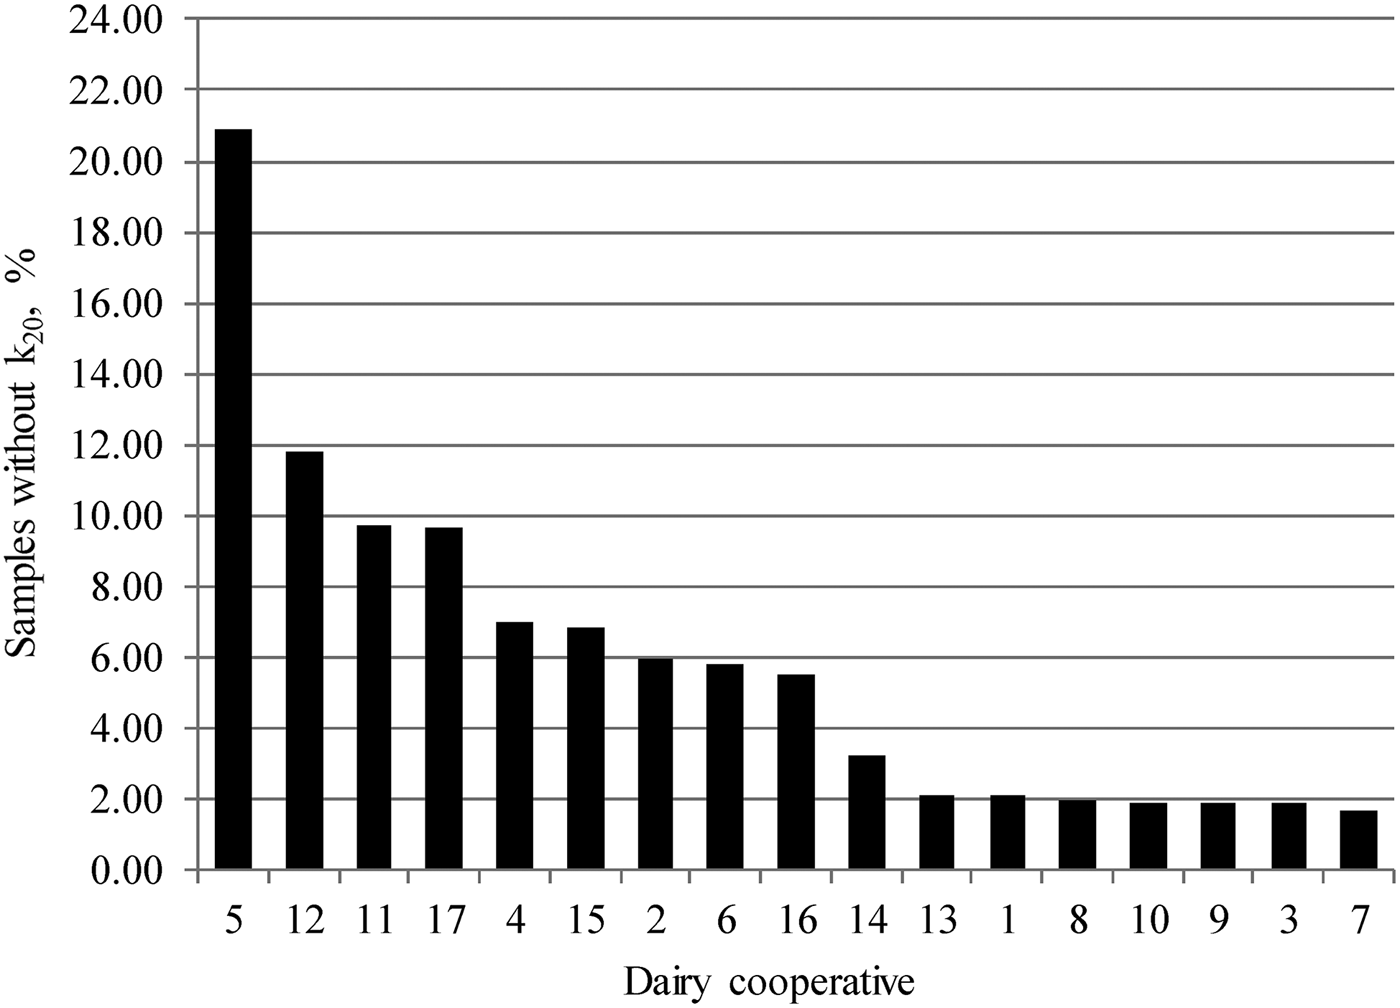
About 3% of milk samples did not coagulate within 30 min from rennet addition, and the information on k20 was lacking for 26% of analysed milks. The percentage of samples without information on k20 varied considerably among dairy factories, from 1·7 to 20·9% (Fig. 1). Curd-firming time indicates the optimal time at which curd-cutting should commence and it is related to yield and quality of cheese (Bynum & Olson, Reference Bynum and Olson1982). However, k20 can be achieved only for samples which reach 20 mm of curd firmness during the test, whereas it is not available for non-coagulating or late-coagulating milks. There is a paucity of studies that have investigated the variation of MCP in bulk milk samples. Toffanin et al. (Reference Toffanin, De Marchi, Penasa, Pretto and Cassandro2012) characterised MCP of 1570 bulk milks from mainly Holstein–Friesian herds and 3·95% of them did not coagulate within 30 min from rennet addition. The incidence of non-coagulating milks reported by Toffanin et al. (Reference Toffanin, De Marchi, Penasa, Pretto and Cassandro2012) was slightly greater than the value (3%) of the present study. De Marchi et al. (Reference De Marchi, Dal Zotto, Cassandro and Bittante2007) analysed 506 bulk milks from single breed herds of 5 cattle breeds and k20 was lacking for 21% of samples, which is slightly lower than our finding (26%).

Fig. 1. Distribution of samples without information on curd-firming time (k20) across dairy factories.
Rennet coagulation time, k20 and a30 averaged 17·81 min 5·97 min and 24·13 mm, respectively (Table 1), and k20 exhibited greater coefficient of variation (34·4%) than RCT (18·3%) and a30 (27·5%). These results were in the range of findings reported by several authors for bovine bulk milk (Formaggioni et al. Reference Formaggioni, Malacarne, Summer, Fossa and Mariani2001; De Marchi et al. Reference De Marchi, Dal Zotto, Cassandro and Bittante2007; Toffanin et al. Reference Toffanin, De Marchi, Penasa, Pretto and Cassandro2012). Besides typical MCP, the IAC has been introduced here as a new standardised index to summarise RCT and a 30, giving them the same arbitrary weight of 50%. Values of IAC greater than 100 are desirable as they indicate overall favourable values of MCP. This index could be adopted by dairy industry and introduced in payment systems to reward or penalise milk according to its coagulation properties (Penasa et al. Reference Penasa, De Marchi, Ton, Ancilotto and Cassandro2015).
Table 1. Descriptive statistics of milk quality and coagulation properties

† TA, titratable acidity; SCS, somatic cell score, calculated as SCS = 3 + log2(SCC/100 000), where SCC is somatic cell count (n/ml); LBC, log of bacterial count, calculated as LBC = log10(BC), where BC is bacterial count (n/ml); RCT, rennet coagulation time; k20 = curd-firming time; a30 = curd firmness; IAC, index of milk aptitude to coagulate, defined as IAC = 100 + (a30 – meana30)/sda30 * 2·5 – (RCT – meanRCT)/sdRCT * 2·5
Phenotypic correlations
Pearson correlations of MCP and IAC with quality traits were generally low and comprised between −0·34 (k20 and casein content and k20 and protein content) and 0·30 (a30 and TA) (Table 2). The relationships of a30 with RCT and k20 were −0·71 and −0·83, respectively, and the correlation between RCT and k20 was moderately low (0·32). All correlations were statistically significant (P < 0·001) except for the relationships between RCT and fat content, and LBC and TA (Table 2). Overall, results confirmed the favourable relationship of protein and casein contents with MCP, and between milk acidity and MCP. Moreover, the phenotypic correlations estimated in the present study were generally lower than those estimated in the literature using individual cow milk samples (e.g. Cassandro et al. Reference Cassandro, Comin, Ojala, Dal Zotto, De Marchi, Gallo, Carnier and Bittante2008; Tiezzi et al. Reference Tiezzi, Pretto, De Marchi, Penasa and Cassandro2013), probably due to the lower variability of bulk milk compared with individual cow samples.
Table 2. Pearson correlations between milk quality and coagulation properties

† TA = titratable acidity; SCS, somatic cell score, calculated as SCS = 3 + log2(SCC/100 000), where SCC is somatic cell count (n/ml); LBC, log of bacterial count, calculated as LBC = log10(BC), where BC is bacterial count (n/ml); RCT, rennet coagulation time; k20 = curd-firming time; a30 curd firmness; IAC, index of milk aptitude to coagulate, defined as IAC = 100 + (a30 – meana30)/sda30 * 2·5 – (RCT – meanRCT)/sdRCT * 2·5.
***P < 0·001.
Ikonen et al. (Reference Ikonen, Morri, Tyrisevä, Ruottinen and Ojala2004) estimated values of −0·87 between RCT and a30, and Formaggioni et al. (Reference Formaggioni, Malacarne, Summer, Fossa and Mariani2001) obtained correlations of 0·66 between RCT and k20, and −0·89 between k20 and a30. Phenotypic relationships of IAC with RCT (−0·93) and a30 (0·92) were in agreement with findings of Penasa et al. (Reference Penasa, De Marchi, Ton, Ancilotto and Cassandro2015). These high estimates were expected because RCT and a30 are used to compute the IAC.
The correlations of TA with RCT, k20 and a30 were −0·21, −0·24 and 0·30, respectively (Table 2). These values were lower than estimates reported by Formaggioni et al. (Reference Formaggioni, Malacarne, Summer, Fossa and Mariani2001) and Malacarne et al. (Reference Malacarne, Summer, Franceschi, Mariani and Fieni2004) using bulk milk from Italian Holstein-Friesian cows, and they were in agreement with results of Cassandro et al. (Reference Cassandro, Comin, Ojala, Dal Zotto, De Marchi, Gallo, Carnier and Bittante2008) and Toffanin et al. (Reference Toffanin, De Marchi, Lopez-Villalobos and Cassandro2015) on individual milk of Italian Holstein-Friesian cows. These authors reported correlations from −0·18 to −0·63 between TA and RCT, and TA and k20, and from 0·41 to 0·85 between TA and a30.
Analysis of variance
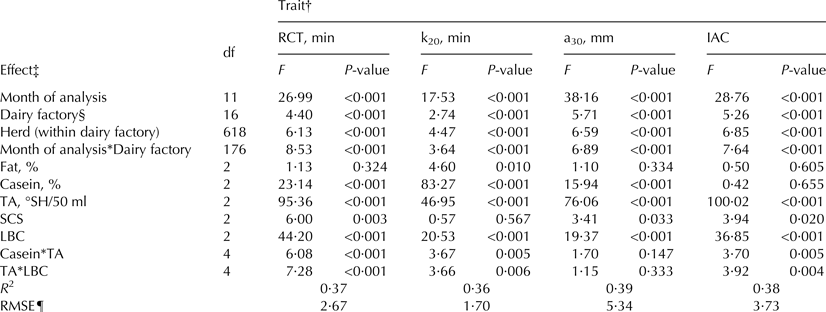
Results from the analysis of variance for MCP and IAC are summarised in Table 3. The coefficient of determination ranged from 0·36 (k20) to 0·39 (a30), indicating that more than 50% of the total variance could not be explained by factors included in the statistical model. All effects were significant (P < 0·05) in explaining the variation of MCP and IAC, with the exception of fat content for RCT, a30 and IAC, SCS for k20, the interactions between casein content and TA, and TA and LBC for a30, and casein content for IAC (Table 3).
Table 3. Results from ANOVA for milk coagulation properties

† RCT, rennet coagulation time; k20 = curd-firming time; a30 = curd firmness; IAC, index of milk aptitude to coagulate, defined as IAC = 100 + (a30–meana30)/sda30 * 2·5 – (RCT – meanRCT)/sdRCT * 2·5.
‡ TA, titratable acidity; SCS, somatic cell score, calculated as SCS = 3 + log2(SCC/100 000), where SCC is somatic cell count (n/ml); LBC, log of bacterial count, calculated as LBC = log10(BC), where BC is bacterial count (n/ml).
§ Tested on herd within dairy cooperative variance.
¶ RMSE = root mean square error.
Effect of dairy factory and season on MCP
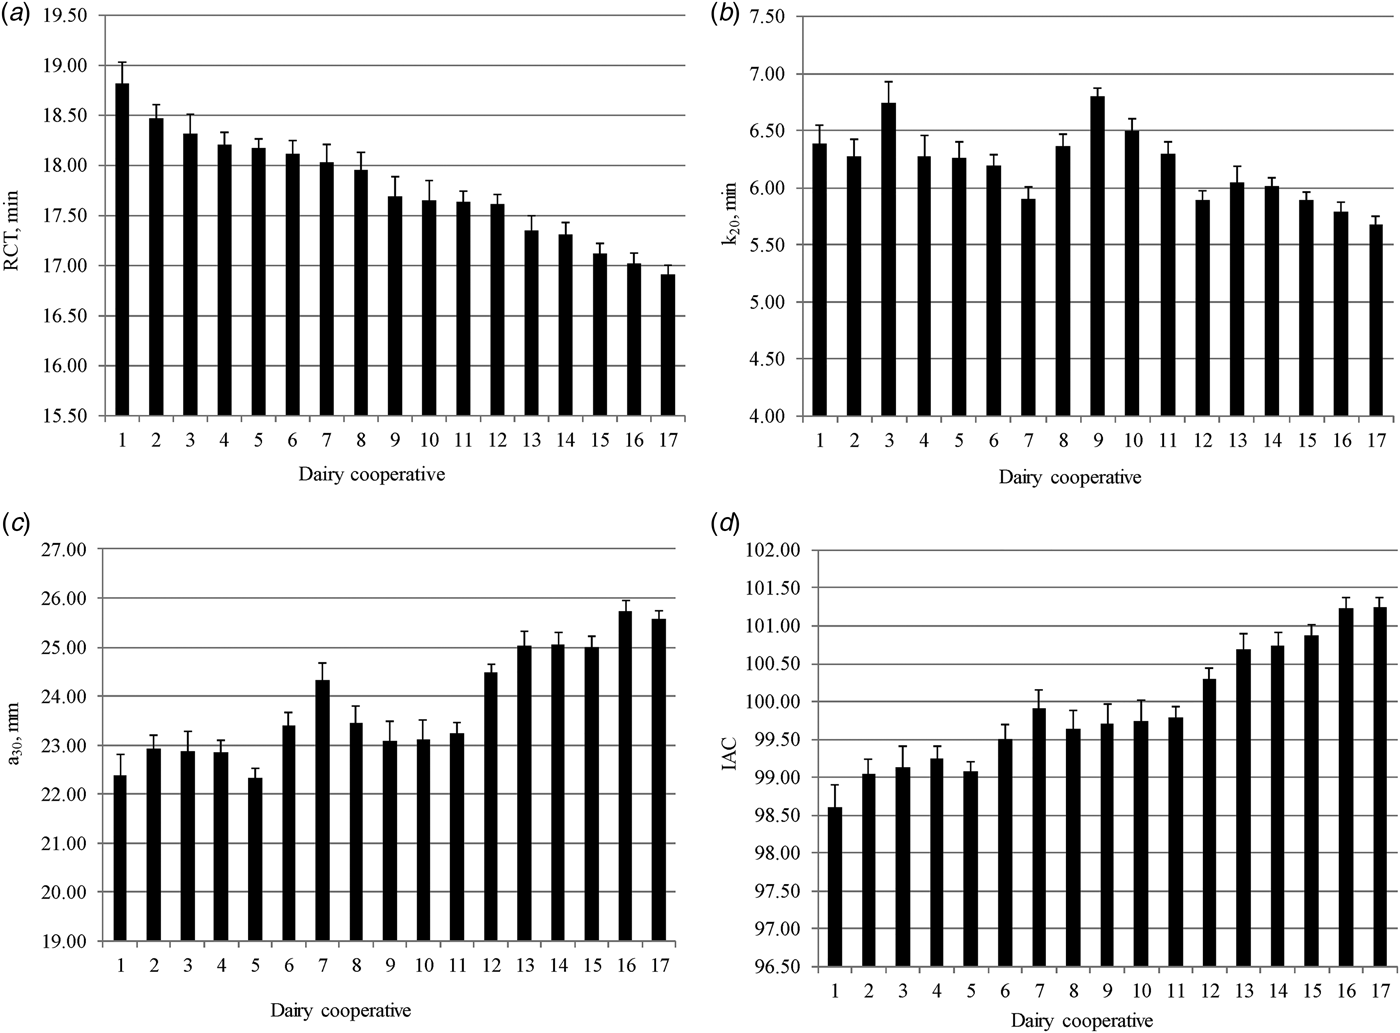
Least squares means of MCP and IAC across dairy cooperatives are displayed in Fig. 2. Rennet coagulation time, k20 and a30 ranged from 16·9 to 18·9 min, 5·70 to 6·90 min, and 22·3 to 25·7 mm, respectively. Regarding the IAC, values varied from 98·6 to 101·2. These findings indicated that dairy factories differed considerably in MCP and this could have positive consequences on cheese yield (Bynum & Olson, Reference Bynum and Olson1982; Pretto et al. Reference Pretto, De Marchi, Penasa and Cassandro2013). About 90% of milk produced in Trevento province is transformed by local dairies, and thus MCP are of great importance. Differences among dairy factories in terms of MCP and IAC are probably related to specific characteristics of the dairy technologies (e.g. natural whey starter, cheese-maker skills) and farms conferring milk to each dairy plant. Sturaro et al. (Reference Sturaro, Marchiori, Cocca, Penasa, Ramanzin and Bittante2013) grouped dairy farms of the province in four different dairy systems, from traditional to intensive. Dairy factories are located in several valleys of the territory and are characterised by different number of associated herds and milk transformed per day (Cologna et al. Reference Cologna, Tiezzi, De Marchi, Penasa, Cecchinato and Bittante2010). Moreover, the average size, breed composition, and milk yield and quality of associated herds largely differ among dairy factories.

Fig. 2. Least squares means (with standard errors) of (a) rennet coagulation time (RCT, min), (b) curd-firming time (k20, min), (c) curd firmness (a30, mm), and (d) index of milk aptitude to coagulate (IAC) across dairy factories.
Overall, least squares means of MCP and IAC were more favourable from October to March and a deterioration of milk coagulation ability was observed during the summer season (results not shown). The best month of analysis was March (IAC = 101) and the worst was July (IAC = 98). A very limited number of studies investigated the effect of season on MCP using bulk milk samples. De Marchi et al. (Reference De Marchi, Dal Zotto, Cassandro and Bittante2007) reported worst values of MCP during warm periods, which underlines a relationship between high temperature and worsening of MCP. Several other studies included the season effect in the statistical analysis of MCP recorded at individual cow level (Tyrisevä et al. Reference Tyrisevä, Ikonen and Ojala2003; Malacarne et al. Reference Malacarne, Fieni, Tosi, Franceschi, Formaggioni and Summer2005). In particular, Malacarne et al. (Reference Malacarne, Fieni, Tosi, Franceschi, Formaggioni and Summer2005) observed that milk of Holstein cows collected during summer was characterised by scarce technological quality.
Effect of milk casein content and titratable acidity on MCP
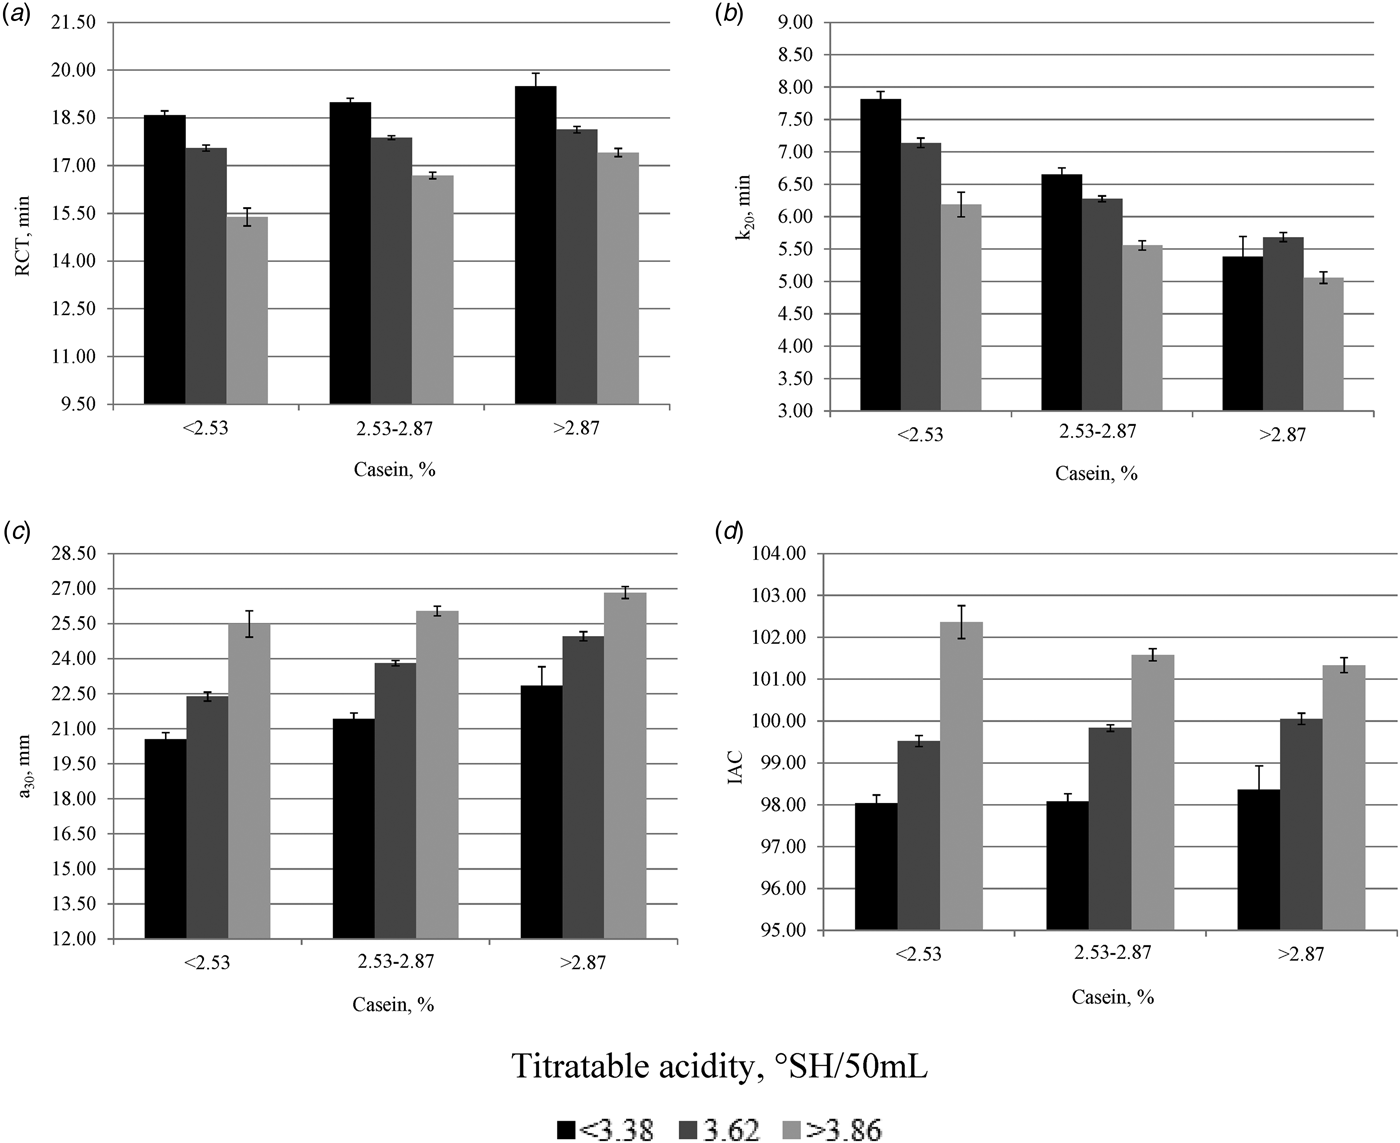
Least squares means of RCT, k20, a30 and IAC for the interaction effect between casein content and TA of milk are reported in Fig. 3. Regardless the class of casein content, RCT decreased and a30 increased with increasing values of TA. As a consequence, the IAC showed better values with high values of TA. Curd-firming time resembled the same trend of RCT, with the only exception of values reported in the third class of casein content (>2·87%). These findings confirm the central role exerted by the acidity of milk on technological traits. Regardless the class of TA, RCT and a30 increased with increasing values of casein content, whereas an opposite trend was observed for k20.

Fig. 3. Least squares means (with standard errors) of (a) rennet coagulation time (RCT, min), (b) curd-firming time (k20, min), (c) curd firmness (a30, mm), and (d) index of milk aptitude to coagulate (IAC) across classes of casein content and titratable acidity of milk.
The link between TA and MCP originates from the capacity of TA to influence the aggregation rate of para-casein micelles, the reactivity of rennet and the rate of syneresis (Formaggioni et al. Reference Formaggioni, Malacarne, Summer, Fossa and Mariani2001). Decreasing values of RCT and k20 following increasing TA were reported by De Marchi et al. (Reference De Marchi, Dal Zotto, Cassandro and Bittante2007) and Toffanin et al. (Reference Toffanin, De Marchi, Penasa, Pretto and Cassandro2012) in bulk milk. Concerning casein content, different studies showed a strong and significant relation with MCP, especially with a30, both in bulk (De Marchi et al. Reference De Marchi, Dal Zotto, Cassandro and Bittante2007; Toffanin et al. Reference Toffanin, De Marchi, Penasa, Pretto and Cassandro2012) and individual cow milk samples (Politis & Ng-Kwai-Hang, Reference Politis and Ng-Kwai-Hang1988; Tyrisevä et al. Reference Tyrisevä, Ikonen and Ojala2003; Penasa et al. Reference Penasa, Cassandro, Pretto, De Marchi, Comin, Chessa, Dal Zotto and Bittante2010).
Conclusions
The present study was conducted on a large bulk milk data with the purpose of investigating sources of variation of MCP in field conditions. In particular, we estimated the effects of dairy factory, milk casein content and TA on the clotting characteristics of milk and on IAC, an index summarising RCT and a30. Rennet coagulation time of milk from the best dairy factory was 2 min shorter than that of the worst dairy factory. In terms of a30 and IAC, the difference between the best and the worst dairy factory was 3·4 mm and 2·6 points, respectively. These findings reflect the large variety of environmental and rearing conditions of the dairy sector in Trento province. Besides dairy factory, milk casein content and TA were important factors in explaining the variation of MCP and IAC, supporting their central role on technological traits.
The authors thank the milk laboratory of the ‘Trentingrana – Consorzio dei Caseifici Sociali Trentini s.c.a’ (Trento, Italy) for providing data used in the present study.
Authors’ contribution
V. Toffanin and M. Penasa wrote the first draft of the manuscript. M. Penasa performed statistical analysis. N. Cologna, M. Cassandro and M. De Marchi reviewed the paper. All authors contributed to the discussion of the results and approved the final version of the manuscript.


