Use of milk flow measurements as a signal for termination of ongoing milking was first tested by Armstrong et al. (Reference Armstrong, Bickert, Gerrish and Spike1970) and has since become the standard procedure in many milking systems. The milk flow curve has four distinct phases; the increase phase, the plateau phase, the decline phase and the over-milking phase (Tančin et al. Reference Tančin, Ipema, Hogewerf and Mačuhová2006). At the start of milking, during the increase phase, milk flow increases rapidly and may sometimes show an unwanted bimodal pattern. When milk flow has stabilised the plateau phase is reached, where the harvested milk yield increases steadily at a constant rate. During the decline phase, milk flow decreases rapidly while milk yield increase rate declines. Finally, when milk flow rate has decreased to 0·075 kg/min per udder quarter, equivalent to 0·3 kg/min for the whole udder, the over-milking phase is reached (Tančin et al. Reference Tančin, Ipema, Hogewerf and Mačuhová2006). During this phase, the milk flow from the alveoli to the cistern is lower than the milk flow from the cistern through the teat (Rasmussen, Reference Rasmussen2004). When milking is performed at udder level rather than quarter level, the decline phase of milking often begins when milk flow from an individual quarter has ceased completely (Tančin et al. Reference Tančin, Ipema, Hogewerf and Mačuhová2006). This causes one or more quarters to reach the over-milking phase while the udder as a whole is still in the decline phase of milking. Over-milking can increase the risk of bacteria influx into the teat (Natzke et al. Reference Natzke, Everett and Bray1982; Rasmussen, Reference Rasmussen2004) and cause damage to the teat end (Neijenhuis et al. Reference Neijenhuis, Barkema, Hogeveen and Noordhuizen2000). Tančin et al. (Reference Tančin, Ipema, Hogewerf and Mačuhová2006) found that the milk harvested from the declining phase of milking accounts for 26% of the total yield, and that the time allocated for the declining phase comprises 38% of the total milking time if take-off is performed at 0·3 kg/min.
Rasmussen (Reference Rasmussen1993) tested cluster take-off at 200 and 400 g/min and found that the increased level shortened machine-on-time by 0·5 min, improved teat condition and did not affect milk yield. Similar results were reported by Jago et al. (Reference Jago, Burke and Williamson2010), who found that increasing the take-off level from 200 to 400 g/min decreased milking time by approximately 0·7 min. Edwards et al. (Reference Edwards, Jago and Lopez-Villalobos2013) tested four different cluster removal thresholds (200, 400, 600 and 800 g/min) and found that machine-on time was reduced by up to 29% using 800 g/min compared with 200 g/min. Strip yield was higher using 800 compared with 200 or 400 g/min, but milk yield and composition did not differ. Reduced machine-on time was also seen with take-off level settings at 800 g/min compared to 480 and 600 g/min by Magliaro & Kensinger (Reference Magliaro and Kensinger2005), but they found that milk yield was significantly decreased when the higher take off level at 800 g/min was used. Clarke et al. (Reference Clarke, Cuthbertson, Greenall, Hannah, Jongman and Shoesmith2004) showed that milking time could be decreased further by combining a higher take-off threshold (500 g/min) with pre-stimulation in slow-milking cows, while Burke & Jago (Reference Burke and Jago2011) found that an increased take-off threshold (400 g/min) decreased milking duration by 11%, increased post-milking strip yield and decreased production slightly, by 1%. In contrast, Stewart et al. (Reference Stewart, Godden, Rapnicki, Reid, Johnson and Eicker2002) found increasing milk yield with increased take-off threshold on two of five farms. It has been suggested that increasing the take-off threshold might increase the risk of mastitis or high cell counts, but this has been disproved by e.g. Burke & Jago (Reference Burke and Jago2011), Rasmussen (Reference Rasmussen1993) and Edwards et al. (Reference Edwards, Jago and Lopez-Villalobos2013). Jago et al. (Reference Jago, Burke and Williamson2010) found higher somatic cell counts (SCC) when a take-off threshold of 400 g/min was applied, but inconclusive evidence of a true effect.
It has been well demonstrated that there are factors in milk that act locally and reduce milk synthesis during milk stasis in the gland (Peaker & Wilde, Reference Peaker and Wilde1996; Hernandez et al. Reference Hernandez, Wheelock, Shwartz, Baumgard, Parkhurst and Collier2007, Reference Hernandez, Collier, Vomachka, Collier and Horseman2011). By increasing udder emptying (Knight, Reference Knight1994), it is possible to reduce milk stasis and thereby increase milk yield. The udder emptying degree depends mainly on the efficacy of milk ejection. Milk ejection in turn depends on a number of different factors, such as milker (Rushen et al. Reference Rushen, de Passillé and Munksgaard1999), pre-stimulation and feeding during milking (Johansson et al. Reference Johansson, Uvnäs-Moberg, Knight and Svennersten-Sjaunja1999). Feeding during milking increases the release of oxytocin from the pituitary gland (Svennersten et al. Reference Svennersten, Gorewit, Sjaunja and Uvnäs-Moberg1995) and can therefore elicit stronger milk ejection, which reduces the amount of residual milk. Furthermore, oxytocin also stimulates prolactin secretion (Kennett et al. Reference Kennett, Poletini, Firch and Freeman2009), and the prolactin release during milking is of importance to maintain milk synthesis (Lacasse et al. Reference Lacasse, Lollivier, Dessauge, Bruckmaier, Ollier and Boutinaud2012; Lollivier et al. Reference Lollivier, Lacasse, Arizala, Lamberton, Wiart, Portanguen, Bruckmaier and Boutinaud2015).
Milk fat globules (MFG) comprise a triglyceride core surrounded by the milk fat globule membrane (MFGM), which consists of proteins, enzymes and lipids. γ-glutamyl transpeptidase is one of the enzymes present in MFGM and can be used to estimate the amount of membrane material. The activity of γ-glutamyl transpeptidase has been found to decrease when MFG size increases (Wiking et al. Reference Wiking, Stagsted, Björck and Nielsen2004). The size of MFG increases together with fat content during milking (Kernohan & Lepherd, Reference Kernohan and Lepherd1969), and the majority of the largest MFG are found in residual milk, while the majority of the smallest are found in fore-milk. It has been shown that MFG size is correlated to daily fat yield and to the concentration of C18:0 and C18:1 in milk (Timmen & Patton, Reference Timmen and Patton1988; Wiking et al. Reference Wiking, Stagsted, Björck and Nielsen2004). Wiking et al. (Reference Wiking, Stagsted, Björck and Nielsen2004) also found a correlation with C16:0 and C16:1, while Timmen & Patton (Reference Timmen and Patton1988) found connections with C4:0-C10:0, which were elevated in large MFG. Large MFG have also been shown to be more susceptible to lipolysis than smaller MFG (Wiking et al. Reference Wiking, Björck and Nielsen2003; Wiking, Reference Wiking2005), most likely due to lack of available membrane material (Wiking et al. Reference Wiking, Stagsted, Björck and Nielsen2004).
The within-day variation in milk fatty acid composition is usually low (Larsen et al. Reference Larsen, Weisbjerg, Kristensen and Mortensen2012), but it can be altered by different management practices. Svennersten & Barrefors (Reference Svennersten and Barrefors1991) found that the fatty acid composition of milk differed between quarters when local stimulation through hand milking was applied to one out of four quarters for 21 consecutive days. They found an increase in proportion of C6-C14 and a decrease in C18-18:3 during evening milkings in the quarters where hand milking was applied. No differences were found in amount of residual milk.
The aim of the present study was to investigate how milking efficiency, milk composition and yield, milk fatty acid composition, milk fat globule size distribution and free fatty acid content are affected by elevated take-off level and feeding during milking, separately and in combination.
Materials and methods
The study was conducted at the Swedish Livestock Research Centre, Uppsala, Sweden, and all animal handling was approved by the local Animal Ethics Committee.
Animals and housing
The study included 32 Swedish Red cows with average lactation number 1·8 ± 1, 145 ± 51 d in milk (DIM) and producing 30·4 ± 7·3 kg milk per day. All cows included had SCC < 100 000 cells/ml at the start of the study. They were housed in a loose housing system (DeLaval FeedFirst™) with concrete floor aisles and rubber mats and chopped straw bedding in cubicles. Water and silage were provided ad libitum and concentrate was provided in a ration based on milk yield according to the NorFor system (Volden, Reference Volden2011).
Experimental design
Cows were allocated into four groups balanced according to lactation number, lactation stage and milk yield, and subjected to a 2 × 2 factorial arrangement of treatments in a 4 × 4 Latin square design. In order to obtain representative results four multiparous and four primiparous cows with similar average milk yield and similar lactation stage were included in each experimental group. To counteract carry over effects the design was arranged so that the treatments were assigned in different order to the different groups. The treatments were high (H, threshold flow: 800 g milk/min) or low (L, 200 g milk/min) cluster take-off level, combined with feeding during milking (+) or no feeding during milking (−). Take-off was based on whole udder level and feeding during milking was used to improve stimulation of milk let-down. No more than 2 kg of concentrate per cow and milking was supplied during the treatments with feeding during milking, and the amount fed was deducted from the daily ration for each cow. Each treatment period was 7 d long and measurements were made during the last 3 d of each period. Milk yield, peak and average flow, milking interval and milking time were automatically recorded by the DelPro™ system (DeLaval International AB, Tumba, Sweden) for each cow during each milking throughout the whole experiment, and data from the last 3 d of each treatment period were used for evaluation of treatment effects.
Two cows were replaced after the first treatment period, one due to incomplete milkings and one due to circumstantial disturbance of the cow traffic. During the fourth treatment period, a corona virus infection affected the herd and the treatments were therefore interrupted. After all symptoms of infection had disappeared, at around 7 d, the treatment from the third treatment period was applied again, before the treatment from the fourth period was repeated.
Milking was performed in an automatic milking system (DeLaval VMS™ Voluntary Milking System), with vacuum level 44 kPa, pulsation rate 60 cycles/min and pulsation ratio 65:35. Take-off was performed on whole udder level according to the treatment applied. Milking permission was granted by the milking system after 6 h and cows were brought to the waiting area when the milking interval exceeded 8 h. The average milking interval was 9·1 ± 1·6 h for the study as a whole.
Milk sampling and storage
During the last 3 d (day 5, 6 and 7) of each treatment period, milk samples were collected from each milking of all cows. Samples from all 3 d were analysed for fat, protein and lactose content, and SCC. Additional samples were collected from two milkings of all cows during days 6 and 7 and analysed for sodium and potassium content. From 24 of the cows (6 cows per group), additional samples were collected from one milking during day 6 and one milking during day 7 for analysis of MFG size distribution, MFGM stability, FFA content and fatty acid composition. In addition, 16 of these 24 cows were subjected to residual milk removal after the last milking in the treatment period. Residual milk was harvested through intramuscular injection of 25 IU oxytocin directly after milking. Milking was initiated again 3 min after the injection, using a bucket milking machine.
Samples for milk composition and SCC analysis were preserved with bronopol (2-bromo-2-nitropropane-1·3-diol, VWR International AB, Stockholm, Sweden) and kept at 4 °C until analysis within 5 d. Samples for Na, K, MFG size and stability analysis were kept at 4 °C until analysis, and samples for analysis of FFA and fatty acid composition were frozen 46–50 h after collection and kept at −20 °C until analysis.
Milk analysis
Milk composition (fat, protein and lactose content) was analysed using mid-infrared spectroscopy (Fourier Transform Instruments, FT 120, Foss, Hillerød, Denmark) and milk SCC was determined using fluorescence-based cell counting (Fossomatic 5000, Foss, Hillerød, Denmark).
To determine the FFA content, a variation of the method devised by Deeth et al. (Reference Deeth, Fitz-Gerald and Wood1975) was used. The method involves extraction of milk with a mixture of two solvents (isopropanol:hexane:4NH2SO4, 40:10:1, and hexane) to separate the fat. The fat released was titrated with 0·002 N methanolic KOH and phenol red as indicator.
Fatty acid composition was analysed according to Shingfield et al. (Reference Shingfield, Ahvenjarvi, Toivonen, Arola, Nurmela, Huhtanen and Griinari2003) using gas chromatography (CP 3800, Varian, Walnut Creek, CA) with helium as carrier gas and a flame ionisation detector. Prior to gas chromatography, the milk was extracted with diethyl ether and hexane and gravimetric determination of the fat was conducted using microbalance (UMT2 ultramicro, Mettler-Toledo, AG Grifensee, Switzerland). Finally, the samples were trans-esterified to methyl esters using methanolic sodium methoxide.
The size distribution of MFG was analysed by integrated light scattering using a Mastersizer 2000 (Malvern Instruments Ltd., Malvern, UK) according to Wiking et al. (Reference Wiking, Stagsted, Björck and Nielsen2004). The activity of the MFGM protein γ-glutamyl transpeptidase was examined as described by Wiking et al. (Reference Wiking, Stagsted, Björck and Nielsen2004).
Data analysis
The data were analysed by ANOVA for a 4 × 4 Latin square with a 2 × 2 factorial arrangement of treatments in a linear mixed-effects model in the statistical software R (r-project.org). The model included the fixed effects of period, lactation number, DIM, sample type (available or residual milk), take-off level, feeding and their interaction, and a random effect of cow. Milk fatty acid composition was analysed by MANOVA for a 4 × 4 Latin Square with a 2 × 2 factorial arrangement of treatments with a model that included the fixed effects of period, lactation number, DIM, take-off level, feeding and their interaction.
Data on sodium concentration, milking time, FFA content and SCC were natural log (ln)-transformed prior to analysis due to non-normal distribution.
Values presented are LsMean ± SE unless otherwise stated. Treatment effects were declared significant at P ≤ 0·05.
Results
Milk yield, composition and flow
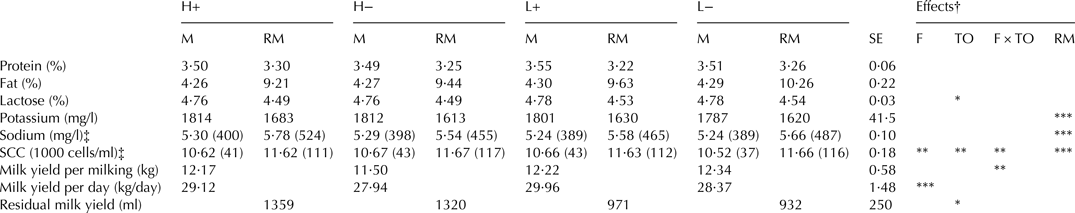
Milk yield per 24-h period increased with feeding during milking (P < 0·001, Table 1). SCC was low for all treatments, but increased with higher take-off level and with feeding during milking (P < 0·01 and P < 0·01, respectively). The lowest SCC (37 000 cells/ml) was found in the low take-off, no feeding treatment (L−) (P < 0·01). Though still low, SCC was higher in residual milk compared with available milk.
Table 1. Milk yield and composition for cows with high (H, 800 g/min) or low (L, 200 g/min) take-off level, with (+) or without (−) concentrate feeding during milking. Values presented are LSMean with standard error (SE)

M, available milk; RM, residual milk
Asterisks indicate level of significance ***P < 0·001, **P < 0·01, *P < 0·05
† Significance of the effects of feeding (F), take-off (TO), their interaction (F × TO) and milk type (RM)
‡ ln-transformed, antilog within brackets
There was also a tendency for an effect of take-off on milk composition, with a high take-off level decreasing the lactose content (P < 0·05) and tending to decrease fat and protein content in the milk (P = 0·06 and P = 0·05, respectively).
The concentrations of sodium and potassium did not differ between treatments. However, the concentration of potassium was lower in residual milk (P < 0·001), while the concentration of sodium was higher in residual milk (P < 0·001).
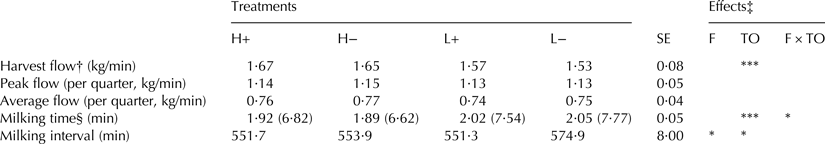
Peak flow was not affected by take-off or feeding but, as expected, average flow was greater when the take-off level was increased (P < 0·05) (Table 2).
Table 2. Milk flow, milking time and milking interval for cows with high (H, 800 g/min) or low (L, 200 g/min) take-off level, with (+) or without (−) concentrate feeding during milking
Values presented are LSMean with standard error (SE)
Asterisks indicate level of significance ***P < 0·001, **P < 0·01, *P < 0·05
† Milk harvested per minute in the milking pen
‡ Significance of the effects of feeding (F), take-off (TO) and their interaction (F × TO)
§ ln-transformed, antilog within brackets
Milking efficiency
Harvest flow (defined as amount of milk harvested per minute in the milking station) was increased by increased take-off level (P < 0·001), Table 2).
Milking time was of course significantly shorter when high take-off was applied (P < 0·001). There was also a significant interaction effect (P < 0·05), which resulted in the shortest milking time with the high take-off, no feeding treatment (H−) and the longest milking time with low take-off, no feeding (L−). Milking interval was shorter with feeding during milking and when high take-off was applied.
High take-off significantly increased the amount of residual milk (P < 0·05), while feeding had no effect (Table 1).
Free fatty acid content
There was a significant interaction effect on the FFA content of milk (P < 0·05), with high take-off + feeding (H+) showing a lower value than the remaining treatments (1·82, 2·34, 2·27 and 1·97 mEq/100 g fat respectively for the treatments H+, H−, L+ and L−). FFA content was also lower in residual milk compared with available milk (1·84 vs. 2·39 mEq/100 g fat, P < 0·001).
Milk fat globule size and membrane material
Milk fat globule size and γ-glutamyl transpeptidase activity in milk did not differ between treatments. However, MFG size was on average larger in residual milk compared with available milk (4·35 vs. 4·13 µm, P < 0·001) and the activity of γ-glutamyl transpeptidase was higher in residual milk (124·0 vs. 108·5 Abs/min, P < 0·001).
Fatty acid composition
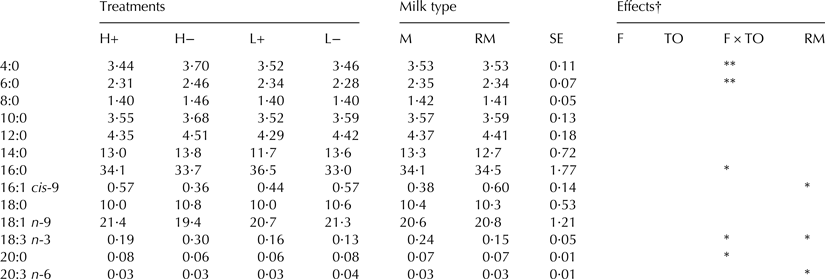
Neither feeding nor take-off level affected fatty acid composition significantly. However, the interaction between feeding and take-off level had a significant effect on milk fatty acid composition in general (P < 0·01), and on the fatty acids C4:0, C6:0, C16:0, C18:3(n-3), C20:0 and C24:0 specifically (Table 3). There was no effect of sample type on general fatty acid composition, but the proportion of C16:1 cis-9 was higher and the proportion of C18:3(n-3) and C20:3(n-6) was lower in residual milk (P < 0·05).
Table 3. Fatty acid composition (g/100 g identified FA) for cows with high (H, 800 g/min) or low (L, 200 g/min) take-off level, with (+) or without (−) concentrate feeding during milking
FA included in the table are those with more than 1/100 g FA or those where treatment had a statistical significant effect. Values presented are LSMean with standard error (SE)
***P < 0·001, **P < 0·01, *P < 0·05
Milk type: M, available milk; RM, residual milk
† Significance of the effects of feeding (F), take-off (TO), their interaction (F × TO) and milk type (RM)
Discussion
Low cluster take-off level (200 g milk/min) did not increase daily milk yield, but resulted in longer milking time. Feeding during milking did not affect milking time, but it did increase milk yield. If the lower take-off had increased milk yield significantly, the increase in yield could theoretically have counteracted the effects of longer milking time on milk production profitability, which was not found in this study. However, feeding seemed to counteract the effects of the low take-off level on milking time and milking interval.
The slight decrease in milk yield with high take-off level (200 g milk/min) was counteracted by feeding during milking. In addition, high take-off increased average flow and harvest flow, and decreased milking interval and milking time, in agreement with previous studies (Rasmussen, Reference Rasmussen1993; Clarke et al. Reference Clarke, Cuthbertson, Greenall, Hannah, Jongman and Shoesmith2004; Magliaro & Kensinger, Reference Magliaro and Kensinger2005; Jago et al. Reference Jago, Burke and Williamson2010; Burke & Jago, Reference Burke and Jago2011; Edwards et al. Reference Edwards, Jago and Lopez-Villalobos2013). By increasing the take-off level, milking time was decreased by around 1 min per milking. In an average automatic milking system with 60 cows which are milked 2·5 times daily, 150 min per day would thus be saved in milking time. Assuming a milking time of 7 min per cow, another eight cows could be milked using the same machine per 24-h period.
The effects on milk yield, milk flow and milking time found in this study were largely expected. Feeding during milking has previously been shown to increase milk yield (Samuelsson et al. Reference Samuelsson, Wahlberg and Svennersten1993; Johansson et al. Reference Johansson, Uvnäs-Moberg, Knight and Svennersten-Sjaunja1999), most likely due to improved milk ejection. However, no increase in udder emptying degree was found from the feeding treatments, indicating a lack of effect of feeding on milk ejection in this study. It is therefore more likely that the effect on milk yield caused by feeding during milking was an effect of increased oxytocin release (Svennersten et al. Reference Svennersten, Gorewit, Sjaunja and Uvnäs-Moberg1995), which in turn might stimulate prolactin secretion (Kennett et al. Reference Kennett, Poletini, Firch and Freeman2009), a hormone of importance for maintenance of lactation. Indeed, the milking related release of prolactin has been observed to be significantly higher when milking was combined with feeding compared to milking alone (Samuelsson et al. Reference Samuelsson, Uvnäs-Moberg, Gorewit and Svennersten- Sjaunja1996). Oxytocin might also act on the secretory processes in the mammary epithelial cells and have an effect on the mammary metabolism as indicated in the review article by Lollivier et al. (Reference Lollivier, Guinard-Flament, Ollivier-Bousquet and Marnet2002).
The effects on milking interval reported in this study should be treated with caution, since milking interval was restricted for the cows included. However, the cows were brought to the waiting area for milking equally often during all treatment periods, and the effects observed could therefore have been slightly underestimated. The longer milking intervals found for the low take-off, no feeding (L−) treatment group was most likely due to lower willingness to enter the automatic milking station. It has previously been shown that feeding during milking increases the willingness of cows to be milked (Prescott et al. Reference Prescott, Mottram and Webster1998) and, in combination with long milkings with slight discomfort, this could have prominent effects on the milking interval.
The take-off level alone had several effects on milk parameters such as milk composition and flow, and affected lactose content in milk. Theoretically, decreased udder emptying during increased take-off should result in a lower fat content of the milk and a higher or equal protein and lactose content, since residual milk has a high fat content and a lower protein and lactose content than available milk (Ontsouka et al. Reference Ontsouka, Bruckmaier and Blum2003). However, fat, protein and lactose content tended to be lower for treatments with high take-off level, contradicting results by Edwards et al. (Reference Edwards, Jago and Lopez-Villalobos2013). There was no effect on milk yield of take-off level alone, but the decreased concentrations could be a sign of a dilution effect. The mechanisms that could have caused such an effect are unclear, however. Although effects on milk composition were seen within the treatment period long-term effects also need to be evaluated, since those effects are of most practical importance.
Feeding during milking affected milk yield, milking interval and SCC in this study. There were also several significant interactive effects of combining feeding and take-off, mainly on milk fatty acid composition. The effect of feeding on milking interval was most likely due to increased willingness in the cows to visit the milking station. With shorter milking intervals and perhaps slightly improved milk ejection, the daily milk yield could be increased. The combination of a high take-off level and no feeding appeared to increase the proportion of C4:0, C6:0, C16:0 and C18:3(n-3). The increase in short-chain fatty acids, C4:0 and C6:0, is in agreement with Svennersten & Barrefors (Reference Svennersten and Barrefors1991), who found a decrease in the proportion of total C6-C14 when stimulation of milk ejection was improved by hand milking. However, they found a decrease in C18:3, which was contradicted by our results. It is unlikely that the treatments applied affected the fatty acid composition of the milk per se. It can be speculated that stimulation of fat secretion or certain enzymes or signalling factors in the milk could affect the proportion of de novo vs. preformed fatty acids in milk, but it is more likely that the differences in fatty acid composition were due to differences in udder emptying degree, as suggested by Svennersten & Barrefors (Reference Svennersten and Barrefors1991). In ewes, Gómez-Cortés et al. (Reference Gómez-Cortés, Bodas, Mantecón, de la Fuente and Manso2011) found that the content of C16:0 and C20:0 was lower in residual milk compared with available milk, which was not supported by our results. Instead, we found that the content of C16:1 cis-9 was higher and the content of C18:3(n-3) and C20:3(n-6) was lower in residual milk. The differences in fatty acid composition between available and residual milk are inconsistent with the larger MFG size observed, since several previous studies have reported higher contents of 16:1 fatty acids in smaller fat globules (Briard et al. Reference Briard, Leconte, Michel and Michalski2003; Lopez et al. Reference Lopez, Briard-Bion, Ménard, Beaucher, Rousseau, Fauquant, Leconte and Robert2011; Rahmatyar & Wiking, Reference Rahmatyar and Wiking2012). However, there seems to be breed differences in how the fatty acid composition varies with MFG size (Rahmatyar & Wiking, Reference Rahmatyar and Wiking2012), and none of the previous studies performed have included Swedish Red cows.
The MFG size and the activity of γ-glutamyl transpeptidase did not differ between treatments, indicating that there was no lack of membrane material causing increased risk of lipolysis due to any of the treatments. However, both MFG size and the activity of γ-glutamyl transpeptidase did differ between available and residual milk, confirming previous findings (Kernohan & Lepherd, Reference Kernohan and Lepherd1969). The larger milk fat globules found in residual milk use less membrane due to the lower volume to surface ratio, but the high fat content in residual milk results in a high activity of MFGM enzymes. The FFA content was also higher in residual milk, as reported previously by Wiking (Reference Wiking2005), who found that the FFA content was higher in milk with higher fat content and larger MFG.
Feeding during milking has been shown previously to increase secretion of oxytocin and prolactin compared with feeding before or after milking (Samuelsson et al. Reference Samuelsson, Uvnäs-Moberg, Gorewit and Svennersten- Sjaunja1996; Johansson et al. Reference Johansson, Uvnäs-Moberg, Knight and Svennersten-Sjaunja1999). As suggested by Ollivier-Bousquet (Reference Ollivier-Bousquet2002), prolactin and oxytocin could also be involved in the secretion and size determination of MFG. This could, in theory, be a possible cause of effects of feeding on MFG size or the activity of γ-glutamyl transpeptidase However, this was not found in the present study.
The concentrations of sodium and potassium in the milk of cows in this study were within the expected physiological levels. However, sodium and potassium concentration both differed between available and residual milk. Ontsouka et al. (Reference Ontsouka, Bruckmaier and Blum2003) investigated the composition of different fractions of bovine milk, including residual milk, and found that the concentrations of both sodium and potassium were higher in residual milk than in available milk. In contrast, we found that the sodium concentration was higher and the potassium concentration lower in residual milk. Increasing sodium and decreasing potassium concentration is regarded as indicating leakage over the blood-milk barrier and loss of tight junction integrity (Stelwagen et al. Reference Stelwagen, Farr, Davis and Prosser1995). However, since this difference was present throughout all treatments applied in the present study, we do not believe that the difference between residual and available milk was a sign of low tight junction integrity.
Conclusions
Increasing the cluster take-off level to 800 g/min on whole udder level decreased milking time and increased harvest flow, as expected. Udder emptying decreased slightly, but there were no effects on milk yield, FFA content or the activity of γ-glutamyl transpeptidase, indicating no loss of milk fat globule stability. There were interactive effects of take-off level and feeding during milking on several fatty acids. Feeding during milking increased milk yield per day and decreased milking interval. Sodium and potassium concentrations in milk were unaffected by treatments, indicating no loss of tight junction integrity.
From these results, it is clear that feeding and cluster take-off level should be managed in combination, as there are significant interactions between these two factors. Feeding should be used to increase milk yield and improve milking efficiency, regardless of take-off level used, but our results indicated that the effect of feeding is more pronounced when a low take-off level is used. Feeding seemed to counteract the effects of low take-off level on milking time and milking interval. Low take-off levels should therefore be used in combination with feeding.
The authors wish to acknowledge the Swedish Farmers’ Foundation (SLF) for funding the study and DeLaval International AB for technical assistance and advice.