


Milk fat functions as an important energy source for the neonate and suckling calf. Lipid and protein components of milk also have various nutritional benefits that extend to consumers (Thorning et al., Reference Thorning, Raben, Tholstrup, Soedamah-Muthu, Givens and Astrup2016). Milk lipids are enveloped by a membrane made of polar lipids and proteins. This method of lipid packaging and secretion is unique to the lactating mammary gland (McManaman, Reference McManaman2012). The resulting structure is called the milk fat globule (MFG) and comprises a neutral lipid core surrounded by a trilayer membrane (Fox and Kelly, Reference Fox, Kelly and Simpson2012). The MFG membrane contains bioactive compounds with noted health benefits (Singh and Gallier, Reference Singh and Gallier2017), and small MFG deliver more of this beneficial membrane material due to an increased surface area. A variety of sizes of MFG are found in milk, ranging from <1 µm to over 10 µm (Michalski et al., Reference Michalski, Briard and Michel2001). In addition to its variation between different breeds and species (Carroll et al., Reference Carroll, DePeters, Taylor, Rosenberg, Perez-Monti and Capps2006), MFG size distribution can be affected by stage of lactation (Evers, Reference Evers2004) and nutrition (Couvreur et al., Reference Couvreur, Hurtaud, Marnet, Faverdin and Peyraud2007). Furthermore, MFG size distribution can vary between individual cows (Logan et al., Reference Logan, Auldist, Greenwood and Day2014).
Amongst the physiological variables, stage of lactation is negatively correlated to MFG size, with a decrease in size with ongoing lactation in bovine milk (Altenhofer et al., Reference Altenhofer, Holzmüller, Wolfertstetter, Ribeiro, Kulozik, Pfaffl and Viturro2015; Fleming et al., Reference Fleming, Schenkel, Chen, Malchiodi, Ali, Mallard, Sargolzaei, Corredig and Miglior2017). The role of milk production traits is more equivocal in the literature, however, recent evidence suggests that fat-protein ratio and fat content are positively related to MFG size (Martini et al., Reference Martini, Altomonte, Bortoluzzi Moro, Caneppele and Salari2016; Couvreur and Hurtaud, Reference Couvreur and Hurtaud2017). Possible environmental determinants of MFG size are season and diet. For example, rations with a high-concentrate-to-low-forage ratio have been shown to result in smaller average MFG sizes compared to a low-concentrate-to-high-forage diet (Mesilati-Stahy et al., Reference Mesilati-Stahy, Moallem, Magen and Argov-Argaman2015). Several studies also suggested that MFG size is subject to seasonal changes, however, the reported effects are often conflicting, mainly because the results are confounded by the association of season with nutrition in pasture fed herds, and with stage of lactation in herds that practise seasonal calving. Fleming et al. (Reference Fleming, Schenkel, Chen, Malchiodi, Ali, Mallard, Sargolzaei, Corredig and Miglior2017) reported larger average MFG in spring compared to the rest of the year, whereas Logan et al. (Reference Logan, Auldist, Greenwood and Day2014) showed the opposite with smaller MFG in spring than in autumn. However, in the study by Fleming et al. (Reference Fleming, Schenkel, Chen, Malchiodi, Ali, Mallard, Sargolzaei, Corredig and Miglior2017) management practices and nutrition of the studied herds were unknown and Logan et al. (Reference Logan, Auldist, Greenwood and Day2014) used a herd practising seasonal calving. Others have reported no effect of season on MFG size in goats (Salari et al., Reference Salari, Altomonte, Ribeiro, Ribeiro, Bozzi and Martini2016).
This study examines on-farm and physiological determinants of MFG size, including a broad range of animal and milk production measurements. The MFG size distribution was measured on four sampling days over a one-year period, with one sampling day in each season.
Materials and methods
Animals and nutritional management
The animals used in this study are part of the herd at the University of Melbourne Dookie Dairy in northern Victoria, Australia (latitude 36°25′31.3″S, longitude 145°42′36.6″E). The farm consists of 0.41 km2 of border-check flood irrigated pasture, divided in three grazing areas and a feed pad. Pastures are predominantly perennial ryegrass (Lolium perenne) and white clover (Trifolium repens). The herd consists of approximately 145 Holstein-Friesian cows, aged between 1.65 and 7.86 years. The cows calve at variable times throughout the year. During the year of this study, 55 of the cows had calved in autumn (32.4%), 55 (32.4%) in winter, 41(24.1%) in spring and 19 (11.1%) in summer. The cows are milked by an automatic milking system (Lely Astronaut; Lely, Maassluis, The Netherlands). They enter the dairy voluntarily for milking and milking is performed with automatic cup attachment through a laser-based teat detection system as part of the robotic arm. The cows' diet consists of concentrates (cereal grain-based pellets) and ad libitum pasture, as well as silage and hay when there is insufficient pasture to meet the herd's nutritional requirements. The concentrate (Optimilk Lacta Max, Rivalea Australia – Stockfeeds, Corowa NSW, Australia) is fed during milking in the robot (Lely Astronaut) and cows can finish their individually allocated feed in a feeding station (Lely Cosmix) after milking. Information about the metabolisable energy value of pasture, silage and hay and the calculations used to determine concentrate allowance for each individual cow are provided in the Supplementary File.
Milk Sampling
A total of 274 milk samples from 140 individual cows were taken during the afternoon milking period (13.00 to 18.00) using an automatic sampling system (Lely Shuttle) which samples an aliquot (20 ml) of the entire milking volume. Samples were transported to the laboratory and stored on ice and analysed for MFG size the next day. Sampling was performed once per season over a period of one year, resulting in four sampling times (T), with T1 in winter (n = 51 cows), T2 in spring (n = 54), T3 in summer (n = 95) and T4 in autumn (n = 74). This resulted in sampling frequencies between one and three times for each cow. The year-round calving pattern within our herd allowed us to study the effect of stage of lactation independently from season. Therefore, the effect of nutritional variables such as diet on a whole-herd level and concentrate intake of individual animals were also included to estimate the true effects of seasonal variation on MFG size. The analysis only includes milk samples from cows with a minimum of 10 d in milk (DIM).
Recording of animal and production traits
All variables except MFG size (milk yield (kg), DIM, concentrate intake (kg), number of milkings, parity, fat indication (%), protein indication (%), days pregnant, rumination minutes, somatic cell count, weight (kg), age (years) and concentrate per 100 kg of milk) were recorded by the T4C software (Lely), which is the operating system for the Lely Astronaut automatic milking systems. Furthermore, fat yield and fat:protein ratios were calculated based on these variables. This saved data was used to calculate averages for a period of seven days prior to sampling, which was chosen as an appropriate timeframe to allow variables such as a change in diet or temperature to be reflected in MFG size measurements. For cow weight the maximum value recorded during the seven days prior to MFG size analysis was used because cows frequently step outside the balance area, leading to outliers below their actual weight. DIM and age represent the values on the day of sampling. Minimum and maximum temperatures were defined as the lowest and highest recorded temperatures during the seven days prior to sampling. Local weather data was obtained from the University of Melbourne Dookie Campus weather station (latitude E36°23′05.8″S, longitude 145°42′51.2″E) (Anonymous, 2018). Average feed composition was calculated daily for the whole herd and is described in the Supplementary File.
MFG size analysis
The distribution of MFG size was measured as previously described (Logan et al., Reference Logan, Auldist, Greenwood and Day2014). Briefly, fresh milk samples were diluted 1:1 with 35 mM EDTA, pH 7.0 to dissociate casein micelles and the MFG size distribution was analysed by dynamic light scattering using a Mastersizer 2000 (Malvern Instruments, Malvern, UK). The obscuration rate was kept between 12 to 15% and globule and water refractive indices were estimated as 1.46 and 1.33, respectively. The volume-weighted mean diameter D 4,3 was used as the measure for particle size distribution in this study.
Statistical analysis
Statistical analysis was performed using GenStat statistical analysis software (GenStat for Windows 16th Edition, VSN International, Hemel Hempstead, UK). Linear mixed models were fitted to predict the single variable effects of each measured variable. This analysis identified ten potential explanatory variables that also had a statistically significant effect on MFG size (P < 0.05, Tables S1 and S2, online Supplementary File). The variables with significant effects on MFG size included five milk production traits (milk yield, fat percentage, fat yield, number of milkings and fat-protein ratio), four physiological variables (DIM, parity, days pregnant, age) and concentrate intake during milking. However, because the fixed effects are highly correlated (see Fig. S1 online Supplementary File), six variables were selected to study their additive effects on MFG size. A linear mixed model fitted additive effects of six selected variables on MFG size; this is referred to as the multiple variable model. The individual cow's identification numbers and time of sampling were included in the models as random effects. The only exception was the estimation of the effect of sampling day, where only animal number was included as a random effect. The effect of sampling day, as an indicator for seasonal effects, stage of lactation, classified into early (<100 DIM), mid (100 to 200 DIM) and late (>200 DIM) and parity were further analysed. Mean differences between factor levels were estimated, and Fisher's LSD method was used to calculate confidence intervals for those differences. Graphs were produced using Minitab 17 Statistical Software (Minitab Inc., State College, PA).
Results
Milk fat globule size
The average MFG size for individual cows within our herd ranged from 2.70 to 5.69 µm throughout the year of this study, with around 50% of the cows producing MFG sizes between 3.80 and 4.40 µm and 25% producing MFG smaller or larger than 3.80 and 4.40 µm, respectively (Fig. 1).
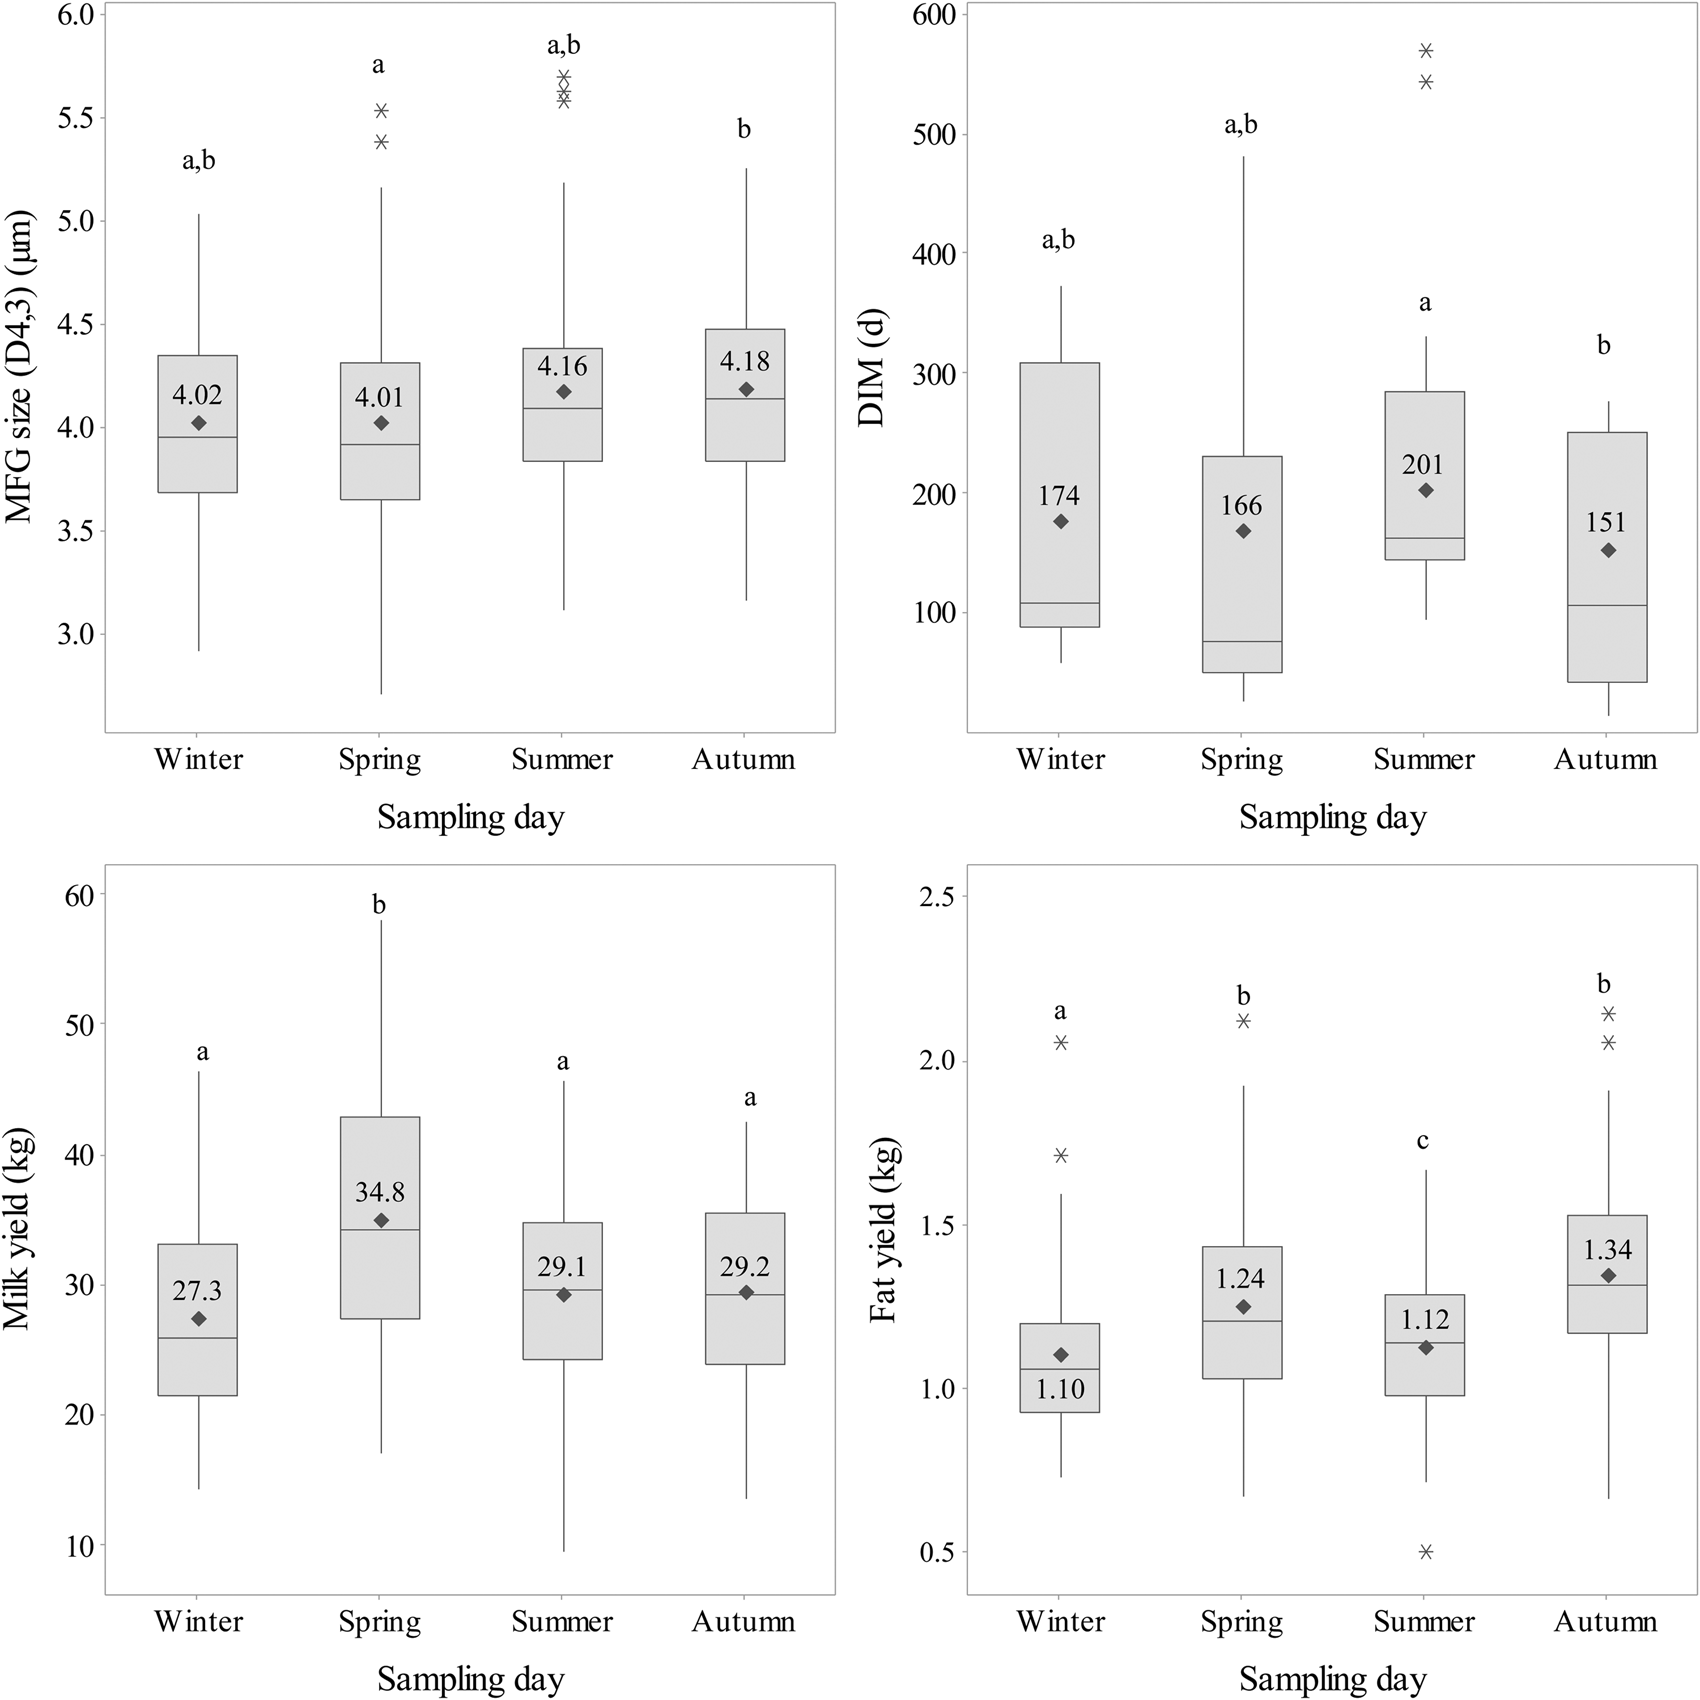
Fig. 1. Impact of season on the distribution of milk fat globule (MFG) size, days in milk (DIM), milk yield and fat yield in the studied herd. Statistically significant differences (P < 0.05, indicated by different letters) between sampling days for each variable were analysed by pairwise comparisons of the sampling days, using the single variable model with cow number as the random effect and the respective variable of interest as fixed effects. Please note, symbols and numbers in the interquartile box show the arithmetic means not the predicted means of the respective variables. Asterisks indicate outliers, which are at least 1.5 times the interquartile range from the edge of the box.
Sampling day, diet, environmental temperature and milking frequency
In our study, the day of sampling did not lead to a statistically significant difference in average MFG size F (175.2) = 1.93, P = 0.130. The effect of sampling day was used as an indicator for seasonal effects. Pairwise comparisons between sampling days showed the largest shift in average MFG size between spring and autumn sampling days, with larger globules in milk sampled on the autumn day (4.18 µm) compared to the spring day (4.01 µm). Average MFG size on the summer and autumn sampling days tended to be slightly higher compared to winter and spring sampling days (Fig. 1).
Table 1 shows the calculated composition of the cows' diet for each sampling day. While average concentrate consumption for the whole herd was relatively constant across the four sampling days, the proportion of pasture and silage varied. For example, in spring the cows' diet comprised 57% pasture and no silage on the spring sampling day compared to 43% silage and 7% pasture on the winter sampling day. The proportions of silage and pasture were more balanced on the autumn and summer sampling days (Table 1).
Table 1. Environmental temperature and diet composition for the whole herd on the sampling days in winter, spring, summer and autumn

ME, metabolisable energy.
All numbers are averages from the seven days prior to MFG size measurements. T min and T max are the lowest and highest recorded temperatures in the seven days prior to sampling.
Physiological state and milk production traits
The cows in the studied herd calve all year round, which is reflected in the wide range of DIM for each sampling day and statistically similar average DIM (Fig. 1). Furthermore, the herd comprises cows of different ages and parities (1.65 to 7.93 years and 1 to 6 lactations, respectively) and a variety of milk production traits (Fig. 1). The current study identified parity, stage of lactation and milk yield as main effects impacting MFG size (Table 2). MFG size decreased with ongoing lactation by 0.20 µm per 100 DIM (P < 0.001, Table 2). A shift towards larger MFG size by 0.16 µm between cows in second and third lactation was also observed (P = 0.031, Table 2). Milk yield was negatively related to MFG size with a decrease in size by 0.16 µm for every 10 additional litres of milk per day (P = 0.047, Table 2). However, fat yield and the number of milkings per day did not affect MFG size and only a small decrease in MFG size was observed per kg of concentrate in the cows' diet (−0.03 µm, P = 0.096, Table 2).
Table 2. Effects of selected variables on the average milk fat globule (MFG) size

DIM, days in milk.
Cow number and sampling day are included as random effects.
Discussion
Milk fat globule size
The considerable variation in average MFG size between individual cows is in accordance with previous studies investigating the MFG size distribution within a herd (Logan et al., Reference Logan, Auldist, Greenwood and Day2014) or across several herds (Fleming et al., Reference Fleming, Schenkel, Chen, Malchiodi, Ali, Mallard, Sargolzaei, Corredig and Miglior2017). Logan et al. (Reference Logan, Auldist, Greenwood and Day2014) measured the MFG size distribution within the herd once in spring and twice in autumn over two consecutive years and the average MFG sizes ranged between 2.5 and 5.7 µm. This considerable variation in MFG size between cows within the one herd of the same breed, exposed to the identical environmental conditions and fed the same diet, which was reported in the study by Logan et al. (Reference Logan, Auldist, Greenwood and Day2014), led us to hypothesise that physiological differences between individual animals rather than management practice and environmental conditions are in part responsible for their characteristic MFG size. This hypothesis was confirmed by the results of our current study.
Sampling day, diet, environmental temperature and milking frequency
Season is often mentioned as a determinant of MFG size because of its known effect on milk fat composition (Briard et al., Reference Briard, Leconte, Michel and Michalski2003; Logan et al., Reference Logan, Auldist, Greenwood and Day2014). However, there is very little published data about the effect of season on MFG size, partly because it is tightly associated with stage of lactation in herds that practise seasonal calving. The year-round calving pattern in our herd allowed us to estimate the effect of sampling day, across all seasons, more independently from the confounding effect of stage of lactation, which is a limitation of many studies in the literature. The results indicate a limited impact of seasonal effects. However, sampling was performed only once per season, which is a limitation of our study.
Spring sampling stood out as a period with increased pasture intake and milk yield (Fig. 1, Table 1). Therefore, changes in milk and fat yield could possibly explain the observed differences between the four days sampled across the seasons. However, average MFG size on the day in winter (4.02 µm) was very similar to the one in spring (4.01 µm), while an increase in milk yield was only observed on the spring day. Accordingly, average fat yields were similar between the autumn and spring days despite the difference in average MFG size (Fig. 1).
While daily concentrate intake was recorded for each cow, we did not measure individual pasture and silage intake. However, we calculated an estimated intake of pasture and silage for the whole herd (Table 1). Based on these assumptions we suggest that differences observed between sampling days across the four seasons cannot be attributed to the changes in diet. For example, average MFG size was similar between winter and spring sampling times, when the composition of the diet was markedly different. Pasture intake on the winter day was very low (7.2%) and silage intake was high, whilst the opposite was the case on the spring day with no silage supplementation and 57% pasture intake. However, this change was not reflected in a change in average MFG size (0.01 µm between the winter and spring sampling days, Fig. 1). Therefore, within the limits of our study changes in diet on the whole herd level did not impact MFG size.
On the individual level, concentrate intake is subject to changes throughout the lactation cycle because cows are allocated a ration of concentrate during milking, calculated based on their milk production. Even though the cows can finish their allocated concentrate ration in a feeding station immediately after milking, the concentrate intake is correlated with milk production, number of milkings and DIM (see Fig. S1 in the online Supplementary File). Due to this correlation, the impact of concentrate intake on MFG size distribution should only be looked at in combination with these variables. In our multiple variable model, a small effect of concentrate intake on average MFG size was observed (−0.03 µm per kg of concentrate, P = 0.096, Table 2). Intervention studies have shown that MFG size can be influenced for example by increasing the concentrate-to-forage ratio (Argov-Argaman et al., Reference Argov-Argaman, Mesilati-Stahy, Magen and Moallem2014) and through supplementation of the cows' diet with linseed (Lopez et al., Reference Lopez, Briard-Bion, Menard, Rousseau, Pradel and Besle2008), both leading to a small decrease in MFG size of 0.20 (P = 0.1) and 0.17 µm (P < 0.05), respectively. The observed trend towards smaller MFG size in cows fed a diet with high concentrate-to-forage ratio in the study by Argov-Argaman et al. (Reference Argov-Argaman, Mesilati-Stahy, Magen and Moallem2014) is more pronounced than the effect of a voluntarily increased concentrate intake observed in our study (−0.03 µm per kg concentrate, P = 0.096). Accordingly, a study in ewes reported no significant effect of increased concentrate-to-forage ratios on average MFG size (Martini et al., Reference Martini, Liponi and Salari2010). Compared to the variation between individual cows (2.70 to 5.69 µm in our study) the contribution of diet induced changes in MFG size are limited, supporting our hypothesis that inherent physiological differences may be more important determinants of MFG size.
The average number of milkings per day did not have a statistically significant impact on MFG size (effect per milking 0.10 µm, P = 0.240, Table 2). Automatic milking systems such as the one used on our research farm, have been shown to have no effect on MFG size if the number of milkings is the same as in a conventional milking parlour (Abeni et al., Reference Abeni, Degano, Calza, Giangiacomo and Pirlo2005). However, milking frequency is often increased in automatic milking compared with conventional milking systems, leading to higher total milk yields, which could in turn impact MFG size. Accordingly, Wiking et al. (Reference Wiking, Nielsen, Båvius, Edvardsson and Svennersten-Sjaunja2006) reported an increase in average MFG size when milking frequency was doubled from twice to four times daily. This is particularly interesting because the study was performed by milking one udder half twice and the other half four times daily, allowing the authors to look at the effect of increased milking frequency independently from individual cow effects. In our study, the average milking frequency for individual cows on the four sampling days ranged from 1.6 to 3.9 milkings per day. However, the effect of the number of milkings per day on MFG size was not statistically significant (0.10 µm for each additional milking, P = 0.240, Table 2). This indicates that the reported effect of the increased milking frequency in our study was in part due to its correlation with other explanatory variables. For example, cows in later stages of lactation tend to come in for milking less frequently (Fig. S1 online Supplementary File) and have smaller average MFG (see discussion on stage of lactation). Overall, the number of milkings probably does not have a strong impact on MFG size in a system where cows are free to determine their own milking frequency, although a small effect might be present as shown in the study by Wiking et al. (Reference Wiking, Nielsen, Båvius, Edvardsson and Svennersten-Sjaunja2006), where the average MFG size increased by 0.08 µm. Indeed, the estimated effect in our study is of this magnitude.
Physiological state and milk production traits
We confirm a major role for stage of lactation in the determination of MFG size and further suggest that parity (the number of lactations) has a significant impact on MFG size (Fig. 2, Table 2). Furthermore, we observed an inverse relationship between milk yield and MFG size (−0.16 µm per 10 l of milk produced, P = 0.047, Table 2), whilst fat yield did not significantly impact MFG size (0.30 µm, P = 0.134, Table 2).

Fig. 2. Milk fat globule (MFG) size distribution for cows in different stages of lactation and parities. Cows were grouped in early (<100 DIM), mid (100–200 DIM) and late (> 200 DIM) lactations for the purpose of this analysis. Statistically significant differences (P < 0.05, indicated by different letters) in MFG size between the groups were analysed by pairwise comparisons, using the single variable model with cow number and sampling day as the random effects and the respective variable of interest as fixed effects. Please note, symbols and numbers in the interquartile box show the arithmetic means not the predicted means of the respective variables. Asterisks indicate outliers, which are at least 1.5 times the interquartile range from the edge of the box.
A higher milk yield in cows producing milk with smaller average MFG size has been reported previously (Couvreur et al., Reference Couvreur, Hurtaud, Marnet, Faverdin and Peyraud2007; Mesilati-Stahy et al., Reference Mesilati-Stahy, Moallem, Magen and Argov-Argaman2015). Furthermore, several studies have shown that cows producing milk with a lower fat percentage also produce smaller MFG (Altenhofer et al., Reference Altenhofer, Holzmüller, Wolfertstetter, Ribeiro, Kulozik, Pfaffl and Viturro2015; Mesilati-Stahy et al., Reference Mesilati-Stahy, Moallem, Magen and Argov-Argaman2015). This can be indicative of a higher total milk yield due to a dilution effect in cows secreting the same or increased total fat yield in a larger volume of milk (Couvreur et al., Reference Couvreur, Hurtaud, Marnet, Faverdin and Peyraud2007). More specifically, the multiple variable model suggests that when comparing cows in the same stage of lactation the ones producing more milk, and possibly the ones that consume more concentrate, are predicted to exhibit smaller MFG size distributions. Conflicting results about the relationship between MFG size and fat yield have been reported in the literature, with some studies showing no effect of fat yield on MFG size (Couvreur et al., Reference Couvreur, Hurtaud, Marnet, Faverdin and Peyraud2007; Logan et al., Reference Logan, Auldist, Greenwood and Day2014), while others report an increase in average MFG diameter with increasing fat yields (Wiking et al., Reference Wiking, Stagsted, Björck and Nielsen2004).
Stage of lactation, expressed as DIM, had a statistically significant impact on MFG size. This is consistent with previous studies, which also report a decrease in MFG size between early and mid-lactation, however not always between mid and late lactation (Abeni et al., Reference Abeni, Degano, Calza, Giangiacomo and Pirlo2005; Altenhofer et al., Reference Altenhofer, Holzmüller, Wolfertstetter, Ribeiro, Kulozik, Pfaffl and Viturro2015; Fleming et al., Reference Fleming, Schenkel, Chen, Malchiodi, Ali, Mallard, Sargolzaei, Corredig and Miglior2017). The inverse relationship between MFG size and DIM can be attributed to a limited availability of membrane material in early and possibly mid lactation, where milk production and fat yield are high (Wiking et al., Reference Wiking, Stagsted, Björck and Nielsen2004; Altenhofer et al., Reference Altenhofer, Holzmüller, Wolfertstetter, Ribeiro, Kulozik, Pfaffl and Viturro2015). In our study, a steady decrease in milk and fat yield from early-to-mid and from mid-to-late lactation was also observed (data not shown). Therefore, the decrease in fat yield is a possible explanation for the decrease in MFG size with ongoing lactation. However, the effect of fat yield was not statistically significant in our study (P = 0.134, Table 2).
We hypothesise that underlying differences on a physiological and possibly molecular level are the true determinants of MFG size and that animal and milk production traits only account for some of the variation seen between individual cows. Overall, the estimated change in MFG size that can be attributed to different stages of lactation is a decrease of 0.60 µm over a nominal 300-d lactation cycle. This effect therefore does not sufficiently explain the variation between individual animals, ranging from 2.70 to 5.69 µm in average MFG size.
Differences in average MFG size were also observed, when first and second parity cows were compared to cows with three or more lactations. A similar effect of parity on MFG size was previously shown in ewes, with first parity animals producing milk with smaller average MFG size (Martini et al., Reference Martini, Scolozzi, Cecchi and Abramo2004). Conversely, a recent study by Fleming et al. (Reference Fleming, Schenkel, Chen, Malchiodi, Ali, Mallard, Sargolzaei, Corredig and Miglior2017) showed no significant impact of parity on MFG size distribution in dairy cows. This extensive study also investigated additive effects of several physiological and environmental variables on MFG size using a linear mixed model. However, 399 individual cows from 44 herds were used as opposed to a single herd in our study. A total of 30 cows from the 140 examined in our study were sampled over two consecutive lactation numbers. It is possible that in the study by Fleming et al. (Reference Fleming, Schenkel, Chen, Malchiodi, Ali, Mallard, Sargolzaei, Corredig and Miglior2017) the effect of parity was relatively small compared to between-herd and between-breed variations, while following the same herd over a one-year period allowed us to capture the independent effect of parity on MFG size.
Overall, the most dominant variables with impact on MFG size identified in our study are physiological parameters. This could indicate that dynamic changes in lipid metabolism throughout the cow's lactation cycle (stage of lactation) and the life cycle (different parities) could drive changes in MFG size. Furthermore, potential differences in the lipid metabolism could also be genetically determined traits and could provide an explanation for the variation in MFG size between individual animals. For example, changes in the origin of fatty acids (FA) incorporated into milk are different throughout the lactation cycle. Previous studies suggest that lipids in milk from cows in early lactation are predominantly derived from body fat stores and circulating FA derived from the cow's diet (Gross et al., Reference Gross, van Dorland, Bruckmaier and Schwarz2011). In mid and late lactation, however, FA are increasingly derived from de novo FA synthesis.
We conclude that some of the variation in MFG size seen in dairy cows can be attributed to changes in physiological state of the animal, i.e. stage of lactation and parity; and, in our study, these variables outweighed the effect of seasonal changes in the diet and weather conditions. However, the estimated effects of these variables cannot account for the overall variation in MFG size between individual animals and the span of average MFG size distributions observed in our herd (3 µm) exceeds the effect of stage of lactation, the most dominant variable impacting MFG size in our study, by 5-fold. We suggest that MFG size could be characteristic for each individual animal, possibly based on differences in their lipid metabolism.
Supplementary material
The supplementary material for this article can be found at https://doi.org/10.1017/S0022029919000748.
Acknowledgements
We acknowledge Kenny Oluboyede and Ashley Gabler for their support with all aspects of data and milk collection, as well as Dr Paula Gonzalez-Rivas and the students at our farm for their help with sampling. We also acknowledge the Melbourne Statistical Consulting Platform for their support with this work.


