Dairy products sold for public consumption must be accurately labelled in accordance with the contained milk species. Fraudulent labelling which may not be detected still exists. It affects the quality of the product and moreover species identification has a remarkable importance on account of frequent human adverse reactions, such as allergies (Commission Regulation, 1992, 1996, 2001; Mayer, Reference Mayer2005). In the last few years, many studies have been made to identify the best natural substitutes for human milk (Businco et al. Reference Businco, Giampietro, Lucenti, Lucaroni, Pini, Di Felice, Iacovacci, Curadi and Orlandi2000). In the case of IgE-mediated and non-IgE-mediated protein allergy, donkey's milk was found to be a valid alternative to cow's milk, also considering the favourable palatability (Monti et al. Reference Monti, Bertino, Muratore, Coscia, Cresi, Silvestro, Fabris, Fortunato, Giuffrida and Conti2007). The high lactose content, the characteristic protein profile and the relevant percentage of essential amino acids make this milk a potential new dietetic food and a valid breast milk substitute (Guo et al. Reference Guo, Pang, Zhang, Zhao, Chen, Dong and Ren2007).
Methods enabling detection and quantitative determination of cow milk in mixtures with other milks have been studied for a long time. The principal frauds involve the undeclared addition of cow milk to goat or ewe milks, the main motivation being due to the lower yield and the higher price of ewe or goat milks (Ramos & Juráez, Reference Ramos and Juráez1986; Rodriguez-Nogales, Reference Rodriguez-Nogales2006).
As species identification in animal products has received great attention in recent years, many methods for milk speciation have been set up. For this purpose different analytical approaches could be used: lipid and protein analysis or DNA-based methods for example.
As regards the protein fraction either electrophoresis or immunoassays have been applied (Hurley et al. Reference Hurley, Ireland, Coleman and Williams2004); capillary electrophoresis (Molina et al. Reference Molina, Martín-Álvarez and Mercedes1999; Rodriguez-Nogales, Reference Rodriguez-Nogales2006), two-dimensional electrophoresis (Chianese et al. Reference Chianese, Laezza, Smaldone, Stingo, Del Giovine and Addeo1990), isoelectric focusing (Moio et al. Reference Moio, Sasso, Chianese and Addeo1990), chromatographic techniques (Haza et al. Reference Haza, Morales, Martín, García, Anguita, González, Sanz and Hernández1995; De Noni et al. Reference De Noni, Tirelli and Masotti1996; Ferriera & Caçote, Reference Ferriera and Caçote2003) and enzyme linked immunosorbent assay methods (Ritcher et al. Reference Ritcher, Krause, Graf, Sperrer, Schwarza and Klostermeyer1997) were worth mentioning. Recently, DNA-based methods such as polymerase chain reaction (Bottero et al. Reference Bottero, Civera, Numera, Rosati, Sacchi and Turi2003; López-Calleja et al. Reference López-Calleja, González, Fajardo, Martín, Hernández, García and Martín2007) have been used.
The lipid fraction has been used less for milk species identification. The most commonly used methods were based on milk fat composition such as some fatty acid (FA) ratios or triacylglycerol (TAG) profile, but these do not always allowed detection of milk adulteration. Lipid analysis was based on chromatographic techniques (Goudjil et al. Reference Goudjil, Fontecha, Fraga and Juáreza2003) or on nuclear magnetic resonance (NMR) spectroscopy. Andreotti et al. (Reference Andreotti, Trivellone, Lamanna, Di Luccia and Motta2000) have investigated the TAG from cow and buffalo milk fat by 13C-NMR, a useful technique to provide unique information for milk identification of different animal species. Brescia et al. (Reference Brescia, Mazzilli, Sgaramella, Ghelli, Fanizzi and Sacco2004) have characterized and differentiated buffalo and cow milk samples by means of 1H-NMR; multivariate statistical analysis, carried out on the results of the lipid analysis, allowed buffalo milk to be distinguish from cow milk.
In a previous paper (Blasi et al. Reference Blasi, Montesano, De Angelis, Maurizi, Ventura, Cossignani, Simonetti and Damiani2008) various samples of milk fat from mammalian non-ruminant (donkey) as well as ruminant (cow, ewe, goat, buffalo) species were studied. Donkey milk appeared interesting for its potential biological properties. In fact, it represented an important dietary source of essential FA, esterified in high percentage in the sn-2- position. The different distribution of the FA on the glycerol backbone of TAG has suggested this non-random distribution could provide some procedures to detect possible adulteration of one milk type with another of minor commercial value.
Among multivariate statistical data analysis, linear discriminant analysis (LDA) is probably the best known method (Fisher, Reference Fisher1936) and can be used not only to examine multivariate differences between groups, but also to determine which variables are the most useful for discriminating between groups (Leotta, Reference Leotta2004). LDA is considered an important classical parametric method for grouping samples when the sample allocation is previously known. It has been successfully used for the identification/differentiation of various foods, such as oils, wines and others (Damiani et al. Reference Damiani, Cossignani, Simonetti, Campisi, Favretto and Gabrielli Favretto1997; Arvanitoyannis et al. Reference Arvanitoyannis, Katsota, Psarra, Soufleros and Kallithraka1999; Cocchi et al. Reference Cocchi, Durante, Marchetti, Armanino and Casale2007). Discriminant analysis has been used to distinguish the milk and cheese of various species (Fresno et al. Reference Fresno, Prieto, Urdiales, Sarmiento and Carballo1995; Rodriguez et al. Reference Rodriguez, Alaejos and Romero1999; Rodriguez-Nogales, Reference Rodriguez-Nogales2006; Karoui et al. Reference Karoui, De Baerdemaeker and Dufour2008).
The objective of this study was to apply LDA to the experimental data of TAG stereospecific analysis to select the best variables to characterize the matrixes according to animal species origin and to provide unique information for identification, characterization and differentiation of donkey and cow milk and of their mixtures.
The analyses were also carried out using an artificial neural network (ANN), technique widely used for analyzing data for food quality prediction (Ni & Gunasekeran, Reference Ni and Gunasekeran1998).
Materials and Methods
Samples and reagents
Five milk samples of cow and donkey, randomly selected from Italian farms, were collected at morning milking in sterile bottles by direct manual milking, from animals in mid-lactation . The samples were immediately stored at 4°C for the subsequent analyses. All animals, free from mastitis or any other inflammatory diseases, were multiparous; the number of lactation was 2-3 for both animal species; they grazed in the morning and in the afternoon were reared in stables and fed with hay, fodder grass and vegetables.
In order to verify the possibility of a group separation on the basis of the analytical data, the milk samples were assigned to five groups indicated as: D (pure donkey milk, n=5), D/C 99:1 (99% donkey milk-1% cow milk, n=5), D/C 97:3 (97% donkey milk-3% cow milk, n=5), D/C 95:5 (95% donkey milk-5% cow milk, n=5) and C (pure cow milk, n=5). Group D contained separate samples from each of the five donkeys and group C contained separate samples from each of the five cows. The D/C groups contained five separate donkey milks, each mixed with one representative pool of five cow milk samples. The data of TAG, relative to total and intrapositional FA compositions, of the considered mixtures were obtained using software developed at the University of Perugia, that is able to calculate their compositions from the experimental data of the stereospecific analysis of cow and donkey pure milk samples.
All solvents and reagents were of analytical grade and were purchased from Carlo Erba Reagents (Milano, Italy).Phospholipase A2 from hog pancreas (561 U/mg) was from Fluka. A standard mixture from Supelco (Bellefonte, PA, USA), Supelco 37 component fatty acid methyl esters (FAME) mix, containing the methyl esters of 37 FA (Catalog No. 47885-U) was used; the FA contents ranged between 2% and 4%, while the palmitic acid methyl ester was 6%.
Lipid extraction
Lipid extraction was carried out according to the procedure reported in a previous work (Blasi et al. Reference Blasi, Montesano, De Angelis, Maurizi, Ventura, Cossignani, Simonetti and Damiani2008). In brief, lipid fraction was extracted with a mixture of chloroform/methanol (2:1, v/v). The chloroform phase was collected, while the aqueous phase was washed with a mixture chloroform/methanol/water (86:14:1, v/v/v). The collected organic phases were washed with water, totally dried in a rotary evaporator and then dissolved in hexane.
Stereospecific analysis of TAG
TAG fraction was isolated from total fat by thin layer chromatography (TLC) as previously reported (Blasi et al. Reference Blasi, Montesano, De Angelis, Maurizi, Ventura, Cossignani, Simonetti and Damiani2008); in the cited article the phospholipase A2 procedure for stereospecific analysis of TAG has been detailed. In brief, sn-1,3/sn-1,2(2,3)-diacylglycerols (DAG) were prepared by partial chemical deacylation of TAG using ethyl magnesium bromide in anhydrous ethyl ether; sn-1,2(2,3)-DAG were isolated by TLC and then subjected to chemical synthesis to obtain sn-1,2(2,3)-phosphatidylcholines (PC). Finally sn-1,2(2,3)-PC, isolated by TLC, were reacted with phospholipase A2 to obtain sn-1-lysophosphatidylcholines (LPC) and free FA; these hydrolysis products were separated by TLC, derivatized and analyzed by HRGC analysis, as reported in the following Section.
HRGC analysis
FAME preparation and their HRGC analysis were reported in previous work (Blasi et al. Reference Blasi, Montesano, De Angelis, Maurizi, Ventura, Cossignani, Simonetti and Damiani2008). The FAME of total TAG and sn-1-LPC were prepared by transmethylation using hexane and methanolic 2m-KOH while the esterification of free FA was performed using diazomethane. A standard solution containing 37 FAME was used to identify the individual FA; the same solution was used to calculate some analytical parameters (linearity parameters, limits of detection (LOD) and limits of quantification (LOQ)). Correlation coefficients were found to be higher than 0·9947 in all cases, indicating a good linearity; the LOD value (ng/ml) ranged from 10 for linolenic acid to 36 for butyric acid; the LOQ value (ng/ml) ranged from 30 for linolenic acid to 110 for butyric acid. The percentage of each FA was calculated using the peak area of the samples corrected with the respective correction factors, as reported by Christie (Reference Christie2003). The data were normalized considering only the main reported FA (% mol mean values greater than 0·1). Each HRGC analysis was carried out in duplicate.
Statistical analysis
The considered FA were the following: butyric acid (C4:0), caproic acid (C6:0), caprylic acid (C8:0), capric acid (C10:0), lauric acid (C12:0), myristic acid (C14:0), palmitic acid (C16:0), palmitoleic acid (C16:1n-7), stearic acid (C18:0), oleic acid (C18:1n-9), linoleic acid (C18:2n-6) and linolenic acid (C18:3n-3); the variables were the total (TAG) and the intrapositional (INTRA) FA compositions (%mol) in the three sn- positions (sn-1-, sn-2-, sn-3-) of the TAG glycerol backbone of the milk mixtures.
The variables entered in the chemometric analysis were the ones selected by means of the multiple regression method, rejecting the variables linearity associated to the others already in the equation (Lachenbruch, Reference Lachenbruch1979).
The data were elaborated with the classical multivariate statistical analysis methods (LDA), according to the Mahalanobis distance criterion and using the SPSS Professional Statistics version 9.0 software.
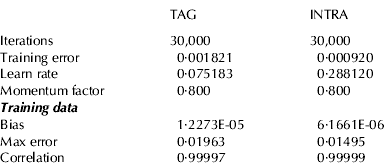
The ANN data elaboration was carried out using the Neural Connection software from SPSS Inc., Chicago, IL, USA. The structure of the ANN used for TAG data elaboration consisted of one input layer (analytical results) with 12 nodes, which corresponded to the FA, two hidden layers (with 7 and 3 nodes, respectively) and one output layer for the required output (differentiation of milk samples). The structure of the ANN used for INTRA data elaboration consisted of one input layer (analytical results) with 36 nodes, which corresponded to the FA in the three sn-glycerol positions, two hidden layers (with 18 and 9 nodes, respectively) and one output layer for the required output. The ANN training was terminated when the root mean square error reached the minimum value.
Results and Discussion
Table 1 shows the total and intrapositional FA compositions (mean values and standard deviations) of TAG fraction of cow and donkey pure milks. Both milks contained high percentage of saturated FA with some differences relative to the individual FA; in particular donkey milk showed lower % contents of short and long chain FA and higher content of medium chain FA relative to cow milk. Moreover the donkey milk had the higher amount of polyunsaturated FA, represented by linoleic and linolenic acids, both essential FA. These data confirmed that donkey milk is a very interesting food matrix from a nutritional point of view. The stereospecific analysis data showed differences in the FA distribution; donkey milk presented a higher % value of essential FA in all the three sn- positions, while the short chain saturated FA preferred the sn-1- and the sn-3- positions.
Table 1. Total and intrapositional FA composition of TAG fraction of cow and donkey pure milks

Table 2 shows the data of the total and intrapositional FA compositions of the three D/C mixtures (99:1, 97:3, 95:5), obtained by elaboration of experimental results of the stereospecific analysis of cow and donkey pure milk samples and used as variables in the successive statistical analyses.
Table 2. Total and FA intrapositional composition of TAG fraction of donkey and cow milk mixtures

Among the various multivariate techniques, the simplest seems to be the LDA method, a widespread parametric method of classification, where the distinction between two categories is a linear function. The parametric LDA techniques are based on the assumption that the data obey a multivariate normal distribution and that the covariance matrix of each category (dispersion of the category) is not significantly different from one case to another. The Mahalanobis distances of each object from the centroids of the categories are computed and the resulting object assigned to the category with lowest distance. When performing a multiple group discriminant analysis some optimal combinations of variables can automatically be determined so that the first function provides the most overall discrimination between groups, the second provides second most, and so on.
Table 3 shows the values of Fisher's linear discriminant functions (eigenvalues, their respective percentages of variance and significance tests). They have been obtained carrying out the chemometric analysis on the samples grouped according to the following classification parameters: TAG (total FA compositions of TAG fraction, %mol) and INTRA (intrapositional FA compositions of TAG fraction, %mol) of milk mixtures (D/C 99:1, 97:3, 95:5). The first discriminant function (function 1) explained 99·9% of the variance in the case of TAG; in the case of INTRA the function 1 and the function 2 explained respectively 90·0% and 9·9% of the variance. Wilks's lambda test showed that only the first function was significant (P<0·05) for TAG data, while the first two functions were the most important for INTRA data.
Table 3. Fisher's linear discriminant functions and functions at group centroids obtained from LDA analysis using TAG and INTRA acidic compositions

† for the analyses were used the first four canonical discriminant functions
D, pure donkey milk; C, pure cow milk; D/C, donkey/cow milk mixtures
Initially, the samples were analyzed according to the total FA composition (%mol) and subsequently according to the intrapositional FA composition (%mol), obtained by stereospecific analysis of TAG fraction. Since each lipid matrix, both animal and vegetable, has a non-random characteristic distribution of FA among the glycerol positions (Parodi, Reference Parodi1983), these last data could be useful to determine the origin of the fat as well as to study a possible diversification of the milk mixtures in order to detect possible adulteration of dairy products.
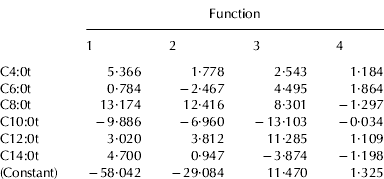
Tables 4a and 4b show the unstandardized canonical discriminant function coefficients of mixtures, elaborated according to TAG and INTRA data, respectively. These coefficients can be used to compare the relative importance of the independent variables. The unstandardized discriminant functions of each considered system appear as:
where Kα is a constant of the model, x1, … xn are the analytical parameters of each sample entered in the model, α1, … αn are the regression coefficients of these parameters and n is the number of predictive variables.
Table 4a. Unstandardized canonical discriminant function coefficients obtained from LDA analysis using TAG acidic compositions

t, total FA% content in TAG fraction
Table 4b. Unstandardized canonical discriminant function coefficients obtained from LDA analysis using INTRA acidic compositions
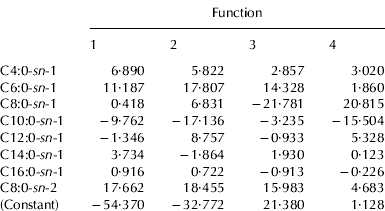
sn-1, FA% content in sn-1- position of TAG fraction
sn-2, FA% content in sn-2- position of TAG fraction
As regards TAG data, only six of twelve FA were considered, among which were all the short and medium chain acids. Caprilic acid was the variable that contributed most the first two canonical functions, accounting for most of the discrimination between milk mixtures (99·9%), while capric acid showed the lowest values. In the case of INTRA data, eight FA were considered as variables: all the saturated acids in sn-1- position, with the exception of stearic acid, and only the caprilic acid for the sn-2- position. This last variable was the most important discriminant parameter, together with caproic acid in sn-1- position. The data of FA compositions in the sn-3- position were never considered.
The plot of results of known samples can be obtained using the values of the first two discriminant functions, especially when these explain almost the entire variance. Fig. 1 and 2 show the graphical distribution of the milk samples on the plots, for the TAG and INTRA data elaboration respectively. It is possible to observe that the INTRA data permitted a better separation of different groups, in fact both pure and mixture samples were close to the group centroid. Using these functions, the coordinates of the centroids of the D/C samples (using the group means, as reported in Table 3) were calculated.

Fig. 1. Discriminant function plot of the first two functions obtained from LDA analysis using TAG acidic compositions.

Fig. 2. Discriminant function plot of the first two functions obtained from LDA analysis using INTRA acidic compositions.
Table 5 shows the classification of results; it reports the percentages of samples correctly classified into each group (on the diagonal of the matrices). The study, carried out to correlate the total and the intrapositional FA (%mol) compositions of milk samples with the percentage of cow milk in donkey milk, showed that a completely effective classification was always possible by LDA, using both the data of total and intrapositional compositions; in fact from these results it was evident that all the samples were correctly classified (100·0%).
Table 5. Classification results obtained from LDA analysis using TAG and INTRA acidic compositions
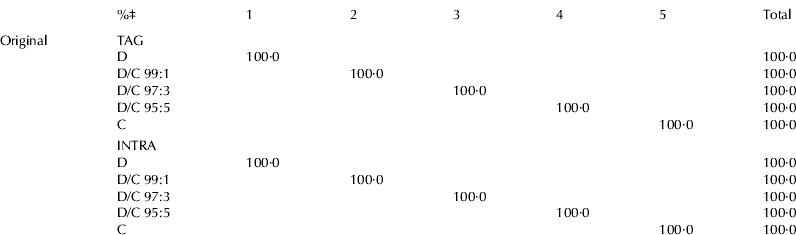
‡ samples correctly classified
For abbreviations, see Table 3
The results showed that this statistical approach can be used to evaluate the differences between milk samples, in fact the LDA always gave satisfactory results, even if the milk samples were not numerous. Nevertheless, the stereospecific analysis data were useful to correctly discriminate even the mixture with the 1% of bovine milk, because, as known, total and intrapositional TAG compositions are related to the biosynthetic pathway.
As alternative approach to the classical and more usual LDA, in this research the data of TAG total and intrapositional FA compositions of the pure and mixture milk samples were elaborated by ANN. This system analyzes the information coming from the interconnections among the nodes of the various layers which constitute the net (Zupan & Gasteiger, Reference Zupan and Gasteiger1993) and offer the possibility of classifying/characterizing the examined samples according to parameters of the net used.
Table 6 shows the parameters for the ANN analysis used for the classification of the same milk sample groups considered for LDA analysis. The ANN results showed that the classification was in all cases well defined, in fact low error and good correlation have been obtained using both TAG and INTRA data. However, as already observed with LDA, the ANN results were slightly better when the INTRA data were used.
Table 6. Parameters and results of ANN analysis using TAG and INTRA acidic compositions

Conclusions
The results reported in this work showed that FA intrapositional compositions were able to characterize donkey milk and identify mixtures containing very small amounts of cow milk. The results showed that the considered statistical approaches permitted discrimination among pure and adulterated milks; also the separation of the samples containing different percentages (1, 3 and 5%) of cow milk added to donkey milk has been obtained. The elaborations carried out by LDA were completely significant for the differentiation/classification of the milk mixtures; the elaborations by ANN confirmed the results obtained by LDA. For a practical application of this method, as the classification of new samples of unknown mixtures, a broader calibration set-up would probably be necessary.