


An increased activity of the adrenal cortex occurs in response to one or more stressors (Sapolsky et al., Reference Sapolsky, Romero and Munck2000). Notwithstanding that cortisol is also intimately involved in metabolic regulation independent of external stressors, the measurement of cortisol and cortisol metabolites in fecal, plasma and salivary samples is increasingly used to detect stress and thus welfare issues in domestic animals (Mormède et al., Reference Mormède, Andanson, Aupérin, Beerda, Guémené, Malmkvist, Manteca, Manteuffel, Prunet, van Reenen, Richard and Veissier2007). Increases in plasma and salivary corticosteroids are detected shortly after a stressor acts on an animal (Negrão et al., Reference Negrão, Porcionato, de Passillé and Rushen2004; Scheidegger et al., Reference Scheidegger, Gerber, Ramseyer, Schüpbach-Regula, Bruckmaier and van der Kolk2016). Hence, both salivary and plasma cortisol levels can be used as indicators for stress in farm animals. Quantifying or characterizing a stress response often requires multiple blood samples, which might be painful for the animal. Taking salivary samples is an easy to perform and minimally-invasive method to measure cortisol concentrations. Plasma and salivary cortisol concentrations have been shown to increase and decrease similarly in cattle and horses (Negrão et al., Reference Negrão, Porcionato, de Passillé and Rushen2004; Peeters et al., Reference Peeters, Sulon, Beckers, Ledoux and Vandenheede2011) but to the authors knowledge no predictions of plasma from saliva cortisol concentrations have been established/made. Thus, the aim of the study was to assess the magnitude and duration of the adrenocortical response to a fixed dose of adrenocorticotropic hormone (ACTH) and the time taken to reach peak levels of salivary vs. plasma cortisol, by comparing cortisol concentrations in plasma and saliva in time-matched samples (i.e. samples taken at the same time for plasma and saliva) before and after an ACTH stimulation.
Materials and methods
All animal procedures in this study were undertaken in accordance with the German animal ethics regulations and approved by the State Office of Lower Saxony for Consumer Protection and Food Safety (Ref. No. 33.4-42502-04-12/0979).
The study was carried out at the experimental station of the Institute of Animal Nutrition of the Friedrich-Loeffler-Institut in Brunswick, Germany. Five multiparous (parity: 3–5; 4.0 ± 0.5, mean ± se) Holstein-Frisian dairy cows were selected from a 60 head herd according to age (5.6 ± 0.2 years, range: 5.2–6.4 years) and weight (696 ± 30 kg), producing on average 37.3 ± 0.9 kg of milk per day at 146 ± 45 d in lactation. During the experiment the animals were housed and milked (at 0500 and 1500) in tie stalls (1.40 × 2.00 m per cow) and received a TMR (35% corn silage, 35% grass silage, 30% concentrate; dry matter (DM) basis 470 g/kg; chemical composition in g/kg DM: Ash 65, crude protein 156, sugar 18, starch 254, crude fiber 183, neutral detergent fiber 367, acid detergent fiber 201, ether extract 38) at 0600 and 1600 h. Water was available ad libitum from a nose-press water bowl. Cows were within sight and sound to each other. During the experimental period mean ambient temperature in the tie stall was 22.6 ± 0.2 °C. A day before the experiment started, a polyethylene catheter (PUR Infusionskatheter, Walter Vetrinär-Instrumente, Baruth/Mark, Germany) was inserted into the jugular vein of each cow. Saliva and blood samples were collected at 490, 400, 260, 140, 20, 10 and 0 min before the ACTH application. A dose of 8 µg/kg BW (i.e. 0.8 mg/kg) of ACTH (Synacthen®, Alfasigma, Milano, Italy) (Verkerk et al., Reference Verkerk, Macmillan and McLeay1994) was then injected via the catheter between 1000 and 1015 h. Additional blood and saliva samples were collected after the ACTH administration at 10, 20, 30 and 60 min intervals (i.e. at 10, 20, 30, 50, 70, 90, 110, 140, 200, 260, 320, 380, 440 and 500 min post ACTH application). Saliva samples of approx. 5 ml were collected using cotton held by a surgical clamp immediately after blood samples. Saliva soaked cotton were transferred to a 50 ml plastic tube (Greiner, Frickenhausen, Germany) before centrifugation. Blood samples (5 ml) were drawn into EDTA tubes (Greiner, Frickenhausen, Germany) to avoid coagulation. Both saliva and blood samples were centrifuged (Biofuge Fresco, Heraeus, Schwerte, Germany) at a temperature of 10 °C at 2000 g for 10 min, immediately after collection. An aliquot of the supernatant was stored at −20 °C until further analysis. Cortisol concentrations were determined from plasma and saliva samples using commercial ELISA kits following the instructions of the manual (IBL International, Hamburg, Germany). Assays were validated using standard dilution curves (1 : 1, 1 : 2, 1 : 4, 1 : 8 and 1 : 16) and recovery rates were >92% for both plasma and saliva. The intra-assay CV was 4.6% for saliva and 3.0% for plasma, while the inter-assay CV was 10.2% for saliva and 3.4% for plasma. The sensitivity of the assays (i.e. the detection limit) was 0.03 ng/ml for saliva and 2.5 ng/ml for plasma. Statistical analyses were performed with the SAS software package 9.4 (SAS Inst., Inc., Cary, NC). The normally distributed data were analyzed with a repeated measure ANOVA using the MIXED procedure with an integrated post hoc test (Tukey) with a 5% significance level. Due to repeated measurements, the animal was included as a random factor and the sampling time as fixed effect. The model was:
 $$Y_{ijk} = {\rm} \mu {\rm} + {\rm} A_i + {\rm} T_j + {\rm} e_{ijk}$$
where Y ijk = cortisol level (in plasma or saliva), μ = the overall mean, A i = random effect of the animal (i = 1, 2, …, 5), T j = effect of sampling time (j = −490, −400, −260, …, 500 min) and e ijk = residual error. Cortisol data are expressed as means ± se unless otherwise stated. The relationship between cortisol concentrations in plasma and saliva was evaluated by regression and correlation analysis.
Results
Mean baseline cortisol concentration was 2.0 ± 0.2 ng/ml (range: 1.4 to 2.6 ng/ml) in saliva and 21.2 ± 1.7 ng/ml (range: 17.9 to 25.4 ng/ml) in plasma and, thus, 10.8 ± 2.0 times higher in plasma than in saliva. An increase in cortisol concentrations (P < 0.001) was observed after 10 and 20 min of ACTH administration in plasma and saliva respectively (Fig. 1). The time of peak concentration after ACTH administration did not differ between saliva (80 ± 10 min, 13.6 ± 2.8 ng/ml) and plasma (70 ± 6 min, 138.3 ± 6.9 ng/ml). After peak concentrations, values steadily declined and returned to baseline values after 169 ± 15 min in plasma and after 170 ± 14 min in saliva (P = 0.867). Thus, cortisol concentrations remained elevated above baseline values for 113 ± 10 min in saliva and for 114 ± 8 min in plasma. Furthermore, a positive significant correlation was observed between plasma and salivary cortisol concentrations (raw data: r = 0.93, R 2 = 0.69, P < 0.05, Fig. 2a; LS-Means: R 2 = 0.93, P < 0.001, Fig. 2b). Log10 plasma cortisol concentrations predicted from the regression equations were on average 103.1 ± 2.4% (range: 65.1 to 170.7%) and 102.1 ± 1.4% (range: 90.0 to 115.2%) of actual measured values for raw data and LS-Means, respectively. Ratios between saliva and plasma cortisol concentrations were on average 0.085 ± 0.004 (−490 to 0 min: 0.089 ± 0.011; 10–140 min: 0.086 ± 0.004; 200–500 min: 0.084 ± 0.008).
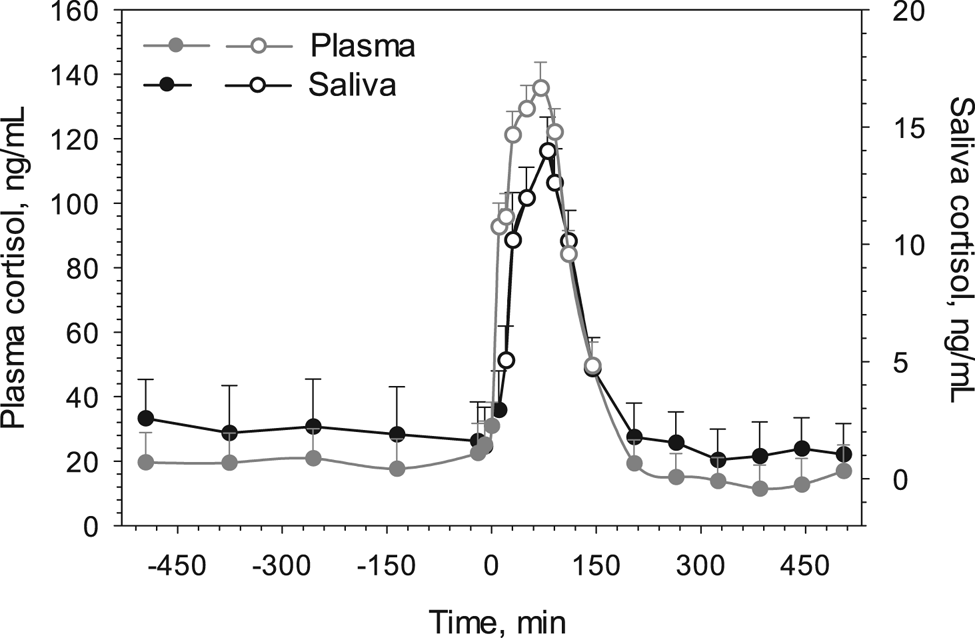
Fig. 1. Cortisol concentrations in plasma (gray symbols and line) and saliva (black symbols and line) before and after an ACTH application at time zero in dairy cattle (n = 5). Open symbols denote a significant difference (P < 0.05) to closed symbols (baseline values) within the same medium (saliva or plasma). Values are LS-Means plus sem.

Fig. 2. Relationship between salivary and plasma cortisol concentrations after an ACTH challenge test in dairy cattle for (a) raw data (log10 Saliva cortisol = −0.95 + 0.92 × log10 plasma cortisol, R 2 = 0.69, P < 0.05, n = 5) and for (b) LS-Means (log10 Saliva cortisol = −1.19 + 1.09 × log10 plasma cortisol, R 2 = 0.93, P < 0.001, n = 5; the two gray dots indicate samples taken after 10 and 20 min of the ACTH application, respectively and were excluded from the regression analysis).
Discussion
In many studies, the measurement of cortisol concentrations or their metabolites in plasma, saliva, milk or feces are used in domestic animals as an indicator for their response to stress and thus their welfare (e.g. Negrão et al., Reference Negrão, Porcionato, de Passillé and Rushen2004; Palme et al., Reference Palme, Rettenbacher, Touma, El-Bahr and Möstl2005). In this study, an ACTH application triggered the adrenal secretion of cortisol. This experimental approach to measure cortisol release has been carried out in several other studies in a variety of domestic livestock species, such as pigs (Sautron et al., Reference Sautron, Terenina, Gress, Lippi, Billon, Larzul, Liaubet, Villa-Vialaneix and Mormède2015), horses (Scheidegger et al., Reference Scheidegger, Gerber, Ramseyer, Schüpbach-Regula, Bruckmaier and van der Kolk2016), sheep (Essawy et al., Reference Essawy, Benhaj, Cooke and Dobson1989), goats (Jiménez Escobar et al., Reference Jiménez Escobar, Basrur, Gartley and Liptrap1998) and cattle (Schwinn et al., Reference Schwinn, Sauer, Gerber, Bruckmaier and Gross2018). The main aim of such an approach is to determine the time of increased cortisol release after the ACTH challenge and the time period cortisol is elevated above baseline values. In our study, plasma and salivary cortisol levels increased above base line values after 10 and 20 min of ATCH application, respectively. This was in agreement with previous studies where concentrations increased rapidly with a 10 min time lag between plasma and saliva but decreased to baseline values at approximately the same time (Cook, Reference Cook2012; Hernandez et al., Reference Hernandez, Thierfelder, Svennersten-Sjaunja, Berg, Orihuela and Lidfors2014). In the present study, plasma cortisol concentrations were 10 to 15 times higher compared to salivary cortisol concentrations but the relative increases and decreases were nearly identical (Fig. 1). Peak concentrations in the present study for plasma and saliva were higher compared to some previous studies (Verkerk et al., Reference Verkerk, Macmillan and McLeay1994; Negrão et al., Reference Negrão, Porcionato, de Passillé and Rushen2004; Schwinn et al., Reference Schwinn, Sauer, Gerber, Bruckmaier and Gross2018), however, van der Kolk et al. (Reference Van der Kolk, Breukink, Wensing and Mol1991) reported peak values of 148 ng/ml after 60 min, similar to our findings. The reason for differences in plasma and saliva cortisol levels between studies could be due to the sensitivity of assays and less likely due to management of the study animals before ACTH application. We started taking regular blood and saliva samples approximately 8 h before the ACTH application and no significant increases in both plasma and salivary cortisol concentrations were noted during the period before the ACTH application. Furthermore, the ACTH dose administered in our study was higher compared to ACTH doses in previous studies (Negrão et al., Reference Negrão, Porcionato, de Passillé and Rushen2004; Schwinn et al., Reference Schwinn, Sauer, Gerber, Bruckmaier and Gross2018) but similar to the dose administered by van der Kolk et al. (Reference Van der Kolk, Breukink, Wensing and Mol1991), thus possibly explaining the higher plasma and salivary cortisol concentrations in the present study.
In our study we noted a time difference in the occurrence of plasma and salivary cortisol peak concentrations of 10 min, however this difference was not significant. In previous studies the time lag between peak concentrations of plasma and saliva varied from 0 min (Negrão et al., Reference Negrão, Porcionato, de Passillé and Rushen2004) to 30 min (Schwinn et al., Reference Schwinn, Sauer, Gerber, Bruckmaier and Gross2018) thus suggesting some variability. As Schwinn et al. (Reference Schwinn, Knight, Bruckmaier and Gross2016) pointed out the equilibrium between plasma and salivary cortisol concentrations is mainly achieved by passive diffusion of free cortisol into the lumen of the salivary gland. The time differences are thus due to different factors and are not all yet fully known. The time differences could be due to the amount of ACTH administered, animal handling and/or sampling intervals. However, in order to make predictions of the timing in peak cortisol levels, further research into the specific aspects of ACTH applications and their interdependence with peak cortisol levels is needed.
We observed a strong positive relationship between salivary and plasma cortisol concentrations allowing relatively accurate predictions of plasma cortisol concentrations from salivary cortisol concentrations (Fig. 2). Ratios between salivary and plasma cortisol concentrations were on average 0.09 and did not change substantially during the ACTH challenge. In the study from Schwinn et al. (Reference Schwinn, Sauer, Gerber, Bruckmaier and Gross2018) ratios ranged between 0.11 to 0.16 and were thus higher compared to our results. Furthermore, in a recent study in dairy cattle only low correlations were observed between plasma and salivary cortisol concentrations before, during and after drinking, feeding and ruminating in dairy cows (Schwinn et al., Reference Schwinn, Knight, Bruckmaier and Gross2016). This suggests that parallel rapid increases in plasma and salivary cortisol concentrations might be a response to an immediate short-term stressor and are less likely to reflect behavioral responses or changes in cortisol levels that are related to metabolic regulatory control.
In conclusion, we have shown close correlations between plasma and salivary cortisol in an experimental scenario (ACTH challenge) and we have quantified the time differences between the plasma and salivary peaks. Under these experimental circumstances, salivary cortisol could be regarded as a good indicator of the stress response.
Acknowledgements
We thank Gisela Niemann, Stine Heindorff, Silke Werner and Kerstin Krösmann from the Institute of Animal Welfare and Animal Husbandry for technical help and Sven Dänicke from the Institute of Animal Nutrition of the Friedrich-Loeffler-Institut for logistical support.


