


In recent years donkey's milk (DM) has attracted an increasing interest in human nutrition, since it may represent the best natural substitute of cow's milk for children affected by milk protein allergy, a condition of increasing incidence (Businco et al., Reference Businco, Giampietro, Lucenti, Lucaroni, Pini, Di Felice, Lacovacci, Curadi and Orlandi2000; Monti et al., Reference Monti, Viola, Baro, Cresi, Tovo, Moro and Bertino2012; Cunsolo et al., Reference Cunsolo, Saletti, Muccilli, Gallina, Di Francesco and Foti2017). Allergic manifestations to DM are rare and, to date, only one case of work-related DM allergy has been documented (Giorgis et al., Reference Giorgis, Rolla, Raie, Geuna, Boita, Lamberti, Nebbia, Giribaldi, Giuffrida and Brussino2018). DM may be considered a valid alternative to powdered milks, soybean milk replacement or other formulas employed in the diet therapy of these patients. The reason lies in the low casein content and in the ratio of casein to whey protein that is closer to human milk than that observed in ruminant milk (Guo et al., Reference Guo, Pang, Zhang, Zhao, Chen, Dong and Ren2007). Recently, the presence of all four casein fractions αs1, β, αs2 and κ-CN was demonstrated in donkey's milk (Chianese et al., Reference Chianese, Calabrese, Ferranti, Mauriello, Garro, De Simone, Quarto, Addeo, Cosenza and Ramunno2010), as well as in the horse (Ochirkhuyag et al., Reference Ochirkhuyag, Chobert, Dalgalarrondo and Haertlé2000) and pony (Miranda et al., Reference Miranda, Mahé, Leroux and Martin2004). The proteomic approach has also allowed characterization of the casein compositional heterogeneity due to post-translational modifications, like phosphorylation (αs1, αs2 and β-CN), glycosylation (κ-CN) and non-allelic forms generated by RNA incorrect splicing (αs1 and β-CN) (Cunsolo et al., Reference Cunsolo, Cairone, Fontanini, Criscione, Muccilli, Saletti and Foti2009a, Reference Cunsolo, Cairone, Saletti, Muccilli and Foti2009b; Chianese et al., Reference Chianese, Calabrese, Ferranti, Mauriello, Garro, De Simone, Quarto, Addeo, Cosenza and Ramunno2010). In particular, the complete primary structure of αs1-casein (202 amino acids, Cunsolo et al., Reference Cunsolo, Cairone, Fontanini, Criscione, Muccilli, Saletti and Foti2009a), β (226 amino acids, Cunsolo et al., Reference Cunsolo, Cairone, Saletti, Muccilli and Foti2009b) and αs2 (221 amino acids, Chianese et al., Reference Chianese, Calabrese, Ferranti, Mauriello, Garro, De Simone, Quarto, Addeo, Cosenza and Ramunno2010) have been determined. Moreover, the complete sequences of the genes encoding for the β- (CSN2, EMBL No. FN598778), αs1- (CSN1S1, EMBL No. FN386610) and κ-casein (CSN3, Hobor et al., Reference Hobor, Kunej and Dovc2008; FR822990) and the related promoter regions have been determined.
Similarly, two different donkey αs2 encoding genes (CSN1S2 I and CSN1S2 II) have been identified (Cosenza et al., Reference Cosenza, Pauciullo, Annunziata, Rando, Chianese, Marletta, Iannolino, Nicodemo, Di Berardino and Ramunno2010). The first, spanning over a fragment of 1016 nt, is constituted by 19 exons and it encodes for the protein of 221 amino acids (called αs2-I) also characterized by Chianese et al. (Reference Chianese, Calabrese, Ferranti, Mauriello, Garro, De Simone, Quarto, Addeo, Cosenza and Ramunno2010); the second, constituted by 16 exons, probably originated by gene duplication, encodes for a predicted peptide (named αs2-II) of 168 amino acids (Cosenza et al., Reference Cosenza, Pauciullo, Annunziata, Rando, Chianese, Marletta, Iannolino, Nicodemo, Di Berardino and Ramunno2010), not yet detected at proteomic level. Studies on the genetic polymorphism of DM are limited when compared to those carried out in the major dairy species, and it is only recently that researchers have paid particular attention to the proteomic and genomic characterization of proteins in DM. In particular, Criscione et al. (Reference Criscione, Cunsolo, Bordonaro, Guastella, Saletti, Zuccaro, D'Urso and Marletta2009) have identified an individual DM sample lacking αs1-casein, like in goats, known as the species expressing the highest genetic variability for this casein fraction (Cosenza et al., Reference Cosenza, Pauciullo, Gallo, Colimoro, D'avino, Mancusi and Ramunno2008). In addition, Chianese et al. (Reference Chianese, Calabrese, Ferranti, Mauriello, Garro, De Simone, Quarto, Addeo, Cosenza and Ramunno2010) have characterized a genetic variant of β-casein having a molecular weight value 28 mass units higher than the common β-CN phenotype. Finally, regarding the CSN3 and CSN1S2 I genes, the analysis of nucleotide sequences has allowed the identification of several silent and missense polymorphisms (Hobor et al., Reference Hobor, Kunej and Dovc2008; Cosenza et al., Reference Cosenza, Pauciullo, Annunziata, Rando, Chianese, Marletta, Iannolino, Nicodemo, Di Berardino and Ramunno2010). On the contrary, no studies have been carried out on the expression of casein genes in the donkeys, as well as on their translational efficiency, whereas cattle, sheep, goat (Bevilacqua et al., Reference Bevilacqua, Helbling, Miranda and Martin2006), buffalo (Cosenza et al., Reference Cosenza, Pauciullo, Coletta, Di Francia, Feligini, Gallo, Di Berardino and Ramunno2011) and yak (Bai et al., Reference Bai, Yin, Jiang, Ajayi, Zhao, Lu, Zhao and Imumorin2013) data have been reported.
The hypothesis of our study was that in donkey, similarly to what is observed in ruminants, a significant difference in the translation efficiency characterizes the genes encoding the four caseins. In order to verify such hypothesis, we evaluated the expression of the four casein fractions in DM taking into account the phenotypic and genotypic aspects. The protein quantification of αs1, αs2, β and κ-CN was carried out by means of electrophoresis at alkaline pH and immunoblotting with polyclonal antibodies coupled to densitometry analysis. The quantitative determination of the four casein mRNAs was assessed by RT-qPCR and their translation efficiency was estimated through the percentage ratio of single milk casein fractions/single percentage of transcripts.
Materials and methods
Donkey milk sampling and casein extraction
Individual milk samples from 8 donkeys of Martina Franca breed were collected in the same farm (Aquila, Italy). Martina Franca are large-sized donkeys that originated in the Apulia region in the South-East of Italy. In the past, the Martina Franca donkey breed has been considered useful for the production of hybrids. Currently in Italy, the breed is used mainly in an amateur context, although different potential uses (recreational, pet therapy, meat and milk production) are developing. The maximum milk yield per milking corresponds to 700 g (approximately 1.4 l) and regarding milk composition (g/100 g), the maximum values are 0.97 for fat, 1.67 for protein, 6.87 for lactose and 9.05 for SCC (×1000 cells/ml) (D'Alessandro et al., Reference D'Alessandro, Rosanna De Petro, Claps, Pizzillo and Martemucci2009). All donkeys were free of clinical mastitis and were comparable for age (about 6 years old), lactation and parity order. Each casein sample was prepared by acid precipitation from skimmed milk, as described by Aschaffenburg and Drewry (Reference Aschaffenburg and Drewry1959).
Quantitative determination of the nitrogen fractions (TN, SN, CN, NPN) in donkey milk
The total nitrogen in DM was determined by Kjeldahl method according to the IDF Method (1993). A nitrogen protein conversion factor of 6.38 was used in all cases. All samples were analyzed in triplicate and results presented as means ± standard deviations.
Urea polyacrylamide gel electrophoresis (Urea-PAGE) at pH 8.6 and immunoblotting analysis
Urea- PAGE at pH 8.6 and the immunoblotting analysis were carried out according to the procedure described by Chianese et al. (Reference Chianese, Quarto, Pizzolongo, Calabrese, Caira, Mauriello, De Pascale and Addeo2009), using polyclonal antibodies against bovine peptides αs1-CN (187-199) and β-CN (195-199) and porcine κ and αs2-CN. Each casein fraction were analyzed from the Coomassie blue stained gel pattern by scanning with an Ultroscan XL enhanced laser densitometer equipped with the software supplied by the manufacturer (Amersham Biosciences AB, Uppsala, Sweden). Chemicals, the distribution of nitrogenous components, sample preparation and conditions of the immunoelectrophoresis analysis were reported in Supplementary materials.
RNA analysis
Total RNA was isolated from somatic cells present in the eight representative fresh milk samples using Nucleospin Blood and NucleoSpin® Extract Kits (Macherey-Nagel). The quantity, quality, purity and integrity of RNA, after DNase treatment, were estimated by means of Thermo Scientific NanoDrop 2000c and by electrophoresis on a denaturing agarose gel. Reverse-Transcription reaction mix, quantitative PCR amplification mix, thermal condition and primers sequences are reported in online Supplementary Methods and Supplementary Table S1.
Results and discussion
Quantitative analysis of the nitrogen fractions (TN, SN, CN, NPN) in donkeys' milk
In the individual donkey milks analyzed, the average protein content was 1.48% ± 0.2, ranging between 1.10 and 1.81% (Supplementary Table S2) consistent with data reported by Salimei et al. (Reference Salimei, Fantuz, Coppola, Chiofalo, Polidori and Varisco2004) and Guo et al. (Reference Guo, Pang, Zhang, Zhao, Chen, Dong and Ren2007). In particular, the average content of caseins (34.61%) and whey proteins (49.80%), with a casein to whey proteins ratio of 0.69, showed remarkable differences in comparison with bovine and other ruminant milks but were within the range of donkey's milk variability, reported in literature (Salimei et al., Reference Salimei, Fantuz, Coppola, Chiofalo, Polidori and Varisco2004; Guo et al., Reference Guo, Pang, Zhang, Zhao, Chen, Dong and Ren2007). The one exception was CN content being lower than that reported by Guo et al. (Reference Guo, Pang, Zhang, Zhao, Chen, Dong and Ren2007) for Chinese donkey milk. The high NPN content (15.55%) was very close to that of human and mare's milk (Malacarne et al., Reference Malacarne, Martuzzi, Summer and Mariani2002). The nutritional and biological significance of this milk fraction is still far from being completely understood, but it seems to be related to the development of the infant (Lonnerdal, Reference Lonnerdal and Raiha1994). It has been suggested that the high amount of whey protein (49.81%) in donkey's milk, similar to mare's milk, may make it more favorable for human nutrition than cow's milk, because of the relatively higher acute postprandial availability of essential amino acids.
Qualitative and quantitative characterization of donkey's caseins by Urea-PAGE at pH 8.6, immunoblotting and densitometry analysis
The individual casein samples analyzed by Urea-PAGE at pH 8.6 and shown in Fig. 1, were stained with either Coomassie Brilliant Blue (CBB) or specific polyclonal antibodies against αs2, αs1, β and κ-CN to identify each casein fraction in the electrophoretic pattern. In the Urea-PAGE profiles, at least three components exhibiting the highest mobility toward the anode and migrating head αs1-CN were detected as αs2-CN after immunoblotting; each component accounted for 10, 11 and 12 P/mole as previously reported (Chianese et al., Reference Chianese, Calabrese, Ferranti, Mauriello, Garro, De Simone, Quarto, Addeo, Cosenza and Ramunno2010). The αs1-CN fraction showed a complex heterogeneity, after immunostaining with specific antibodies, since five main components were identified as αs1-CN, exhibiting an intermediate anodic mobility between donkey β- and αs2-CN. The compositional heterogeneity of donkey αs1-CN could be due to different phosphorylation degree of its components as well as the presence of deleted forms (Cunsolo et al., Reference Cunsolo, Cairone, Fontanini, Criscione, Muccilli, Saletti and Foti2009a), as in mare counterparts (Miranda et al., Reference Miranda, Mahé, Leroux and Martin2004; Mateos et al., Reference Mateos, Miclo, Molle, Dary, Girardet and Gaillard2009) as well as in ruminants (Martin et al., Reference Martin, Ferranti, Leroux, Addeo, Fox and McSweeney2003). After immunodetection the β-CN was constituted of two/three main components, differing for the phosphorylation degree (5, 6 and 7 P/mole) (Chianese et al., Reference Chianese, Calabrese, Ferranti, Mauriello, Garro, De Simone, Quarto, Addeo, Cosenza and Ramunno2010), as found in mare's milk also (Girardet et al., Reference Girardet, Miclo, Florent, Mollè and Gaillard2006).
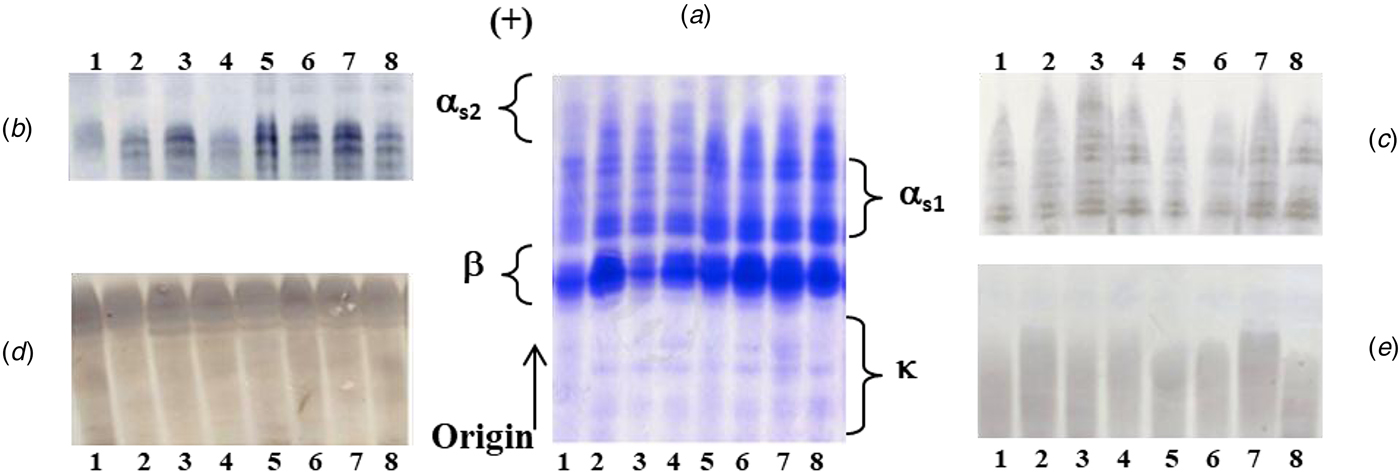
Fig. 1. PAGE analysis at pH 8.6 of the donkey's casein samples, after CBB staining (A) and identification of the four casein fractions by immunoblotting with polyclonal antibodies against αs2 (B), αs1 (C), β(D) and κ-CN (E).
The electrophoretic profiles stained with CBB were quantitatively evaluated by densitometric analysis. Taking into account the high intensity of electrophoretic bands, the donkey β-CN may be the most abundant casein fraction. Finally, the CBB stained bands, characterized by a lower negative charge than β-CN, were identified after immunoblotting as κ-CN, without overlapping with the other casein fractions. It is known that κ-CN components exhibited a weak intensity to CBB, both owing to the poor susceptibility of this fraction to staining and low content in the casein micelle.
After densitometric analysis, β-CN was by far the most abundant casein fraction (54.28% ± 5.68), followed by αs1-CN (35.59% ± 5.06), a composition certainly closer to that of human than cow's milk. This latter, in fact, is rich in αs1 and αs2-caseins, that are lacking or present in traces in breast milk. The allergenic advantage of non-bovine milks, such as goat's and now donkey's milk, might be attributed to this difference (Bevilacqua et al., Reference Bevilacqua, Martin, Candalh, Fauquant, Piot, Roucayrol, Pilla and Heyman2001). The amounts of αs2-CN (7.19% ± 2.55) and κ-CN (2.79% ± 0.85) were the lowest among casein fractions. However, it is well known that these latter casein fractions represent the minor components also in the horse (Miranda et al., Reference Miranda, Mahé, Leroux and Martin2004). In Table 1, the percentage and relative amounts of each casein fraction in donkey were reported in comparison with pony horse, goat, yak, cattle, buffalo and camel milk.
Table 1. Total casein and caseins' fraction content in DM in comparison with pony horse, cattle, buffalo, goat, yak and camel milk

a Present work.
b Miranda et al. (Reference Miranda, Mahé, Leroux and Martin2004).
c Cosenza et al. (Reference Cosenza, Pauciullo, Coletta, Di Francia, Feligini, Gallo, Di Berardino and Ramunno2011).
e Kappeler et al. (Reference Kappeler, Farah and Puhan1998).
Compared with ruminants' milk, the relatively low level of caseins observed in DM coupled with the low protein content may be responsible for the soft curd produced in the stomach. A similar condition was observed also in goat carriers of defective alleles. Goat milk lacking the αs1-CN has poor coagulation properties in comparison with milk containing αs1-CN, and it also decreases intestinal and systemic sensitization to β-lactoglobulin in guinea pigs (Bevilacqua et al., Reference Bevilacqua, Martin, Candalh, Fauquant, Piot, Roucayrol, Pilla and Heyman2001).
Although with different values, the trend of the casein fraction content in donkey (β > αs1 > αs2 > κ) is similar to that observed for camel (Kappeler et al., Reference Kappeler, Farah and Puhan1998), but different from those observed for horse, yak and goat (β > αs1 > κ > αs2) (Miranda et al., Reference Miranda, Mahé, Leroux and Martin2004; Bevilacqua et al., Reference Bevilacqua, Helbling, Miranda and Martin2006; Bai et al., Reference Bai, Yin, Jiang, Ajayi, Zhao, Lu, Zhao and Imumorin2013), cattle (β = αs1 > αs2 > κ) (Miranda et al., Reference Miranda, Mahé, Leroux and Martin2004) and buffalo (β > αs2 > αs1 > κ) (Cosenza et al., Reference Cosenza, Pauciullo, Coletta, Di Francia, Feligini, Gallo, Di Berardino and Ramunno2011).
These data confirm that the casein-type composition (as well as the protein/fat ratio) varies between different dairy animals, and the physicochemical properties of the milk depend on it, both contributing to the functionality of milk and playing an important role in cheese making (Roncada et al., Reference Roncada, Piras, Soggiu, Turk, Urbani and Bonizzi2012). It is well-known that the different proportion of casein fractions, besides genetic variants and post-translational modifications of caseins family, directly affect the conformation and the sizes of the micelles in the milk from different dairy animals and, consequently the technological properties.
Transcripts quantification and translation efficiency
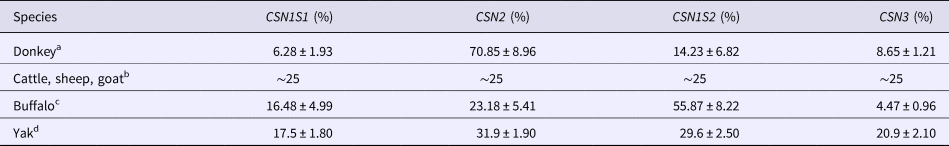
In order to quantify the mRNA transcribed from the casein genes of eight lactating donkeys, we used a RT-qPCR approach using the 18S rRNA as housekeeping gene and a standard curve for a complete quantification of transcripts. The obtained results show that the average percentage of donkey casein transcripts were 6.28, 70.85, 14.23 and 8.65 for CSN1S1, CSN2, CSN1S2 I and CSN3, respectively (Table 2). These values are somewhat different from that observed for the transcripts of homologous genes in buffalo species from Cosenza et al. (Reference Cosenza, Pauciullo, Coletta, Di Francia, Feligini, Gallo, Di Berardino and Ramunno2011), in yak (Bai et al., Reference Bai, Yin, Jiang, Ajayi, Zhao, Lu, Zhao and Imumorin2013) and in cattle, goat and sheep (Bevilacqua et al., Reference Bevilacqua, Helbling, Miranda and Martin2006). In particular, for the latter four species each casein transcript represents nearly 20–30% of the whole casein transcript population, while the incidence rate of buffalo CSN1S1, CSN1S2 transcripts are higher than those observed in the donkey (Table 2).
Table 2. Comparison of average quantitative transcript levels for αs1- (CSN1S1), β- (CSN2), αs2- (CSN1S2) and κ-casein (CSN3) in donkey and in the main ruminant species
a Present work.
b Bevilacqua et al. (Reference Bevilacqua, Helbling, Miranda and Martin2006).
In order to evaluate the translation efficiency of the donkey gene casein transcripts, the ratio between the percentage of single milk casein fractions and the single percentage of transcripts produced in the milk somatic cells has been estimated.
The values obtained show a low translation efficiency for the CSN1S2 I (0.50), CSN3 (0.32) and CSN2 (0.76) transcripts, whereas much higher efficiency (5.66) was found for the CSN1S1. The trend of donkey casein translation efficiency is almost similar to that observed by Bai et al. (Reference Bai, Yin, Jiang, Ajayi, Zhao, Lu, Zhao and Imumorin2013) for the yak (0.30, 0.6, 1.5 and 1.8 for CSN1S2, CSN3, CSN2 and CSN1S1, respectively) and for cattle, goat and sheep by Bevilacqua et al. (Reference Bevilacqua, Helbling, Miranda and Martin2006). In particular, for the latter species β- and αs1- casein mRNA showed the highest translational efficiency, with ratio values 2.5- to 4-fold over the values recorded for αs2- and κ-casein transcripts (Bevilacqua et al., Reference Bevilacqua, Helbling, Miranda and Martin2006). These results differ from those obtained in river buffalo, where CSN3 (2.69), CSN2 (2.39) and CSN1S1 (1.31) are characterized by a higher translation efficiency, while CSN1S2 showed the lowest value (0.25) (Cosenza et al., Reference Cosenza, Pauciullo, Coletta, Di Francia, Feligini, Gallo, Di Berardino and Ramunno2011).
The molecular mechanisms responsible for the observed differences in the individual transcript efficiency can be different. Each mRNA is represented by various sequence-derived and functional features related to translation. In order to investigate whether the mRNA sequences might be responsible for the observed differences, a comparison of nucleotide sequences with the Kozak consensus sequence (GCCA/GCCAUGG) was accomplished. Kozak consensus sequence is an element highly conserved in the eukaryotic genomes, which represents the most efficient context for the correct translation initiation (Kozak, Reference Kozak1994). In particular, more the sequence around the initiation codon is homologous to the Kozak sequence (i.e., ‘strong’ consensus), higher should be the efficiency of mRNA translation (Kozak, Reference Kozak1984). The sequence comparison of the four casein transcripts in donkey (Table 3) showed for the CSN2, CSN1S2 I and CSN3 mRNAs the highest homology with the Kozak sequence. In particular, CSN2 is characterized by four conservative nucleotides (−5, −3, −2 and −1) directly upstream of the initiation (nucleotide ‘A’ in AUG is numbered +1 and the number increases further downstream). Three of them (−3, −2 and −1) are consecutive residues, similar to CSN1S2 I, while CSN3 is characterized by a tandem conservative nucleotides (−2, −3 and −5, −6). On the contrary, CSN1S1 showed the worst combination. Despite three nucleotides match with the consensus sequence, these are not consecutive (−5, −3 and −1) and, therefore, it can be considered as a ‘weak’ context (Table 3).
Table 3. Comparison of start codon flanking sequences of the 4 casein transcripts in donkey

a The start codon (AUG) in the four casein transcripts is underlined.
b Kozak consensus sequence = the optimal context for initiation of translation in mammals. CSN2, CSN1S2 I, CSN1S1 and CSN3 are the genes encoding β, αs2, αs1 and κ-casein, respectively.
These observations are, apparently, in contradiction with the values obtained for the efficiency of translation. However, it is worth noting that donkey CSN2, CSN1S2 I and CSN3 are each characterized by a single nucleotide substitution with respect to the canonic Kozak sequence, such as the G→T in position −6 for CSN2, G→A in position −6 and C→T in position −5 for CSN1S2 I and C→G in position −1 for CSN3 (Table 3). Different studies demonstrated that mutations in these positions of the Kozak consensus site decreased the efficiency of translation, thus confirming the hypothesized key role of the nucleotides −6, −5 and −1 in the optimization of the translation process (Afshar-Kharghan et al., Reference Afshar-Kharghan, Li, Khoshnevis-Asl and Lopez1999; Usuki and Maruyama, Reference Usuki and Maruyama2000; De Angioletti et al., Reference De Angioletti, Lacerra, Sabato and Carestia2004). For example, the G localized in position −6 with respect to the AUG, is present in 44% of the 699 vertebrate mRNA sequences analyzed (Kozak, Reference Kozak1987). This high conservation suggests that the G at position −6 is also important in the initiation of translation (De Angioletti et al., Reference De Angioletti, Lacerra, Sabato and Carestia2004). An outstanding example exists in rabbit, where the substitution of the G at −6 with a T in the β-globin 5′UTR reduced the efficiency of the translation initiation process in vitro (Kozak, Reference Kozak1994). In addition, in human, in vitro transcription/translation experiments demonstrated that the substitution of −6G with a C decreased the efficiency of translation of the β-globin chain by about 30% translation (De Angioletti et al., Reference De Angioletti, Lacerra, Sabato and Carestia2004).
Similarly, a polymorphism 5 bp upstream of the initiation codon in the Kozak sequence directly influenced the CSN1S2 translation in Norwegian Red cattle (Sodeland et al., Reference Sodeland, Grove, Kent, Taylor, Svendsen, Hayes and Lien2011). Furthermore, in mouse and human, a SNP at position −1 is associated with a significant reduction of CD40 gene product and with a reduction in the translation efficiency (Jacobson et al., Reference Jacobson, Concepcion, Oashi and Tomer2005; Pineda et a l., Reference Pineda, Laporta, Hermenegildo, Cano and García-Pérez2008), analogous to what we observed for donkey CSN3. Mechanistically, SNPs occurring at position −1 of the Kozak consensus sequence would interfere with the ability of the ribosome to initiate translation, although not affecting the ability of RNA polymerase to transcribe mRNA (Jacobson et al., Reference Jacobson, Concepcion, Oashi and Tomer2005).
The ORF length is another element potentially affecting the translation efficiency. Valleriani et al. (Reference Valleriani, Zhang, Nagar, Ignatova and Lipowsky2011) demonstrated that the translational ratio decreases with increasing mRNA length. In this respect, the calcium-sensitive casein genes in donkeys showed a higher translation efficiency of the CSN1S1 vs. CSN2 and CSN1S2 I genes, which is consistent with the length of their coding sequence: 212 codons (GenBank FN386610) vs. 241 (GenBank FN598778) and 236 (GenBank FM946022), respectively. Therefore, based on these data, it is reasonable to suppose that the reduced ORF length counteracts the negative effect of the ‘weak consensus site’ and the impact of the SNP in position −6 on the CSN1S1 translation efficiency.
The coding region length could also explain some of the differences in translation efficiency observed among the species. Donkey CSN1S2 I and CSN2 transcripts, which show a lower translation efficiency than the homologous genes in ruminants, are characterized by a higher coding sequence length. In particular, 236 codons for the donkey CSN1S2 I vs. 223 of goat and sheep (GenBank NM_001285585, NM_001009363, respectively) and vs. 222 of cattle, buffalo and yak (GenBank NM_174528, FM865618 and XP_014335716, respectively). Similarly, 241 codons for the donkey CSN2 vs. 222 for goat (AJ011018) and sheep (NM_001009373), vs. 224 for cattle (KC993858), buffalo (FM946182) and yak (ELR51814).
A common feature in all species examined is the relatively low efficiency of translation of CSN1S2 compared to CSN2. The analysis of the mammary tissue collected from yak, goats, sheep and cows has revealed that CSN2 and CSN1S2 mRNA are expressed at similar levels, but the β-casein accumulation in milk is 4–5 times that of the αs2-casein (Bevilacqua et al., Reference Bevilacqua, Helbling, Miranda and Martin2006; Bai et al., Reference Bai, Yin, Jiang, Ajayi, Zhao, Lu, Zhao and Imumorin2013). In the mammary tissue of water buffalo, the CSN2 and CSN1S2 represent 23 and 56% of casein transcripts, respectively, while their corresponding protein concentrations in milk are 54 and 5%, respectively, of total caseins, indicating approximately 10-fold more efficient translation of CSN2 (Cosenza et al., Reference Cosenza, Pauciullo, Coletta, Di Francia, Feligini, Gallo, Di Berardino and Ramunno2011). Analogously, in donkey lactating mammary gland the CSN2 and CSN1S2 I transcripts represent respectively 70.85 and 14.23% of the total casein mRNAs, while the corresponding protein concentration is 54.28 and 7.19% respectively, with a greater CSN2 translation efficiency of about 1.5 times. In the bovine species, Kim et al. (Reference Kim, Yu, Bag, Bakovic and Cant2015) show that the usage of the last 28 codons of CSN1S2 is the main regulatory element attenuating its expression, and it is responsible for the differential translational expression of the CSN1S2 and CSN2. In particular, the authors reported that the codon usage and order influenced the accuracy and the speed of translation.
Although the analysis of the sequences flanking the start codon, codon usage frequencies and the coding sequence length can help to formulate hypotheses concerning some of the observed differences in translation efficiency, other elements need to be analyzed to fully understand the regulation mechanisms of their expression. Factors like gene ontology enrichment scores, biochemical and physicochemical features, minimum free energy, 5′UTR and 3′UTR length, number of transcription factors known to bind the promoter region, number of RNA binding proteins known to bind its mRNA product, protein abundance, mRNA and protein half-life, might affect gene expression (Huang et al., Reference Huang, Wan, Xu, Zheng, Feng, Li, Kong and Cai2011). By simultaneously measuring translational efficiencies (thus indirectly levels of protein synthesis) and mRNA abundance, global analyses have shown evidence of significant mRNA destabilization and translational repression. Since only slightly more translational repression is observed than mRNA destabilization, it is possible that most of the loss in protein synthesis could directly result from effects on mRNA stability (Djuranovic et al., Reference Djuranovic, Nahvi and Green2012).
Conclusions
DM was characterized by a lower protein content with respect to ruminants milk and the different proportions of caseins were closer to the human casein-type composition. β-CN was predominant with respect to the alpha (s1), which may reduce allergenicity. This compositional feature might be responsible for the soft curd produced in the stomach, determining a better digestibility of DM than cow's milk. Moreover, the casein composition of DM could also be decisive for using it as a substitute when breast-feeding is not possible.
The results obtained showed also a significant difference in the expression of donkey casein genes, which revealed dissimilar patterns in comparison to those of the main species of ruminants (cattle, buffalo, sheep, goats and yak). These data represent an important first step in the understanding of the mechanisms regulating the expression of these genes in donkeys aimed at improving the milk production, which fulfill special consumer requirements.
Supplementary material
The supplementary material for this article can be found at https://doi.org/10.1017/S0022029919000256
Acknowledgements
Supported by the Italian Ministry of Agricultural and Forestry Policies (SELMOL project).
Conflict of interest
None of the authors have any conflict of interest to declare.


