


Most Dutch dairy herds rear their own replacement heifers. The costs of rearing them range from €1400 to €1700 per heifer (Mohd Nor et al. Reference Mohd Nor, Steeneveld, Mourits and Hogeveen2012). From an environmental point of view, additional replacement heifers reared could cause more nitrate leaching in the soil (Mourits et al. Reference Mourits, Berentsen, Huirne and Dijkhuizen2000) as well as increase the emission of greenhouse gases, mostly methane (Bell et al. Reference Bell, Wall, Russell, Simm and Stott2011). Therefore, a reduction in the number of replacement heifers needed will have positive economic and environmental consequences.
The need for replacement heifers in Dutch dairy herds is normally closely related to the culling rate of dairy cows. Therefore, culling rates provide insights on the number of replacement heifers needed. By definition, culling rate describes the percentage of cows removed from a herd because of sale, slaughter, salvage or death (Fetrow et al. Reference Fetrow, Nordlund and Norman2006). The annual culling rate in the Netherlands and UK was reported to range from 21 to 30% (Sol et al. Reference Sol, Stelwagen and Dijkhuizen1984; Bell et al. Reference Bell, Wall, Russell, Roberts and Simm2010) while in the United States, the annual culling rate among herds ranged from 34 to 36% (Smith et al. Reference Smith, Ely and Chapa2000).
There are abundant studies that describe the reasons for culling. Culling a dairy cow was found to be associated with reproductive status and disorders (Stevenson & Lean, Reference Stevenson and Lean1998; Schneider et al. Reference Schneider, Strandberg, Emanuelson, Grandinson and Roth2007; De Vries et al. Reference De Vries, Olson and Pinedo2010), milk yield (Pinedo et al. Reference Pinedo, De Vries and Webb2010) and health related conditions such as ketosis, milk fever, retained placenta, metritis, lameness, teat injuries and mastitis (Gröhn et al. Reference Gröhn, Eicker, Ducrocq and Hertl1998; Rajala-Schultz & Gröhn, Reference Rajala-Schultz and Gröhn1999a; Chiumia et al. Reference Chiumia, Chagunda, Macrae and Roberts2013). These associations are known to differ with variation in age, parity and stage of lactation of the dairy cow (Seegers et al. Reference Seegers, Beaudeau, Fourichon and Bareille1998; Rajala-Schultz & Gröhn, Reference Rajala-Schultz and Gröhn1999a). Reasons for culling a dairy cow may also differ according to culling policy in a herd owing to herd factors. For example, high milk production herds are protective against culling (Pinedo et al. Reference Pinedo, De Vries and Webb2010). In contrast, in high-producing herds more culling was observed (Smith et al. Reference Smith, Ely and Chapa2000). This latter study is, however, one of the few studies that were found on the association between culling rate of the herd and herd level management factors (Batra et al. Reference Batra, Burnside and Freeman1971; Smith et al. Reference Smith, Ely and Chapa2000). Almost all studies on culling are on risk factors for individual cows within the herd. The association between culling rate and herd reproduction, herd performance, herd health and herd biosecurity is still unclear. This type of knowledge is useful to advise herd managers on an optimal culling rate and on the associated need for the number of rearing heifers needed.
The first objective of this study was to create insights into the average culling rates over the years 2007 to 2010 and their variation within Dutch dairy herds. The second objective was to determine the association between the average culling rate for slaughter/death over the years 2007 to 2010 with herd characteristics (e.g. herd size), herd reproduction characteristics (e.g. calving interval and first calving age), herd performance characteristics (e.g. 305-d milk, protein and fat production, lifetime milk production and age) and herd health characteristics (e.g. average SCC and percentage of dairy cows with claw problems).
Materials and methods
Available data
Data from 2000 Dutch dairy herds that were randomly selected were obtained from the Cattle Improvement Cooperative (CRV, Arnhem, the Netherlands) and included information at animal and herd level over the years 2007–2010. For each year, the animal level data contained, for each herd, animal identification and registration information, including birth dates, arrival dates, calving dates, culling dates and death dates for all animals present in the herd. Information on parity, sex and breed of all individual animals within farms was also available. The animal level data was used to calculate the average culling rate which is described in the section culling rates. For the herd level, the data included herd characteristics, herd reproduction characteristics, herd performance characteristics and herd health characteristics. A detailed description of the available herd level data is given in the section about the herd level independent variables.
Data editing
Based on the years 2007–2010, four datasets were created and edited separately. After thorough examination, using animal level data, some herds were removed from the dataset. There were 30 herds in the 2007 dataset, 28 herds in the 2008 dataset, 33 herds in the 2009 dataset and 37 herds in the 2010 dataset that were assumed to be trading herds or herds that quit, that is, herds that had more than 90% of dairy cows culled, slaughtered or dead on the same date. In addition, there were 41 herds in the 2007 dataset, 21 herds in the 2008 dataset, 11 herds in the 2009 dataset and 53 herds in the 2010 dataset removed as they did not cull any female dairy cows. Next, the data on herd level, that is, the herd size of each year was used to remove herds. Fifty-two herds in the 2007 dataset, 63 herds in the 2008 dataset, 68 herds in the 2009 dataset and 17 herds in the 2010 dataset were removed as they did not have information about herd size which is essential information when studying culling rates. Finally, 9 herds in the 2007 dataset, 6 herds in the 2008 dataset, 3 herds in the 2009 dataset and 10 herds in the 2010 dataset, were removed because of a herd size less than 30 dairy cows. After exclusion of these herds, there were 1868 herds in the 2007 dataset, 1882 herds in the 2008 dataset, 1885 herds in the 2009 dataset and 1883 herds in the 2010 dataset. After merging the datasets of different years, the final dataset contained 1903 herds. Within that dataset, 1835 herds have data for 4 years, 50 herds have data for 3 years, 12 herds have data for 2 years and six herds have data for only 1 year. Data editing was performed using Statistical Analysis System (SAS) version 9.2 (SAS, 2008).
Culling rates
Overall culling in this study was defined as dairy cows that were sold, slaughtered, salvaged or died, similar to the definition used by Fetrow et al. (Reference Fetrow, Nordlund and Norman2006). By using the animal level data, within the 1903 dairy herds, the dates of culling of individual dairy cows were used to determine whether they were culled in 2007, 2008, 2009 or 2010. In addition, they had to be female dairy cows that had at least one calving. The overall culling rate of each year for each herd was calculated as the total number of culled dairy cows divided by herd size of each year (Toma et al. Reference Toma, Vaillancourt, Dufour, Eloit, Moutou, Marsh, Bénet, Sanaa, Michel, Kass and Bigras-Poulin1999). For each herd, the overall culling rate was averaged over 4 years. Then, the average culling rates for slaughter/death and the average culling rates for sale for each herd were calculated separately for each year. To define culling for slaughter/death, within a year the dates of slaughter/death of a cow were compared with their culling dates to determine whether they were slaughtered or died immediately after culling or not. If the difference between the date of slaughter/death and the date of culling was less than or equal to 30 d, the cause of culling was assumed to be slaughter/death. If the difference between the date of slaughter/death and the date of culling was more than 30 d, the cause of culling was assumed to be sale. Also, when there was no date of slaughter/death available, the cause of culling was assumed to be sale. For each herd, culling rates for slaughter/death and for sale were averaged over 4 years.
Herd-level independent variables
Data on herd characteristics included herd size (these data were also provided for 2006). Additionally, three new variables were created for herd characteristics: openness, rearing own young stock and change in herd size in current year as compared with its previous year. To establish whether the herds were of different size or not as compared with the previous year, the herd size in current year minus herd size in previous year, divided by herd size in current year was calculated. The variable was categorised into three groups; herd size remained the same (within and equal ±5%), herd size increased by more than 5% and herd size decreased by more than 5%. To define open and closed farms within a particular year, closed farms were those buying on average fewer than or equal to 1% of animals in a year and open farms were those buying more animals than that. Within a particular year, herds that reared their own young stock were defined as being those that sold fewer than 80% of their female born calves, while herds not rearing their own young stock sold at least 80% of their female born calves and bought dairy cows of an age of at least or more than 550 d.
Data on the average herd performance characteristics were given in two groups: dairy cows that were still present in the herds and culled dairy cows. For dairy cows that were still present on the herd data on 305-d milk, fat and protein production were available. For both groups data on lifetime milk production, productive life and age were available. For each herd, herd performance characteristics were averaged over the 4 years.
Data on the average herd reproduction characteristics were first-calving age and calving interval. In addition, the percentage of non-return to oestrus at 56 d and the number of inseminations needed per cow present on the farm were available. For each herd, herd reproduction characteristics were averaged over the 4 years.
Data on the average herd health characteristics regarding udder health included SCC, the percentage of dairy cows with high SCC and the percentage of dairy cows with new high SCC. High SCC was defined as SCC that is, for first parity cows, over 150 000 cells/ml and over 250 000 cells/ml for older dairy cows, which are thresholds used in the Netherlands (De Vliegher et al. Reference De Vliegher, Barkema, Stryhn, Opsomer and de Kruif2004; Huijps et al. Reference Huijps, De Vliegher, Lam and Hogeveen2009). The new high SCC was used to give a measure of recent udder infections and was defined as dairy cows having at least once a high SCC after a low SCC in the previous test day. In the Netherlands, approximately 5% of all dairy herds participate in the claw health programme. Within this programme, during routine claw trimming, the claws are observed and any claw problems such as sole bleeding, digital dermatitis, interdigital dermatitis, sole ulcer, interdigital hyperplasia and white line are reported for individual dairy cows. For this study, information on first parity and older dairy cows with claw problems were available for 157 herds. For each herd, herd health characteristics were averaged over the 4 years.
Data analysis
The analysis of the association between average culling rate for slaughter/death and herd-level characteristics, reproduction, performance and health was performed with a mixed model using PROC MIXED using Statistical Analysis System (SAS) version 9.2 (SAS, 2008) with herd as a random effect, assuming normality of residuals. Univariate analyses were performed to select independent variables possibly associated with average culling rate for slaughter/death with a P⩽0·25 based on F test. Collinearity was checked among these selected independent variables, where variables with Pearson correlation >0·8 or <−0·8 were considered as highly correlated. Owing to high correlations, four herd variables were excluded, productive life of dairy cows present in the herd, productive life of culled dairy cows (correlations with age and lifetime milk production of dairy cows present in the herd and culled dairy cows, respectively), percentage of non-return to oestrus in 56 d (correlations with number of inseminations) and percentage of dairy cows with high SCC (%) [correlations with average SCC and percentage of dairy cows with new high SCC (%)]. The selected independent variables were included in the multivariate model. The multivariate model was built using a backward selection procedure. In each step, the independent variable with the lowest significance level was excluded until all independent variables in the final multivariate model had the lowest significant value (P value <0·05). The overall model fit was assessed by graphical examination of residuals and the Kolmogorov–Smirnov test, looking for outliers and checking for homoscedasticity.
Results
The overall culling rate of the 1903 herds was on average 29·6% (sd±6·5) and ranged between 12·4 and 63% (Table 1). It consisted of the culling rate for slaughter/death which was on average 25·4% (sd±6·3; range 6·2 to 56·5%) (Table 1) and the culling rate for sale which was on average 4·2% (sd±5·3; range 0·0 to 42·3%) (Table 1). For the years 2007, 2008, 2009 and 2010, the overall culling rate was on average 27% (sd±9), 28% (sd±9), 32% (sd±10) and 32% (sd±9), respectively. The culling rate for slaughter/death for these years was on average 23% (sd±9), 24% (sd±8), 28% (sd±9) and 28% (sd±9), respectively. Also for these years, the culling rate for sale was on average 4% (sd±6), 4% (sd±7), 4% (sd±7) and 4% (sd±6), respectively.
Table 1. The descriptive statistics of the average culling rates over the years 2007 to 2010 and the average herd level variables for each herd over the years 2007 to 2010

The variation in average culling rate for slaughter/death among 1903 Dutch dairy herds is shown in Fig. 1.
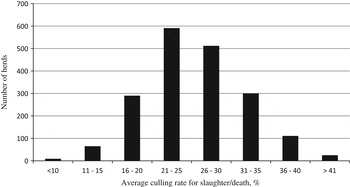
Fig. 1. Distribution of average culling rate for slaughter/death (%) in 1903 Dutch dairy herds over the years 2007 to 2010.
Associations between average culling rate for slaughter/death and the herd-level variables
The results of the univariate analyses are presented in Tables 2 and 3. A higher average culling rate for slaughter/death was shown to have univariate association (P<0·10) with open farms, herds decreasing in size, bigger herd size, longer calving intervals, higher 305-d fat and protein production of dairy cows present in the herd, higher average SCC, and higher percentage of dairy cows with high SCC and new high SCC. A lower average culling rate for slaughter/death was shown to have univariate association (P<0·10) with closed farms, herds increasing in size, higher age, higher lifetime milk production and higher productive life, both for dairy cows that were present and culled in the herds.
Table 2. Results of the univariate analyses on the association between average culling rate for slaughter/death over the years 2007 to 2010 according to categorical herd characteristics

† Reference group
* P value >0·10 using mixed model with herd as random variable
** P value <0·0001 using mixed model with herd as random variable
Table 3. Results of the univariate analyses on the association between average culling rate for slaughter/death over the years 2007 to 2010 and continuous herd-characteristics

The final multivariate model presented in Table 4 showed that the average culling rate for slaughter/death was associated with year, variables of herd characteristics (openness, change of herd size), herd reproduction characteristics (calving interval), herd performance characteristics (dairy cows present on the herds: 305-d protein production, age; culled dairy cows: age) and herd health characteristics [average SCC and new high SCC (%)]. The results showed that, as compared with the year 2010, years 2007 and 2008 were associated with a lower average culling rate for slaughter/death by 3·9% (P<0·0001) and 2·5% (P<0·0001), respectively; while year 2009 was associated with a higher average culling rate for slaughter/death by 0·4% (P=0·1021). The open farms, as compared with the closed farms were associated with a higher average culling rate for slaughter/death by 1·6% (P<0·0001). Herds that increased in size were associated with a lower average culling rate for slaughter/death of 3% (P<0·0001) while herds that decreased in size was associated with higher average culling rate for slaughter/death of 3·7% (P<0·0001), and these were in comparison with herds that remained in the same size. It was also shown that a longer average calving interval by 1 d was associated with a higher average culling rate for slaughter/death of 0·03% (P<0·0001). A higher average 305-d protein production of dairy cows present in the herd by 1 kg, was associated with a higher average culling rate for slaughter/death of 0·05% (P<0·0001). A longer average age of dairy cows that were present in the herd by 1 month was associated with a lower average culling rate for slaughter/death of 0·5% (P<0·0001). Similarly, a longer average age of culled dairy cows by 1 month was associated with a lower average culling rate for slaughter/death of 0·08% (P<0·0001). A higher average SCC of the herd by 1000 cells/ml was associated with a higher average culling rate for slaughter/death of 0·01% (P<0·0001). A higher average percentage of new high SCC by 1% was associated with a higher average culling rate for slaughter/death of 0·18% (P<0·0001).
Table 4. Results of the final multivariate analysis on the association between average culling rate for slaughter/death and herd-level variables over the years 2007 to 2010

Discussion
This study used data from 1903 dairy herds in the Netherlands over the years 2007 to 2010. The herds are representative for Dutch dairy herds as they were randomly selected and the average herd size is comparable to the Dutch population average (CRV, 2010). Additionally, the average 305-d milk production was also comparable to the Dutch population average (CRV, 2010). Within this study, we have calculated the overall culling rate on average as 29·6%, culling rate for slaughter/death on average as 25·4% and culling rate for sale on average as 4·1%. The results showed that the average overall culling rate and the average culling rate for slaughter/death are higher than those reported in the UK (Whitaker et al. Reference Whitaker, Macrae and Burrough2004), similar to the culling rates reported previously in the Netherlands, France and Poland (Sol et al. Reference Sol, Stelwagen and Dijkhuizen1984; Olechnowicz & Jaskowski, Reference Olechnowicz and Jaskowski2011; Raboisson et al. Reference Raboisson, Cahuzac, Sans and Allaire2011) and lower than the annual culling rate in the United States (De Vries et al. Reference De Vries, Olson and Pinedo2010). The results also showed that average culling rate for sale is lower than in the United States (6%) (National Animal Health Monitoring System, 2002). The comparison is however difficult owing to the different definition for the culling rates used in previous studies. The results showed that as compared with the year 2008, in 2009 average culling rate for slaughter/death had a sudden increase to 28%. This sudden increase in average culling rate for slaughter/death might be explained by the lower milk price in 2009 when compared with 2008 (LEI, 2013a). Consequently, it might have caused farmers to cull more underperforming dairy cows owing to reduced gross margin which was shown to be the lowest in 2009 (LEI, 2013b). This study also showed that the average culling rate for slaughter/death varies among the Dutch dairy herds. More than 70% of dairy herds have average culling rate for slaughter/death over the years 2007 to 2010 of less than 30% (Fig. 1). This indicates that there is room for lowering culling rate for slaughter/death.
We used the average culling rate for slaughter/death variable in the analysis to distinguish between cows that were culled for underperformance (e.g. infertile or poor health) and cows that were culled to be milked on another farm. Sometimes, a distinction is made between voluntary and involuntary culling. However, we were not able to distinguish these features on the basis of our data because the reasons for culling dairy cows were not available. Moreover, the terminology voluntary vs. involuntary culling leaves much room for misinterpretation as was indicated by Fetrow et al. (Reference Fetrow, Nordlund and Norman2006).
We found several factors that were associated with average culling rate for slaughter/death. Other herd factors relevant in explaining the association, such as herd structure, herd management, type of replacement and culling policies and socio-psychological profile of the farmer (Beaudeau et al. Reference Beaudeau, Henken, Fourichon, Frankena and Seegers1993) were unfortunately not available in this study.
The results show that lower average culling rate for slaughter/death was associated with higher average age both for dairy cows present in the herds and culled dairy cows and this is to be expected. If the average age of dairy cows in the herd is higher, it means the herds keep their dairy cows longer. Dairy cows could be kept longer if they are fertile (Rajala-Schultz & Gröhn, Reference Rajala-Schultz and Gröhn1999b; Faust et al. Reference Faust, Kinsel and Kirkpatrick2001; De Vries et al. Reference De Vries, Olson and Pinedo2010) or they do not succumb as they age to any health problems (e.g. injury, disease, high SCC) that might cause them to be culled earlier (Seegers et al. Reference Seegers, Beaudeau, Fourichon and Bareille1998; Monti et al. Reference Monti, Tenhagen and Heuwieser1999).
A longer average calving interval of 10 d was associated with a higher average culling rate for slaughter/death of the herd, by 0·2%. A longer average calving interval is associated with reproductive problems, which is an important reason for dairy cows to be culled, as found in previous studies (Bascom & Young, Reference Bascom and Young1998; Bach, Reference Bach2011; Brickell & Wathes, Reference Brickell and Wathes2011). Therefore, it is advisable for farmers to have good herd reproduction management in order to prevent unnecessary culling.
Interestingly, in this study, the average 305-d protein production was retained in the final model but not the other 305-d herd performance characteristics. We could not explain this specific association although, of course, the average 305-d protein production is closely related to both the average 305-d milk and fat production. Why specifically the average 305-d protein production provided a better prediction than the average 305-d milk production is not clear. The relation between 305-d herd performance and average culling rate for slaughter/death (Table 3) is an interesting one and can be explained either by farms that have a higher culling rate having faster genetic progress because of faster follow-up between generations, or by higher 305-d milk production being also associated with more problems (Rauw et al. Reference Rauw, Kanis, Noordhuizen-Stassen and Grommers1998) which might cause more culling.
Herds with a higher average SCC were shown to be associated with a higher average culling rate for slaughter/death and this is an expected result. A higher average culling rate for slaughter/death of the herd by 1% was associated with a 100 000 cells/ml higher in the average SCC. Additionally, the results showed a higher culling rate for slaughter/death of the herd by 2% was associated with a 10% higher percentage of the new high SCC. The SCC is a widely used indicator for subclinical udder problems. In previous studies, high SCC was found to be one of the most common reasons for farmers to cull dairy cows (Faust et al. Reference Faust, Kinsel and Kirkpatrick2001; Brickell & Wathes, Reference Brickell and Wathes2011; Chiumia et al. Reference Chiumia, Chagunda, Macrae and Roberts2013). When high SCC was not a direct reason for culling, poor udder health (high SCC) has been found to increase the likelihood of culling (Hadley et al. Reference Hadley, Wolf and Harsh2006). However, clinical mastitis is regarded to be the main cause for farmers to remove dairy cows from the herd (Gröhn et al. Reference Gröhn, Eicker, Ducrocq and Hertl1998). In the present study, unfortunately information on clinical mastitis was not available.
The average culling rate for slaughter/death was associated with change in herd size. As compared with herds that remained the same size, herds that increased in size had a lower average culling rate for slaughter/death. It seems that when herds are expanding, they will try to keep as many cows as possible. Previous work had shown that during expansion the likelihood of a dairy cow being culled is reduced (Hadley et al. Reference Hadley, Wolf and Harsh2006). Expanding dairy farms also culled fewer dairy cows on the grounds of low milk production, as compared with other involuntary reasons such as reproductive performance, mastitis and high SCC (Faust et al. Reference Faust, Kinsel and Kirkpatrick2001; Weigel et al. Reference Weigel, Palmer and Caraviello2003).
Herds that were open had, on average, a 1·6% higher average culling rate for slaughter/death than herds that were closed. This is not an unexpected result because introduction of new animals in a herd is associated with higher risks of introduction of diseases. This study showed that openness does have an effect on culling, even after correction for udder health.
In conclusion, this study showed that over the years 2007 to 2010 the average overall culling rate based on 1903 Dutch dairy herds was 29·6% (sd±6·5), the average culling rate for slaughter/death as 25·4% (sd±6·3) and the average culling rate for sale as 4·1% (sd±5·3). About 70% of the herds have average culling rate for slaughter/death less than 30%, showing there is room for lowering average culling rate for slaughter/death. This study also showed that a higher average culling rate for slaughter/death is associated with a longer average calving interval, a higher average 305-d protein production, a higher average SCC, a higher percentage of new high SCC, a decrease in herd size, and open farms. Therefore, the average culling rate for slaughter/death is associated with the fertility, udder health and openness of the herd.
The authors would like to acknowledge Universiti Putra Malaysia (UPM), Malaysia for the funding of this project. Also, many thanks go to Cattle Improvement Cooperative (CRV, Arnhem, the Netherlands) for providing the data.


