


Milk fat as the most variable content in milk contains about 70% of saturated fatty acids (SFA) and 30% of unsaturated fatty acids (UFA) (Grummer, Reference Grummer1991). Only 15 of the numerous different fatty acids (FA) have concentrations of more than 1% in milk fat (Jensen, Reference Jensen2002; MacGibbon & Taylor, Reference MacGibbon, Taylor, Fox and McSweeney2006). The milk fatty acid profile is not part of routine DHI analysis at farms today. So far the farm has no information on the different groups of fatty acids nor on contents of single fatty acids on a cow individual basis.
The nutritional and health effects of milk fatty acid composition are intensively discussed since increasing percentages of UFA and especially the appearance of omega-3 fatty acids (e.g. ω3 18:3) and conjugated linoleic acid (CLA) are considered to have positive health effects in human nutrition. SFA in contrast are held responsible for cardiovascular diseases (Parodi, Reference Parodi, Fox and McSweeney2006; Micha & Mozaffarian, Reference Micha and Mozaffarian2010), depending on type of SFA (Iggman & Risérus, Reference Iggman and Risérus2011). Raw milk with specific concentrations of either desired or undesired groups of fatty acids could be rewarded by the milk processors with an adapted payment system. Among others (e.g. metabolic status of cow, stage of lactation, number of lactation, breed, genetics) milk fat concentration and composition are changeable by the feeding diet (Palmquist, Reference Palmquist, Fox and McSweeney2006). A technology which enables rapid analysis of milk fat composition could help to select milk with specific contents of fatty acid groups. Furthermore, the time series of cow individual long chain fatty acid (LCFA) concentration in milk fat in the first weeks of lactation can mirror extent and duration of body fat mobilisation in early lactation stage (Holstermann, Reference Holstermann and Verlag2012), so the same technology could assist early lactation management.
The quantities of fatty acids in milk fat are analysed in general by the highly accurate but also expensive capillary gas chromatography (GC) (ISO, 15885, 2002; MacGibbon & Taylor, Reference MacGibbon, Taylor, Fox and McSweeney2006). New approaches have been developed to estimate milk fat composition along with routine analysis of fat content with mid-infrared (MIR) spectral technology. Soyeurt et al. (Reference Soyeurt, Dardenne, Dehareng, Lognay, Veselko, Marlier, Bertozzi, Mayeres and Gengler2006), Rutten et al. (Reference Rutten, Bovenhuis, Hettinga, van Valenberg and van Arendonk2009) and Soyeurt et al. (Reference Soyeurt, Dehareng, Gengler, McParland, Wall, Berry, Coffey and Dardenne2011) presented results for predicting single FA and groups of different FA with MIR in the wavenumber range 1000 to 5000/cm. Rico et al. (Reference Rico, Marshall, Choi, Kaylegian, Dechow and Harvatine2014) took several subsamples during the milking process, analysed them in laboratory, and evaluated within milking fatty acids profiles during the milking process. The subsamples showed increased concentrations of short chain fatty acids (SCFA) during the main part of milking and less LCFA at the end of milking (Rico et al. Reference Rico, Marshall, Choi, Kaylegian, Dechow and Harvatine2014). Since common analysing methods are intended for laboratory purposes, a technology for rapid FA analysis in milk dedicated as an off-line or in-line analysis on the farm is still missing. An analytical tool based on near infrared spectroscopy (NIRS) with the possibility to analyse milk at-farm or during daily milking routine could provide information on composition of milk and milk fat. The robustness of near-infrared (NIR) equipment makes this technology in general suitable for at-farm applications, off-line after milking or even in-line during the milking process. The analysis of raw milk with NIRS is challenging due to different scattering effects on the NIR spectra besides the influences from chemical bonds (Melfsen et al. Reference Melfsen, Hartung and Haeussermann2012b; Aernouts et al. Reference Aernouts, van Beers, Watte, Huybrechts, Lammertyn and Saeys2015). However, estimating the raw milk contents of fat, protein, lactose, urea and somatic cell count in milk with NIRS was investigated in several studies either in off-line measurement setups (Tsenkova et al. Reference Tsenkova, Atanassova, Toyoda, Ozaki, Itoh and Fearn1999; Reference Tsenkova, Atanassova, Ozaki, Toyoda and Itoh2001; Reference Tsenkova, Atanassova, Morita, Ikuta, Toyoda, Iordanova and Hakogi2006; Schmilovitch et al. Reference Schmilovitch, Shmulevich, Notea and Maltz2000; Chen et al. Reference Chen, Iyo, Terada and Kawano2002; Saranwong & Kawano, Reference Saranwong and Kawano2008; Melfsen et al. Reference Melfsen, Hartung and Haeussermann2012a; Reference Melfsen, Hartung and Haeussermannb) or in in-line applications (Kawasaki et al. Reference Kawasaki, Kawamura, Tsukahara, Morita, Komiya and Natsuga2008; Melfsen et al. Reference Melfsen, Hartung and Haeussermann2012c; Reference Melfsen, Hartung and Haeussermann2013).
Studies on NIR analysis of raw milk to predict milk fat composition in milk are rather rare. In addition, the definition of the groups of fatty acids varies between studies. Nguyen et al. (Reference Nguyen, Dehareng, Hammida, Baeten, Froidmont, Soyeurt, Niemoeller and Dardenne2011) presented NIR prediction results for contents of UFA, SCFA (short chain fatty acids), MCFA (medium chain fatty acids) and LCFA in milk. Coppa et al. (Reference Coppa, Ferlay, Leroux, Jestin, Chilliard, Martin and Andueza2010) showed NIR validation results for different groups of fatty acids (SFA, UFA, trans FA) but also for individual milk FA in liquid milk and oven-dried milk samples. Satisfactory results were achieved for NIR prediction models for groups of fatty acids in liquid milk. The prediction accuracy was strongly improved when analysis was done on oven-dried milk samples. Aulrich & Molkentin (Reference Aulrich and Molkentin2009) discriminated the origin of milk samples from organic and conventional farms with NIRS by predicting FA C18:2 c9, t11, C18:3 ω3 and C20:5 ω3 in milk fat. Next to such preliminary studies, a full spectrum view on the potential of NIRS to predict concentrations of different FA in milk fat is still rare in literature.
The aim of this study was primarily to estimate the accuracy for predicting FA concentration in milk fat, considering either different groups of FA or selected single FA, when using diffuse reflectance NIRS, and secondly to evaluate if the accuracy of this information is sufficient for predicting duration and extent of body fat mobilisation in dairy cows in early lactation stage.
Materials and methods
Milk sampling and reference analysis
Milk samples were collected over a period of 30 weeks at the research dairy farm Karkendamm (University of Kiel, Germany). In total, 2614 milk samples were collected from 33 Holstein cows at four days a week, i.e., two evening and two morning milkings per week (68–96 samples per cow). All 33 cows were in their first lactation and between 4 and 180 d in milk.
Milk samples were taken from composite milk during the milking process (Metatron MB, GEA Farm Technologies, Bönen, Germany). A part of 150 ml of each milk sample was refrigerated for transport directly after sampling and used within the next 4 h for acquiring NIR spectra from fresh samples. An aliquot of 45 ml from all milk samples was conserved with bronopol after sampling and sent to laboratory for analysis of fat content (Milkoscan FT+, Foss-Electric A/S, Hillerød, Denmark). The fat content of these samples was later used for recalculation of FA concentration in milk.
An aliquot of 100 ml of each sample was deep-frozen (−18° C) directly after sampling. These milk samples were held for FA analysis by GC. The samples were later defrosted in a waterbath (40 °C) and homogenised in a dispersion unit (Miccra D-1, ART Prozess- & Labortechnik, Müllheim/Baden, Germany) at 35 000 rpm over 1 min. For the GC analysis, the four milk samples per week per cow were merged to one sample. In case less than four milk samples per week were available (e.g. DIM 4 or DIM 180 is midweek, too little milk available for sampling, defrosting not successful) the remaining samples per week were merged to one sample. In average 3·54 samples per week were merged. Milk fat was extracted from the milk samples according to the Roese-Gottlieb reference method (IDF Standard, 1D, 1996). FA concentrations in milk fat samples (g FA/100 g fat) were determined with GC in the Department of Safety and Quality of Milk and Fish Products at the Max Rubner-Institute (Kiel, Germany). In total, 738 merged samples were used for FA analysis.
FA Methyl Ester (FAME) were derived from milk fat samples by transesterification with sodium methylate. A mixture of 1200 µl n-Heptan, 300 µl of a 10% solution of the milk fat sample in n-Heptan and 30 µl of a methanolic potassium hydroxide solution (2 mol/l) was shaken vigorously in a sample bottle (Vortex Shaker) for 1 min. The sample rested for 5 min, 100 mg sodium hydrogen sulphate were added, the sample was shaken again (1 min) and was then centrifuged (3 min at 1000 g). Finally, 1 ml of the supernatant (approximately 2% FAME in Heptan) was injected with an Agilent 7683B autosampler into the gas chromatograph. FAME analysis was done with an Agilent 7890A gas chromatograph (Agilent Technologies, Santa Clara, CA, USA). Carrier gas was hydrogen with a constant flow rate of 1·35 ml/min. Injector and detector temperature was 255 °C. Oven temperature started at 50 °C during the first minute and was increased by 5 °C per minute to 225 °C, held constant for 3 min, and then was increased by 1 °C per minute to 237 °C. Evaluation of chromatograms was done by Agilent Software EZChrom Elite 3·3·2 (Agilent Technologies, Santa Clara, CA, USA). Reference milk fat CRM 164 (IRMM, Geel, Belgium) was used for calibration of main fatty acids. Fatty acids from C4 to C24 were determined and percentage by weight of total FA was calculated. The detailed procedure for the analysis of FA is described in further detail in Molkentin (Reference Molkentin2009) and Holstermann (Reference Holstermann and Verlag2012). Groups of fatty acids were defined as followed:
SFA: C4:0-C23:0 + C13:0 iso + C13:0 anteiso + C14:0 iso + C15:0 iso + C15:0 anteiso + C16:0 iso + C17:0 iso + C17:0 anteiso + C18:0 iso
UFA: C10:1 + C12:1 + C14:1 + C16:1 t9 + C16:1 c9 + C17:1 + C18:1 t4 + C18:1 t5 + C18:1 t6-8 + C18:1 t9 + C18:1 t10-11 + C18:1 t12-14 + C18:1 t15 + C18:1 t16 + C18:1 c11 + C18:1 c12 + C18:1 c13 + C18:1 c14 + C18:1 c15 + C18:2 t8 c12 + C18:2 t8 c13 + C18:2 t9 t12 + C18:2 c9 t12 + C18:2 c9 t13 + C18:2 c9 t11 + C18:2 c9 c12 + C18:2 t11 c15 + ω6 C18:3 + ω3 C18:3 + C19:1 + C19:2 + C20:2 + C20:3 + C20:4 + C20:5 + C22:1 + C22:5 + C23:1
SMCFA: C6-C14 = C6:0 + C8:0 + C10:0 + C10:1 + C12:0 + C12:1 + C14 iso + C14:0 + C14:1
LCFA: C18iso + C18:0 + C18:1 t4 + C18:1 t5 + C18:1 t6 + C18:1 t8 + C18:1 t9 + C18:1 t10 + C18:1 t11 + C18:1 t12 + C18:1 t14 + C18:1 t15 + C18:1 c11 + C18:1 c12 + C18:1 c13 + C18:1 c14 + C18:1 c15 + C18:1 c16 + C18:2 t8 c12 + C18:2 t8 c13 + C18:2 t9 t12 + C18:2 c9 t12 + C18:2 c9 t13 + C18:2 c9 t11 + C18:2 c9 c12 + C18:2 t11 c15 + ω6 C18:3 + ω3 C18:3 + C19:0 + C19:1 + C19:2 + C20:0 + C20:1 + C20:2 + C20:3 + C20:4 + C20:5 + C21:0 + C22:0 + C22:1 + C22:5 + C23:0 + C23:1
C16 (C16 iso + C16:0 + C16:1 t9 + C16:1 c9) were not considered in the groups of FA due to indeterminate origins from de novo-synthesis in the udder, body fat mobilisation, and feed.
Spectral analysis
Near spectra were obtained from fresh samples. All milk samples were heated in a waterbath (40 °C) before NIR analysis. The whole sample (150 ml) was used to obtain spectra. Layer thickness in the measurement cell was 30 mm. Milk was stirred with nominal rotation speed of 102 rpm while the spectra were acquired. Stirring was done to eliminate additional scattering effects which can arise due to flocculation of fat globules. Spectra were collected in diffuse reflectance mode in the wavelength range of 851–1649 nm with an increment of 2 nm. A diode array spectrometer with an InGaAs detector was used (PSS-1720, Polytec GmbH, Waldbronn, Germany). Three replica spectra were recorded per sample with a time delay of 10 s resulting in one mean spectrum for each milk sample. The dark current was acquired before each measurement, and was subtracted from the sample spectra. An automated white reference spectrum was acquired every 30 min (approx. every 20 samples) for referencing the spectrometer system. Spectra of milk samples were averaged per cow per week (z mean; Eq. (1)) in order to acquire one raw milk spectrum for each FA reference milk sample:
 $$z_{{\rm mean}} = (z_{{\rm d1}} + z_{{\rm d2}} + z_{{\rm d3}} + z_{{\rm d4}}) \times {\rm 4}^{ - {\rm 1}} $$
where: the reflection spectra z contain 400 datapoints of consecutive wave length ranges (I = 1–400) with an increment (spectral resolution) of 2 nm (z (i=1–400) = (z 1, z 2, …, z400)), z d1 to z d4 are the reflection spectra of up to four milk samples per cow per week. In total 738 z mean spectra were obtained (19–24 mean spectra per cow).
Pre-processing of NIR spectra, calibration and validation
Chemometric tools (SL Calibration Wizard v.1.1.0; SensoLogic GmbH Norderstedt, Germany) were used for calibration of different FA in milk and in milk fat and for validation of results. Standard normal variate (SNV) and detrend processes were used for pre-processing of spectral data in order to reduce scattering effects and remove linear and non-linear trends in the NIR spectra (Barnes et al. Reference Barnes, Dhanoa and Lister1989). The statistical PLS-1 method (partial least squares) was applied for calibration of milk constituents. Full cross-validation was used to estimate the number of principle components for the calibration. For prediction of fat content in milk and various single FA and groups of FA in milk and in milk fat, z mean spectra were divided into two random sample sets: a calibration set containing two-thirds of all samples (n = 492) and a validation set containing the remaining samples (n = 246). Validation criteria for each PLS model were coefficient of determination (R 2), Root Mean Square Error of Prediction (RMSEP) and Ratio of Prediction to Deviation (RPD) defined as ratio of standard deviation of the validation set to RMSEP (Williams, Reference Williams, Williams and Norris2001). The calibration model was then validated in a cow-specific arrangement with regard to the prediction of body fat mobilisation in early lactation as described next.
For evaluation of body fat mobilisation in early lactation stage by NIR predicted LCFA concentrations, z mean spectra were subdivided into two sample sets in a different way: datasets of each cow were assigned either completely to the calibration or the validation set. For this purpose, ten cows with evident changes of long chain fatty acid concentration in milk fat over the first 26 lactation weeks were selected for the validation set. All remaining spectra were part of the calibration set. Predicted concentrations of LCFA in milk fat by NIRS were used for broken line regression model development.
Broken line regression model
Duration of body fat mobilisation in cows in early lactation stage was classified by means of a broken line regression model (SAS Institute Inc., Cary, North Carolina, USA, Version 9.1). The model was applied to the time series of LCFA concentration in milk fat of each cow during the lactation weeks 2 to 26 (Robbins et al. Reference Robbins, Saxton and Southern2006; Holstermann, Reference Holstermann and Verlag2012).
Evaluated characteristics of the broken line regression model were: slope (A); time duration D (lactation weeks) until the break of slope occurs; and plateau (Pl). Additionally, the area under the curve (AUC) was calculated in order to evaluate the total degree of body fat mobilisation, Eq. (2):
 $${\rm AUC} = ({\rm D}{^\ast}{\rm A}){^\ast}{\rm D}{^\ast}{\rm 2}^{ - {\rm 1}} $$
The broken line regression model was created twice for each of the ten cows in the NIR validation set, once for NIR predicted LCFA and once for LCFA analysed by GC.
Results
The total range, mean and standard deviation of fat content, content of single fatty acids, and groups of fatty acids in milk and in milk fat of all 738 merged samples, analysed with NIRS and GC, are listed in Table 1. Low contents and also low standard deviations were observed for most of the FA in milk. As to be expected, some of the FA were highly correlated with fat content in milk. This was especially observed for the FA C4:0, C6:0, C16:0 and C18:0 and the different groups of SFA, UFA, SMCFA (short and medium chain fatty acids [<C18]) and LCFA (≥C18) (Table 1).
Table 1. Overview on range, mean and standard deviation of fat content, single FA and groups of FA in milk and in milk fat and correlation between different FA in milk and fat content

sd, standard deviation; CLA, conjugated linoleic acid; SFA, saturated fatty acids; UFA, unsaturated fatty acids; SMCFA, short and medium chain fatty acids; LCFA, long chain fatty acids.
Milk fat composition was mainly dominated by SFA, and SMCFA were more present than LCFA with regard to chain length. Nevertheless, the ranges of all four groups of FA in milk fat were rather high with a high standard deviation.
The NIR spectra from milk samples per cow per week are shown in Fig. 1 (n = 738) in absorbance style (top). The spectra featured characteristically absorption peaks at 970 and 1450 nm related to first and second overtone bond vibrations of O-H. Additional absorption bands of numerous different second overtone C-H bindings occurred at around 1195 nm. The spectral region was sufficient in exposing third and second overtone absorption bands of the relevant chemical bonds and is eligible for high light penetration in water based fluids. After spectra pre-processing with SNV and detrend, the scattering as well as linear and non-linear trends were reduced as can be seen in Fig. 1 (bottom).

Fig. 1. (top) Weekly averaged cow individual near infrared absorbance spectra (n = 738) in the wavelength range 851–1649 nm of raw milk samples from a static measurement setup in reflectance mode; (bottom) Pre-processed near infrared reflectance spectra (n = 738) with standard normal variate (SNV) and detrend in the wavelength range 851–1649 nm.
The statistical performances of model development (calibration) and validation for fat content in milk and for single FA and groups of FA in milk and in milk fat are presented in Table 2. Excellent calibration results with regard to RMSEP (0·05) and RPD (11·4) were achieved for the prediction of fat content in milk. The coefficient of determination of the validation (R 2val) demonstrated that 40 to 88% of the variation of single FA in milk was explained by the spectra of the milk samples and concomitant chemometric analysis. RPD values for predicting the concentration of these FA in milk varied from 1·3 to 2·9 (Table 2). Naturally, the prediction of FA in milk performed better than the prediction of FA in milk fat, which is due to the high correlation of FA and fat content in milk. Chemometric analysis explained 15 to 76% (R 2val) of the variation of FA content in milk fat. RPD values varied from 1·0 to 2·0 (Table 2).
Table 2. Statistical performance of calibration and validation for fat content, single FA and groups of FA in milk and in milk fat
RMSECV, Root Mean Square Error of Cross-Validation; RMSEP, Root Mean Square Error of Prediction; RPD, Ratio of Prediction to Deviation; CLA, conjugated linoleic acid; SFA, saturated fatty acids; UFA, unsaturated fatty acids; SMCFA, short and medium chain fatty acids; LCFA, long chain fatty acids.
The prediction of SFA, UFA, SMCFA and LCFA contents in milk resulted in R 2val of 0·90 to 0·95 and RPD values of 4·3, 3·4, 3·1 and 3·5, respectively. The same groups of FA were predicted with R 2val of 0·72 to 0·81 and RPD values of 1·9 to 2·3 if their content in milk fat was considered. The relationship between actual FA contents, measured by GC, and NIR-predicted contents of all four groups of FA in milk and in milk fat in the samples of the validation set are shown in the scatter plots in Figs. 2, 3, respectively.
Fig. 2. Relationship of actual and NIR-predicted concentrations of the groups of FA SFA, UFA, SMCFA and LCFA in milk in the validation samples.

Fig. 3. Relationship of actual and NIR-predicted concentrations of the groups of FA SFA, UFA, SMCFA and LCFA in milk fat in the validation samples.
Broken line regression model
Changes in LCFA concentrations in milk fat were determined by GC and NIR method. Both values, analysed and predicted ones, were used separately for calculating a broken line regression. The LCFA time series and the estimated broken line regression function are shown exemplarily for two cows in Fig. 4. As expected, the concentration of LCFA in milk fat decreased considerably during the first lactation weeks. After the first lactation phase, the typical body fat mobilisation ends, which led to a lower but constant LCFA concentration with an individual level for each cow. The broken line regression model described the characteristic of the LCFA time series well with a clear break of the slope.
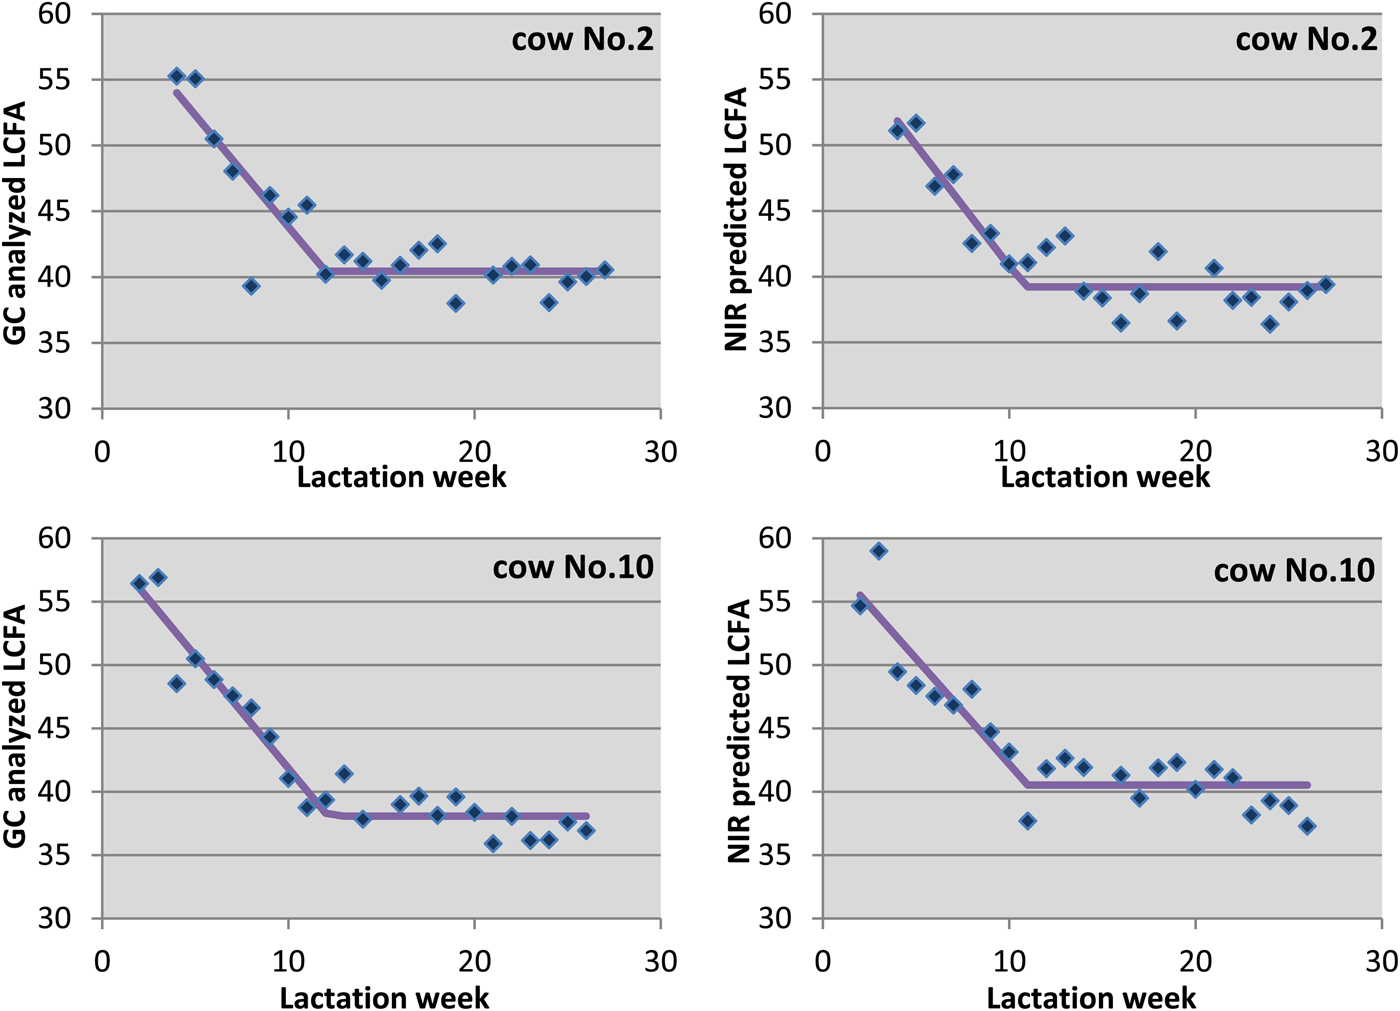
Fig. 4. Comparative view on the chronological sequence of cow individual LCFA concentration (dots) in milk fat samples in early lactation and estimated broken line regression function (line) for cows No. 2 and No. 10. Left: analysed by gas chromatography (GC); right: predicted by near-infrared (NIR) spectroscopy.
Body fat mobilisation characteristics A, D, Pl and AUC of the broken line regression model were calculated separately for each cow in the validation set, both for LCFA data of GC and NIR analysis (Table 3). Good agreement between values estimated by GC and NIR were received for all cows, except for cow No. 3. As all cows were in the beginning of their first lactation, results of this model might look different for multiparous cows.
Table 3. Characteristics of broken line model of the chronological sequence of LCFA analysed by gas chromatography (GC) and near-infrared (NIR) spectroscopy

se, standard error; AUC, area under the curve; Pl, level of the plateau which corresponds to the percentage of LCFA in total milk fat when mobilisation of body fat abandons; A, slope; D, time duration (lactation week [LW]) until the break of slope occurs and mobilisation of body fat closes.
The percentage of LCFA in total milk fat in the period without fat mobilisation (plateau) varied from 35·6% to 41·0% when predicted by NIR spectroscopy and hence was comparable with the LCFA plateau from GC analysis (Table 3).
The break of slope which indicates the duration of the body fat mobilisation differed between cows and between analysing methods. In the model with GC analysed LCFA, D varied from lactation week 9·7 to 17·2 (with exception of the results from cow No. 3). In the NIR based model D was predicted in lactation week 10·9 to 22·0.
In average, the cows reached the period without body fat mobilisation 3·3 weeks later in the NIR based model compared to the GC based model. Partly large differences were also observed when comparing the slope A calculated by the NIR and the GC based model. These deviations additionally affect the AUC values which describe the total degree of body fat mobilisation. The rate of adaption of body fat mobilisation, described by the slope, varied from 0·9 to 2·2 percentage points of LCFA per lactation week for GC analysed LCFA. In the NIR based broken line model the slope varied from 0·6 to 2·0 percentage points of LCFA per week. The AUC describing the total degree of body fat mobilisation varied for the GC based model from 89·3 to 149·7 (with exception of cow No. 3). The range of the NIR based AUC resulted in values of 72·8 to 166·6. In average, lower values for the slope (A) and higher values for AUC were observed for the NIR based broken line model.
Discussion
Only primiparous cows in the beginning of their first lactation were used in this study which might influence the results with regard to milk composition, fatty acid concentration and the period of negative energy balance in comparison to a herd with primiparous and multiparous cows. The results of this study are therefore only valid for primiparous cows. The range of fat content in the analysed milk samples was slightly higher than the typical range but still in compliance with observations from other authors (MacGibbon & Taylor, Reference MacGibbon, Taylor, Fox and McSweeney2006). Range, mean and standard deviation of the concentration of single FA in milk fat observed in this study were in accordance with results from others authors (Creamer & MacGibbon, Reference Creamer and MacGibbon1996; Mansson, Reference Mansson2008). Information on the concentrations of single FA in milk are rather rare in literature since concentration of single FA in milk are rather small and highly dependent on the fat content in milk. FA with high concentrations in milk fat are highly correlated with the fat content in milk (e.g. C4:0, C16:0 and C18:0). In this case, information on the FA concentrations in milk fat have a higher informative value for the validity of calibration models. The relationship of FA and fat concentration in milk is also expressed by the high correlation of different groups of fatty acids with fat content in milk.
Accuracy of FA prediction
With regard to classification of RPD values (Williams, Reference Williams, Williams and Norris2001), excellent calibration results were achieved when fat content in milk was predicted with NIR technology (RPD = 11·4). This is in accordance with own results from previous studies (Melfsen et al. Reference Melfsen, Hartung and Haeussermann2012a; Reference Melfsen, Hartung and Haeussermannc;, Reference Melfsen, Hartung and Haeussermann2013) and with studies from other authors (Tsenkova et al. Reference Tsenkova, Atanassova, Ozaki, Toyoda and Itoh2001; Saranwong & Kawano, Reference Saranwong and Kawano2008). According to the RPD classification by Manley (Reference Manley2014), RPD values greater than 3 and 5 are useful for screening and quality control, respectively, and values above 8 are useful for any analysing application (Manley, Reference Manley2014).
The analysis of FA concentrations in milk or in milk fat is rather difficult since concentrations of single FA are rather small. Additionally, highly overlapping absorption bands of different functional groups of FA can be observed in the NIR specific wavelength range. Furthermore, a high sampling error can be expected in the results of this study since up to four milk samples per week were merged and corresponding spectra were averaged.
The prediction of single FA in milk with NIR technology resulted in RPD values that are mostly classified as poor (Williams, Reference Williams, Williams and Norris2001). Feasible calibrations with RPD values above 2 were observed for the FA C4:0, C6:0, C16:0 and C18:0 and for all four considered groups of FA in milk. According to Manley (Reference Manley2014) only RPD values above 3 are useful for screening. Comparable prediction accuracy when predicting different groups of FA in milk such as SFA, UFA and LCFA with NIR technology was also observed by Nguyen et al. (Reference Nguyen, Dehareng, Hammida, Baeten, Froidmont, Soyeurt, Niemoeller and Dardenne2011). Since contents of single FA and groups of FA in milk are highly correlated with fat content in milk, it is most likely that prediction accuracy depends highly on fat calibration. Increasing RPD values for FA were found with rising correlation to the fat content in milk. In this case, the prediction accuracy of FA in milk fat is lower than the one in milk but much more reasonable. The decrease in prediction accuracy when comparing FA contents in milk fat and in milk was especially demonstrated by these FA and groups of FA that were highest correlated with the fat content in milk (FA: C4:0, C6:0, C16:0 and C18:0; groups of FA: SFA, UFA, SMCFA and LCFA). Feasible calibration were achieved for the FA decenoic acid (C10:1) in milk fat and for all selected groups of fatty acids in milk fat. Thereby, the rapid detection of enriched levels of e.g. UFA in milk or milk fat by NIRS during milking could enable either to select milk with higher UFA levels on-farm or to support management decisions on farm such as feeding or breeding. However, selection of milk with high levels of UFA might also affect subsequent processes such as storage or manufacturing processes for dairy products.
The prediction accuracy for single FA in milk fat was similar to those obtained by Coppa et al. (Reference Coppa, Ferlay, Leroux, Jestin, Chilliard, Martin and Andueza2010) when analysing FA in liquid milk. Although, more latent factors were used in this study compared to the equations in Coppa et al. (Reference Coppa, Ferlay, Leroux, Jestin, Chilliard, Martin and Andueza2010). Results for analysing groups of saturated or unsaturated FA showed slightly better SEP values in this study while, due to a higher variation in the validation set, RPD values were higher in the study of Coppa et al. (Reference Coppa, Ferlay, Leroux, Jestin, Chilliard, Martin and Andueza2010).
When comparing the accuracy for the prediction of FA in milk and in milk fat in this study with studies using MIR technology (Soyeurt et al. Reference Soyeurt, Dardenne, Dehareng, Lognay, Veselko, Marlier, Bertozzi, Mayeres and Gengler2006, Reference Soyeurt, Dehareng, Gengler, McParland, Wall, Berry, Coffey and Dardenne2011; Rutten et al. Reference Rutten, Bovenhuis, Hettinga, van Valenberg and van Arendonk2009), it is noticeable that both technologies reach a similar accuracy for most of the tested FA, the prediction accuracy with NIRS was even better for some FA in milk (C4:0, C6:0, C8:0, C10:1, C16:0 and C18:0) (Soyeurt et al. Reference Soyeurt, Dardenne, Dehareng, Lognay, Veselko, Marlier, Bertozzi, Mayeres and Gengler2006; Rutten et al. Reference Rutten, Bovenhuis, Hettinga, van Valenberg and van Arendonk2009). However, newer studies on the usage of MIR to predict groups of FA in milk show significantly improved accuracy (Soyeurt et al. Reference Soyeurt, Dehareng, Gengler, McParland, Wall, Berry, Coffey and Dardenne2011). On the other hand, since NIR technology has the potential of analysing FA concentrations in-line and in real time, it has an advantage compared to MIR technology.
Prediction of LCFA course during lactation
The relationship between body fat mobilisation and concentration of LCFA in milk fat was recently part of several studies (Stoop et al. Reference Stoop, Bovenhuis, Heck and van Arendonk2009; Gross et al. Reference Gross, van Dorland, Bruckmaier and Schwarz2011; Holstermann, Reference Holstermann and Verlag2012). According to these studies, the shape of the curve of the LFCA concentrations during early lactation stage can well explain the mobilisation of body fat stores to compensate negative energy balance. In the current study, the potential of NIR based broken line models for predicting extent and duration of body fat mobilisation in dairy cows in early lactation stage were validated.
The change in LCFA concentration in milk fat during lactation can well be illustrated by the analysis of milk samples with NIRS. The prediction accuracy of LCFA in milk fat with NIRS was comparable in both calibration methods, i.e. the selectively created calibration and test set and the randomised calibration and test set. Nevertheless, the characteristics of body fat mobilisation of cows by LCFA concentrations differed in some points comparing NIR and GC based model. The value of the plateau (Pl) was significantly correlated between the two analysing methods (r = 0·862, P = 0·001), which underlines the suitability of NIR prediction with regard to mean values of consecutive samples. None of the model characteristics brake of slope (D), slope (A), plateau (Pl), and AUC were significantly different (t 9;0,975) when received from either of the two analysing methods. Nevertheless, mean values of D, A and AUC showed considerably large differences between both methods. In average, the cows reached the period without body fat mobilisation 3·3 weeks later in NIR based models than in GC based models. This has additionally effects on predicted A and AUC values. Assuming a random effect, a more frequent analysis of LCFA concentrations with NIRS would have a higher potential to achieve the same conclusion as the more accurate GC method since fluctuations are displayed with a higher resolution. This is to some extent mirrored by the high correlation of Pl of both methods. Besides, the off-line or in-line analysis with NIRS can well indicate the course of LCFA during lactation as an additional approach to characterise lactation stages with mobilisation of body fat stores.
Conclusions
The concentration of fat, several single FA and different groups of FA in milk can be well predicted with NIRS off-line analysis but, since the concentrations of FA in milk are highly correlated with milk fat content, the prediction of FA contents in milk fat is more meaningful when independent predictions are intended. The accuracy of the prediction of single FA concentrations in milk fat is rather poor for most FA but still comparable to alternative analysing methods such as MIR analysis. The estimation of different groups of FA in milk fat resulted in a suitable accuracy, which was sufficient to mirror the development in the different lactation phases. The accurate estimation of extent and duration of body fat mobilisation in individual cows was rather difficult with NIR predicted LCFA concentrations. Assuming random deviation, the estimation could be improved by a higher measuring frequency. Additional pre-processing of cow individual spectra as described in Melfsen et al. (Reference Melfsen, Hartung and Haeussermann2012b) could also improve the general prediction accuracy especially when it comes to the course of single constituents like the LCFA concentration.
This project was co-financed by the European Regional Development Fund (ERDF). We gratefully acknowledge the ‘Zukunfsprogramm Wirtschaft Schleswig-Holstein’, Polytec GmbH and Sensologic GmbH for financial and technical support. Furthermore, we thank the Institute for Animal Breeding and Husbandry, University Kiel for enabling sampling efforts.


