

Introduction
While all typically-developing children quickly become competent users of their language, important individual and group variation is observed in the pace and trajectory of language development (e.g., Caselli et al., Reference Caselli, Bates, Casadio, Fenson, Fenson, Sanderl and Weir1995). Factors accounting for the variance in early language development include the quantity and quality of linguistic input that young children received in their home environments (Weisleder & Fernald, Reference Weisleder and Fernald2013), which may correlate with socioeconomic status (Golinkoff, Hoff, Rowe, Tamis-LeMonda & Hirsh-Pasek, Reference Golinkoff, Hoff, Rowe, Tamis-LeMonda and Hirsh-Pasek2019). In this paper, we use a meta-analytic methodology to look at socioeconomic status (SES) and how it correlates with quantitative measures of language experiences drawn using an innovative technology consisting of automatized analyses of daylong recordings (LENATM).
In the following introduction, we first discuss the ongoing debate on the magnitude (or existence) of SES differences in children's language experiences. Then, we present the Language Environment Analysis (LENATM) technology and its three main metrics of language experiences: adult word counts, conversational turn counts and child vocalization counts. Finally, we integrate these two sections to formulate our main research questions.
SES and language environment
Socioeconomic status is a broad and complex construct reflecting the social and economic resources of a household. In child research, this construct is often captured using single measures, such as parental education, income, or composites derived from both of these factors and others (e.g., parental occupation). Although input quantity varies within a given SES group (Sperry, Sperry & Miller, Reference Sperry, Sperry and Miller2019; Weisleder & Fernald, Reference Weisleder and Fernald2013), there is some evidence suggesting that SES correlates with input quantity. In a landmark study examining vocabulary development, Hart and Risley (Reference Hart and Risley1995, henceforth H&R) assessed the number of words spoken to young children from socio-economically diverse families. They calculated the mean number of words spoken to each child in their study across one-hour monthly observations from the child's first to third birthday. Based on these data, they estimated that, by the age of four years, children having grown up in a high socio-economic status context will have heard three times more child-directed speech than children in a lower socio-economic status context (about 45 versus 15 million words, respectively). This finding, commonly referred to as the “30-million-word gap”, was bolstered by subsequent studies which also found SES differences in the quantity and quality of child-directed speech (e.g., Hoff, Reference Hoff2003; Huttenlocher, Waterfall, Vasilyeva, Vevea & Hedges, Reference Huttenlocher, Waterfall, Vasilyeva, Vevea and Hedges2010). Moreover, SES was found to affect language development primarily via the child's language environment (Hoff, Reference Hoff2003).
These three studies were all longitudinal and assessed language environment through observations. These studies' methods have been criticized. For example, in the H&R study, researchers avoided recording family interactions not involving the child, included only the language addressed to the child by one unique parent in their counts, and instructed their observers to interact as little as possible with the family during observations. The presence of an observer may have influenced caregivers’ behaviors and limited the ecological validity of their data (Dudley-Marling & Lucas, Reference Dudley-Marling and Lucas2009). This is because the presence of observers has been found to significantly and positively affect upper-middle-class mothers’ interactions with their children, leading to more frequent interactions (Zegiob, Arnold & Forehand, Reference Zegiob, Arnold and Forehand1975), while it is not obvious that it would have the same effect on lower-SES families. Furthermore, the decision to only consider one parent's child-directed words may have failed to account for common structural differences between socioeconomically diverse groups. Different SES groups might exhibit differences in the number and identity of people living with the child (Glick, Reference Glick1976), and how frequently they address the child, in addition to a different quantity of overheard speech. These and other considerations led Sperry et al. (Reference Sperry, Sperry and Miller2019) to revisit H&R's conclusions. They included H&R's data but also additional recordings from five communities, two described as “poor”, two “working class”, and one “middle class”. Contrary to H&R, observers were encouraged to interact with the family. The authors assessed children's language input in three ways: (1) speech by the primary caregiver to the child (H&R's definition), (2) all speech directed to the child, and (3) overheard speech in addition to speech directed to the child. They only found significant statistical differences between two of the H&R groups when using H&R's own definition, but not among any of the other groups. For the second and third definitions, the authors do not report statistical comparison tests. To try to quantify this more precisely, we calculated the correlation between a four-level SES split encompassing SES levels from both these studies (1 = “poor”/“welfare”, 2 = “working class”, 3 = “middle class”, 4 = “professional”) and the number of words in the three definitions. The Pearson correlation coefficient was r = .608 for the first definition, which includes H&R's four groups and Sperry et al.'s five groups, whereas the other definitions only include the latter, and their coefficients are r = −.185 and r = .182 respectively.
However, Golinkoff et al. (Reference Golinkoff, Hoff, Rowe, Tamis-LeMonda and Hirsh-Pasek2019) criticized Sperry and colleagues’ study for the absence of a high SES group (i.e., corresponding to the “professional” group in H&R). Furthermore, the decision to direct observers “to interact with adults and children in an interested and relaxed manner” (Sperry et al., Reference Sperry, Sperry and Miller2019; p. 1310), perhaps resulted in unrepresentative observed language input of participants’ everyday experience. As a result, there is an ongoing debate in the literature regarding the association between SES and children's language experiences.
LENA Technology
One important recent technological advance in the psycholinguistic field has been the development of the Language Environment Analysis (LENATM) device and associated software. The device is a small digital recorder, worn by the child in a specially designed vest, which records audio for up to 16 hours (or even 24, in the most recent hardware). The associated software generates an automatic analysis of the amount of language occurring in the child's environment, yielding three key estimates: the number of words spoken by any adult in the near presence of the child (Adult Word Count, AWC); the number of times a child made any kind of linguistically relevant vocalization (i.e., speech or babble, but excluding vegetative noises and crying; Child Vocalization Count, CVC); and the number of times there was an adult vocalization within five seconds of a child vocalization (Conversational Turn Count, CTC). Notice that this entails a shift in how language experiences are measured, compared to other methodologies relying on human annotations of recordings: AWC likely represents overall input; CTC represents back-and-forth interactions between the key child and adults in the environment, and thus closer to child-directed speech; and CVC captures the child's own productions, which are both necessary for establishing CTC and contribute to children's experience of their own productions. Thus, the Language ENvironment Analysis also considers this aspect of the child's experiences.
LENATM has been found to be fairly accurate and reliable. In a recent meta-analysis comparing LENATM's automated measures to human transcriptions, Cristia, Bulgarelli, and Bergelson (Reference Cristia, Bulgarelli and Bergelson2020) found a low-to-moderate correlation for CTC (r = .36) but high mean correlations coefficients for AWC (r = .79) and CVC (r = .77). Moreover, the LENATM metrics have been meta-analytically shown to predict concurrent and later language outcomes (Wang, Williams, Dilley & Houston, Reference Wang, Williams, Dilley and Houston2020). This meta-analysis found a medium significant association across the three measures, with the association between language outcomes and CTC/CVC (Pearson's r = .31 and .32 respectively) being larger than the one for AWC (r = .21).
Importantly for our purposes, LENA technology can meaningfully contribute to the SES debate by providing data in which observer effects may be minimized, since there is no human observer and the sheer length of the audiorecording may contribute to habituation by the family. Moreover, research in this technique is standardized (the same hardware and software are used by all researchers), allowing an apples-to-apples integration of the previous body of data. Lastly, LENATM is widely and increasingly used, including in intervention work (e.g., Leung, Hernandez & Suskind, Reference Leung, Hernandez and Suskind2020). As a result, our findings stand to be informative for this growing body of work.
The present study
The recent debate between Golinkoff et al. (Reference Golinkoff, Hoff, Rowe, Tamis-LeMonda and Hirsh-Pasek2019) and Sperry et al. (Reference Sperry, Sperry and Miller2019) sparked an important discussion regarding the empirical basis and associated assumptions that underlie key findings in child development, and notably the purported association between SES and language experiences. Accurately measuring this association has important theoretical and practical implications, a point on which Golinkoff et al. (Reference Golinkoff, Hoff, Rowe, Tamis-LeMonda and Hirsh-Pasek2019) and Sperry et al. (Reference Sperry, Sperry and Miller2019) agree. The present study therefore aims to assess to what extent SES correlates with variability in children's language experiences using LENATM estimates, which we hope will more faithfully represent children's everyday experiences. Our questions and hypotheses were:
• What characterizes studies that report on the association between SES and LENATM's measures? We describe publication status, country of data collection, and SES range, among other key characteristics. We are especially interested in the breadth of coverage of the data.
• What is the size of the correlation between SES and LENATM measures?
• Are there factors leading to variation in the size of this correlation? We investigate the type of LENATM measures (AWC, CVC, CTC), and child age, among other characteristics, as potential moderators. Given Golinkoff et al. (Reference Golinkoff, Hoff, Rowe, Tamis-LeMonda and Hirsh-Pasek2019)'s analyses showing that SES effects are strongest when considering child-directed speech, we expect CTC to be most sensitive to SES (since it is often described as being speech engaging the child) and to CVC the least (since it captures the child's own productions). Age could be a moderator because some research suggests that the link between SES and lexical processing increases with age (Scaff, Reference Scaff2019).
Methods
We follow the PRISMA guidelines for systematic reviews and meta-analyses (Moher, Liberati, Tetzlaff, Altman & The PRISMA Group, Reference Moher, Liberati, Tetzlaff and Altman2009). All materials (including data and scripts) are available from the Open Science Framework (Piot, Havron & Cristia, Reference Piot, Havron and Cristia2020).
Search strategy
Searches were carried out between March 16th and July 15th, 2020, and include 1) a search on PubMedCentral with the keywords “LENA” + “socio-economic” + “language”, resulting in 125 hits; 2) all the studies reported in the LENA research publications bibliography on the LENA foundation website, resulting in 105 papers; 3) a search in Google scholar using the private navigation mode (for reproducibility purposes) with the keywords “LENA”, “CTC” and “socioeconomic”; 4) another search in Google Scholar with the keywords “socioeconomic”, “LENA” and (“AWC” or “CTC” or “CVC”). For both Google searches, the first hundred hits were included for screening. Finally, ten additional studies were screened based on expert advice.
Eligibility criteria
Included studies reported an association between SES and at least one of the following: AWC, CTC, and CVC. Studies where the automated measures had been manipulated (e.g., splitting AWC into child-directed speech versus overheard speech) were excluded. To include studies using daylong recordings during naturalistic interactions at home between caregivers and typically-developing children below 18 years of age, we excluded post-treatment measures from intervention studies; and atypical samples. When multiple studies used the same data (e.g., the normative LENATM database – Gilkerson & Richards, Reference Gilkerson and Richards2008), the study with the biggest sample size and the most detailed data was included. Studies in which SES groups were confounded with another variable (e.g., country differences) were excluded. Finally, studies based on a homogeneous SES sample, in which more than 80% of the participants belonged to the same SES group, were excluded.
Study selection
See Figure 1 for PRISMA flowchart. The first author carried out all data screening and inclusion. Screening was based on title, abstract and a control + F search in the pdf for “SES”, “education” and “income”. This text-search method was used because many papers did not mention SES in their abstract but nonetheless referred to SES or its proxies in the paper. Twenty percent of papers were randomly selected from the first search strategy hits and screened by the second author, revealing a 96.8% screening accuracy.
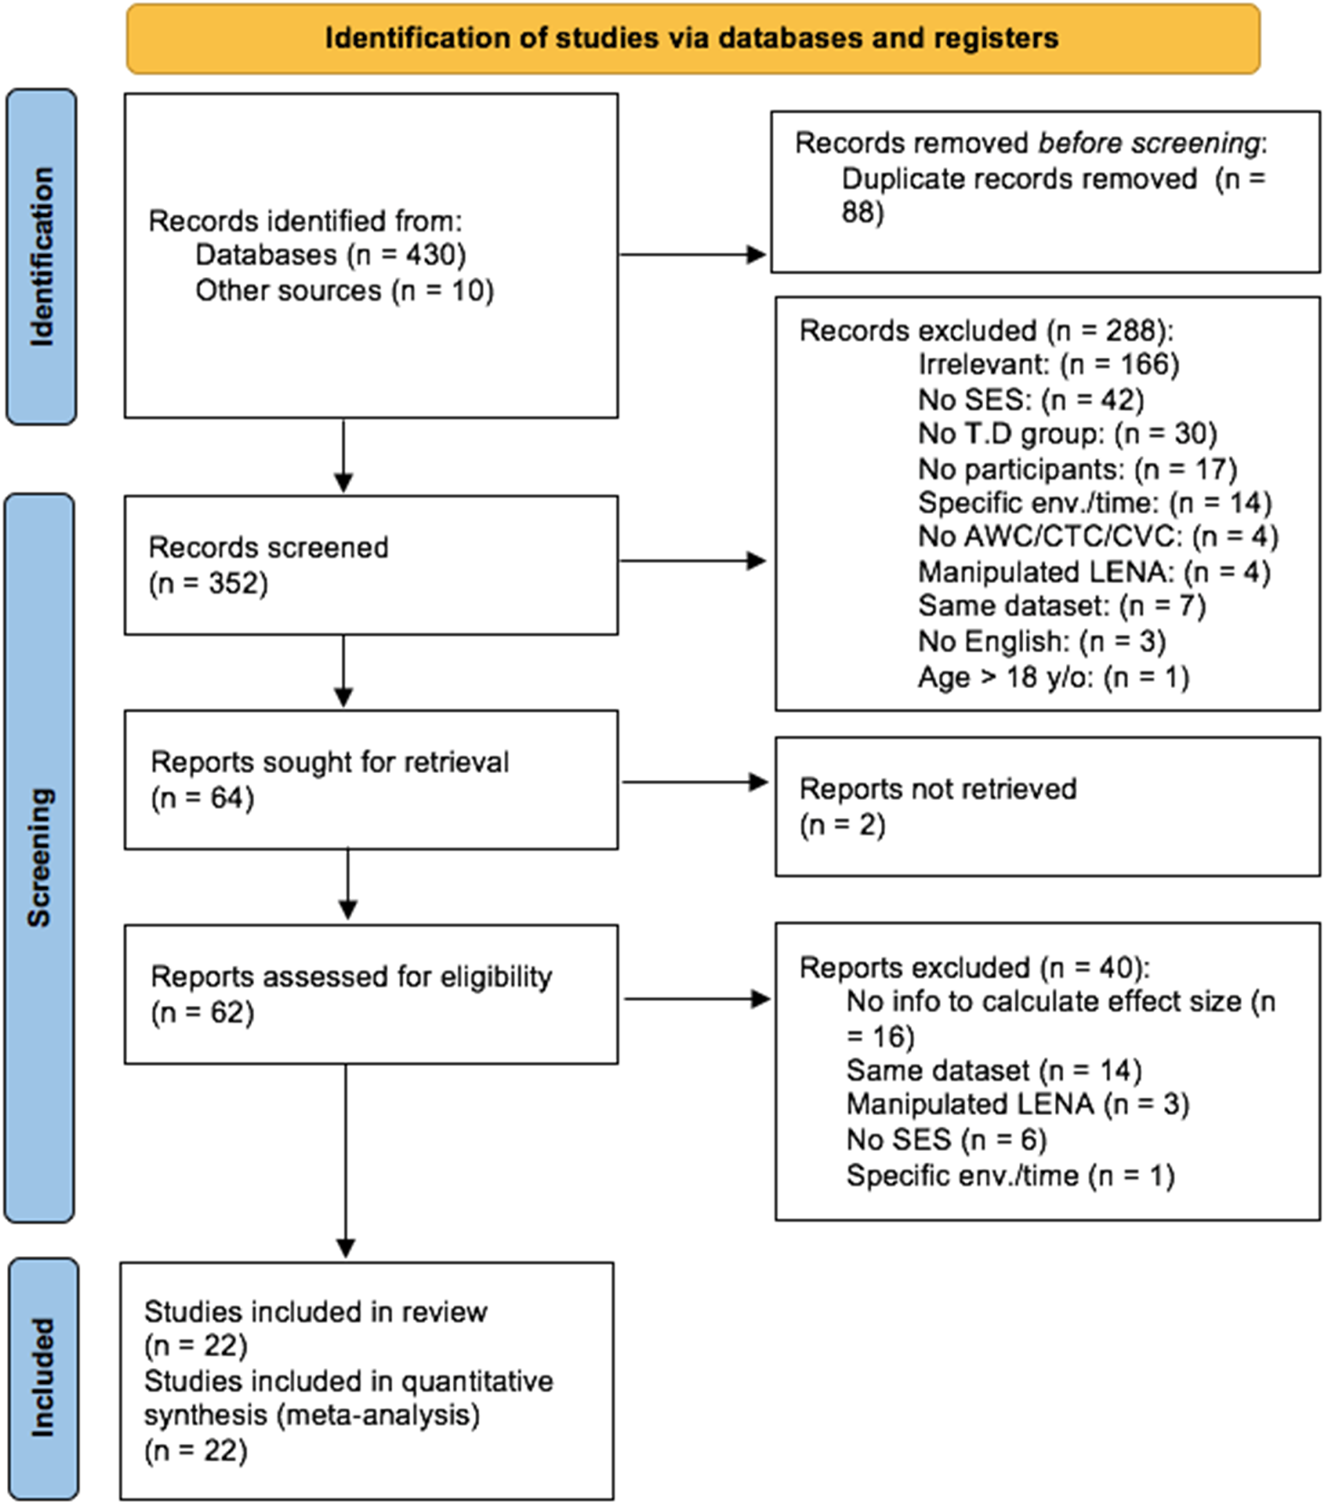
Figure 1. PRISMA Flowchart indicating studies discovered, screened, and included. “No SES” indicates studies that do not report any measures of SES and/or SES too homogeneous (>80% of participants in the same SES group) and/or SES was confounded with another variable. “No T.D. group” indicates there was no group data for typically-developing children specifically. “No participants” indicates that no participants were recruited for the study. “Specific env./time” indicates that LENA devices were only used during specific times of the day (e.g., meal-time) or specific environments (e.g., NICU). “Manipulated LENA” indicates that LENA metrics were transformed (e.g., AWC was divided in child-directed and adult-directed speech). “Same dataset” indicates that the study's dataset was the same as in another study. “No English” indicates that the paper was not written in English.
Data collection process and coding
If a study reported more than one measure (i.e., AWC, CVC, and CTC), all were coded, similarly to if they reported multiple measures of SES (e.g., education and income). We extracted:
• Paper characteristics: Authors, year of publication, publication type, country, total sample size (N), subgroups and sample size/subgroups
• Method/participant characteristics: type and measure of the dependent variable used, type of SES measure (education, income, a composite) and range of SES, age, native language, gender and ethnicity of participants
• Findings: AWC, CTC, CVC quantity measures and/or correlation/effect sizes
For all the included studies, information about publication, method, and findings were extracted and coded by the first author. We then hired a freelancer to independently enter all data. There were 21 discrepancies out of 405 fields entered, mostly in descriptive fields. The first author verified all discrepancies against the original papers and corrected them if necessary.
Analysis plan
All analyses were conducted with the R (Version 3.6.3; R Core Team, 2020) metafor package (Viechtbauer, Reference Viechtbauer2010). We first converted raw data into Pearson's correlations (Pearson's r) using raw input quantity metrics and their variance when reported. If a study reported metrics for more than two SES groups, only the data from the lowest and highest SES groups is used to calculate effect size. This only occurred in two papers, and analyses excluding these led to the same conclusions (see Supplementary Materials, Piot, Havron & Cristia, Reference Piot, Havron and Cristia2020). If a study reported a correlation (Pearson's r or Spearman's rho) and not the raw data, we used the reported correlation. We treated Spearman's rho as an imperfect estimate of Pearson's r. Analyses were performed using z-transformed correlation coefficients (henceforth rz). Positive effect sizes indicate that an increase in SES is associated with an increase in automated measures.
All the main analyses were performed using multilevel models, which account for interdependent effect sizes (e.g., AWC and CVC, education and income). Because one cannot perform a regression test for asymmetry in such a dataset, we assessed the risk for publication bias using a subset of data corresponding to AWC measures.
Results
Full output of all analyses can be accessed in the online Supplementary Materials (Piot et al., Reference Piot, Havron and Cristia2020). We included a total of 22 studies. We classified as “published” nine journal publications that provided enough information to have an effect size (Brushe, Lynch, Reilly, Melhuish & Brinkman, Reference Brushe, Lynch, Reilly, Melhuish and Brinkman2020; d’Apice, Latham & Stumm, Reference d'Apice, Latham and Stumm2019; Dwyer, Jones, Davis, Kitamura & Ching, Reference Dwyer, Jones, Davis, Kitamura and Ching2019; Ferjan-Ramírez, Lytle & Kuhl, Reference Ferjan-Ramírez, Lytle and Kuhl2020; Gilkerson, Richards, Warren, Montgomery, Greenwood, Kimbrough Oller, Hansen & Paul, Reference Gilkerson, Richards, Warren, Montgomery, Greenwood, Kimbrough Oller, Hansen and Paul2017; Leung et al., Reference Leung, Hernandez and Suskind2020; McGillion, Pine, Herbert & Matthews, Reference McGillion, Pine, Herbert and Matthews2017; Merz, Maskus, Melvin, He & Noble, Reference Merz, Maskus, Melvin, He and Noble2020; Sultana, Wong & Purdy, Reference Sultana, Wong and Purdy2020). We classified as unpublished the rest of the studies (13), because the association between SES and LENA measures was not peer-reviewed: eight cases in which the authors provided us with effect sizes, including six journal publications (Adams et al., Reference Adams, Marchman, Loi, Ashland, Fernald and Feldman2018; Beecher & Van Pay, Reference Beecher and Van Pay2019; Christakis, Lowry, Goldberg, Violette & Garrison, Reference Christakis, Lowry, Goldberg, Violette and Garrison2019; Ganek, Smyth, Nixon & Eriks-Brophy, Reference Ganek, Smyth, Nixon and Eriks-Brophy2018; Orena, Byers-Heinlein & Polka, Reference Orena, Byers-Heinlein and Polka2019; Swanson, Donovan, Paterson, Wolff, Parish-Morris, Meera, Watson, Estes, Marrus, Elison, Shen, McNeilly, MacIntyre, Zwaigenbaum, St John, Botteron, Dager, Piven & IBIS Network, Reference Swanson, Donovan, Paterson, Wolff, Parish-Morris, Meera, Watson, Estes, Marrus, Elison, Shen, McNeilly, MacIntyre, Zwaigenbaum, St John, Botteron, Dager and Piven2019), one SCRD poster (Romeo, Leonard, Mackey, Rowe & Gabrieli, Reference Romeo, Leonard, Mackey, Rowe and Gabrieli2019) and one evaluation report (Law, Charlton & Rush, Reference Law, Charlton and Rush2018); as well as correlations extracted from two theses (PhD thesis: Lease-Johnson, Reference Lease-Johnson2018; MSc thesis: Flood, Reference Flood2015), and from our own re-analyses of archived data (Bergelson Seedlings: Bergelson, Reference Bergelson2017; Cougar: VanDam, Reference VanDam2018; Warlaumont: Warlaumont, Pretzer, Walle, Mendoza & Lopez, Reference Warlaumont, Pretzer, Walle, Mendoza and Lopez2016).
Table 1 shows characteristics of the included studies. Almost all of the studies took place in an English-speaking country, with 14 studies conducted in the USA, three in the United Kingdom, two in Australia, one in Canada, one in New Zealand, and one in Vietnam. Samples were varied in terms of age range, SES, and ethnicity. Infants’ mean age ranged from 5.81 to 84.36 months, although the majority (90.91% of the studies) were under 42 months. SES ranges are large, going from less than a high school diploma or 10,000US$/year of income to doctoral degrees or over 100,000US$/year. Studies tended to have a medium to large sample size, with a mean of 71.95 children (range = 12–245, total = 1583).
Table 1. Included studies. Studies identified by first author name and year regardless of the number of authors, except for the three corpora from HomeBank, identified by the corpus name. “Sample” indicates characteristics of the infant sample. “LENA” indicates characteristics of the LENA recordings (“est.” stands for estimate, “h” for hourly, “12h” for 12h projection, “raw 16h” for the raw 16h counts, “z12h” for the z-scored 12h projection, “pcl” for percentiles). SES indicates characteristics of the SES measures (range); “S.D.” indicates socioeconomic deprivation, “HI” Hollingshead Index, “composite” a composite measure created by the researchers.

Turning to our quantitative synthesis, we fit a model with the following factors: mean age of children (centered) in interaction with LENA's measure (AWC as baseline, CTC, CVC), and publication type (published as baseline, unpublished). The test for moderators was significant, QM (df = 6) = 12.95, p = .044, suggesting that moderators explained variance. However, there is still variance unaccounted for in this model, since the test for heterogeneity was also significant (I2 = 40.15%, QE(df = 76) = 98.48, p = .043). The model's intercept (corresponding to the midpoint of our age distribution, the AWC measure, and published data) was significant (r z = .186, SE = .043, p < .001, CI [.101 ; .270]), indicating a significant effect of SES on LENA measures. There was a main effect of CVC, indicating that this correlation was weaker for CVC than for the baseline AWC (r z = −.091, SE = .034, p = .007, CI [−.158 ; −.025]). The main effect of age was marginal (r z = .003, SE = .001, p = .086, CI [.000 ; .005]). Neither the other moderators (publication type and CTC) nor the interaction of age with measure type were significant.Footnote 1
Publication bias
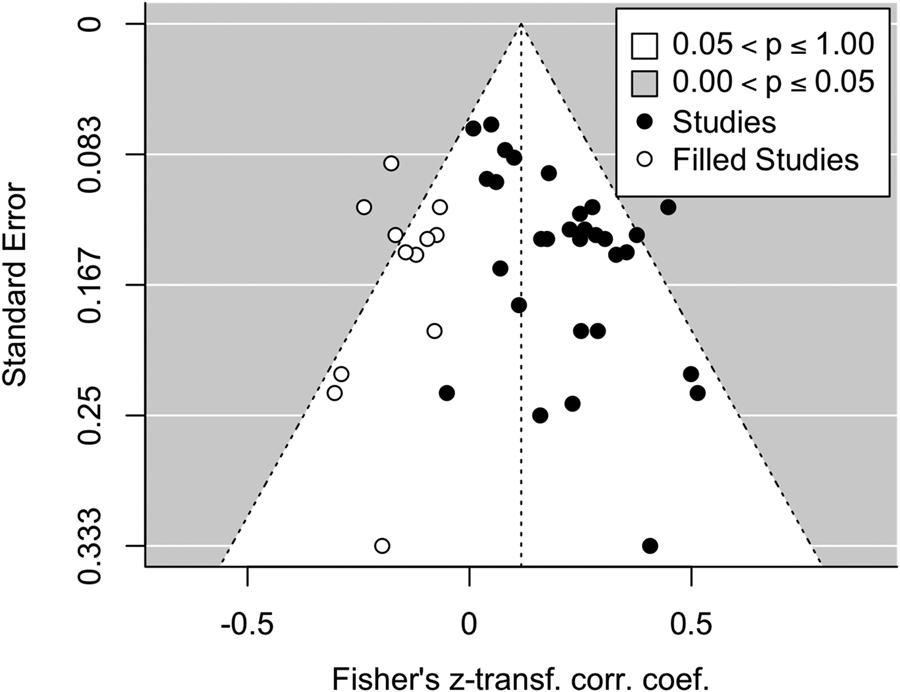
Publication bias is a risk to the validity of a meta-analysis, and thus high quality meta-analyses need to check for it, following PRISMA recommendations (Moher et al., Reference Moher, Liberati, Tetzlaff and Altman2009). It happens when the results of a study influence the decision to publish it. If there is a publication bias in this literature favoring positive over null or negative results (Rothstein, Sutton & Borenstein, Reference Rothstein, Sutton and Borenstein2005), one expects studies to be asymmetrically distributed around the weighted average effect size, with high positive correlations being inordinately common among studies with lower precision. Using data for the AWC measure (21 studies) only to avoid a power inflation due to repeated measures, we assessed the presence of a potential publication bias with a funnel plot (see Figure 2) and the Egger's test for funnel plot asymmetry. The test revealed significant asymmetry for all the data (k = 31, z = 2.601, p = .009) with similar but non-significant trends for the ‘published’ effect sizes only (k = 13, z = 1.757, p = .079) and the ‘unpublished’ effect sizes (k = 18, z = 1.353, p = .176). We used the trim-and-fill method to estimate the number of studies needed to symmetrize the plot based on all data, and to impute the effect size had these studies been available. This resulted in the addition of 12 imputed studies, leading to a weighted median effect size r z = .116, SE = .031, CI = [.056; .177].

Figure 2. Funnel plot showing, for each study, its standard error as a function of its effect size. True studies are in black; those imputed by the trim-and-fill method are shown in white.
Discussion
Our systematic review of LENATM measures of children's language experiences as a function of parental SES revealed that English-speaking countries provide the near totality of the data, with half of the effect sizes coming from the USA in particular. Thus, conclusions here may not generalize to other countries. Other than that, samples seemed quite diverse: the socioeconomic range was large, and on average half of the data came from Black, Asian, and Minority Ethnic populations – although it should be noted that ethnic characteristics were reported in less than half of the articles.
Our quantitative integration suggested the association between SES and LENATM measures was small: in our model controlling for the type of LENATM metric, age and publication type, the intercept was equal to z-transformed r = .186. Since funnel plots and Egger's tests were consistent with a publication bias in the AWC measures, we applied a correction for asymmetry, which resulted in an estimate of r = .116, which was still significant. Overall, these estimates align better with estimations of SES effects based on Sperry et al. (Reference Sperry, Sperry and Miller2019)'s data on overall speech quantities (r= .182) than either of their child-directed counts, which was r= −.185 for all adults, and r= .609 for the primary caregiver, which coincides with the fact that LENATM AWC is based on all speech, and not just directed speech.
In fact, we had predicted the correlation strength to be strongest for CTC, which was not the case, with no significant difference in the correlation strength between this measure supposedly tagging interactive talk (CTC r z = .183), and AWC (r z = .186). Interestingly, our moderator analysis suggested that the estimate for CVC (r z = .094) was significantly lower than that of the baseline AWC. These results suggest that the strongest associations between SES and language experience pertain to the overall near and clear adult speech, as well as to the back-and-forth interactions, with lower association strength for actual child speech.
In passing, we notice that the estimate for CVC is much lower than previous reports of SES association with word comprehension scores (r z = .26, Scaff (Reference Scaff2019)), suggesting that vocal production is less affected by SES differences than lexical development. This has sometimes been discussed for very early production measures, with significant effects of SES found for volubility, but not canonical proportion (Oller, Eilers, Basinger, Steffens & Urbano, Reference Oller, Eilers, Basinger, Steffens and Urbano1995).
Finally we note several limitations. First, LENATM measures capture meaningful variation in children's language experiences (Wang et al., Reference Wang, Williams, Dilley and Houston2020) but touch upon conceptually distinct constructs, ranging from the child's own production (CVC) to overall speech in the child's input (AWC, which does not distinguish between child-directed and overheard talk). Although CTC has been viewed as an ideal measure of back-and-forth conversation (Romeo et al., Reference Romeo, Leonard, Robinson, West, Mackey, Rowe and Gabrieli2018), there are some open questions about its reliability (Cristia et al., Reference Cristia, Bulgarelli and Bergelson2020), and its external validity, given its high correlation with CVC (for there to be a turn, there must be a child vocalization, leading to correlations between CVC and CTC above r = .9). It would be ideal for future generations of LENA or similar software to estimate child-directed speech separately from speech addressed to others, since this is likely to be an important distinction. Indeed, a preprint for a meta-analysis accepted as a registered report compares low- against mid- or high-SES groups in terms of child-directed word counts and overall word-counts, based mainly on studies relying on human annotations of short audio- or video-recordings (Dailey & Bergelson, Reference Dailey and Bergelson2021). They find a large effect estimated at Hedges' g = 0.69 (rz ~ .34) for child-directed estimates, with a lower effect of about Hedges' g = 0.17 (rz ~ .09) for overall estimates. Although those results may not translate to daylong recordings that are automatically analyzed, they do suggest that SES may affect child-directed speech quantities to a greater extent than overall quantities.
Returning to the limitations of our study, a second limitation is that this meta-analysis is only as good as the literature it is based on. Our data is drawn mainly from English-speaking countries, but the association between SES and language use in the home may vary across cultures and countries. Moreover, we found some evidence consistent with publication and reporting biases.
Finally, this study only measured the strength of the association, but cannot establish causality – which is extremely hard to assess, given that SES is a complex composite concept. Nevertheless, interventions that help extend the length of schooling and that are administered in a randomized control trial (e.g., Dupas, Duflo & Kremer, Reference Dupas, Duflo and Kremer2016) could be well placed to establish such causal chains by comparing mothers whose education was extended against control mothers.
In sum, it is important to accurately measure the potential strength of association between SES and children's early experiences, both for our theories of language acquisition and for potential implications in terms of social programs. We contribute to this goal by reviewing and integrating ecological data available in the current literature. Our results can be interpreted as being aligned with researchers arguing that we should look at language environments as a function of socioeconomic status, as there could be quantitative differences in the experiences afforded to young children (Golinkoff et al., Reference Golinkoff, Hoff, Rowe, Tamis-LeMonda and Hirsh-Pasek2019), since we find significant correlations with SES even in these highly naturalistic data. However, the strength of the correlation is quite small.
Acknowledgments
AC acknowledges Agence Nationale de la Recherche (ANR-17-CE28-0007 LangAge, ANR-16-DATA-0004 ACLEW, ANR-14-CE30-0003 MechELex, ANR-17-EURE-0017); and the J. S. McDonnell Foundation Understanding Human Cognition Scholar Award.
The authors made the following contributions. Leonardo Piot: Conceptualization, Data entry, Analyses, Writing - Original Draft Preparation, Writing - Review & Editing; Naomi Havron: Writing - Review & Editing; Alejandrina Cristia: Conceptualization, Analyses, Writing - Review & Editing.
Our data is fully available in the corresponding OSF repository: https://osf.io/rw6ve/?view_only=eddcd33627d940c8ab51f5b7ef8e252d.