

Autism spectrum disorders (ASD) is a term for a set of developmental disorders that are qualitatively similar. It includes autism, Pervasive Developmental Disorder – Not Otherwise Specified (PDD-NOS) and Asperger's Disorder. Autism is characterized by impairment in social interaction, delay or qualitative abnormalities in language and the presence of restricted and/or repetitive behaviors (American Psychiatric Association, 1994). PDD-NOS is a diagnosis often given to individuals who do not meet criteria for autism because of milder or less pervasive symptoms (i.e. social deficits but either no deviance in communication or no restricted and repetitive behaviors). Individuals with difficulties in social interaction and repetitive behaviors who do not meet autism criteria and do not have a history of cognitive or obvious language delay may be given a diagnosis of Asperger's Disorder (American Psychiatric Association, 1994).
One particular area of interest within research in ASD is that of communication and language. The foremost reason why parents of children diagnosed with ASD seek help is a delay in language (DeGiacomo & Fombonne, Reference DeGiacomo and Fombonne1998). Children diagnosed early on with ASD often show disturbances in the development of other, non-linguistic social-communication behaviors (Charman, Baron-Cohen, Swettenham, Cox, Baird & Drew, Reference Charman, Baron-Cohen, Swettenham, Cox, Baird and Drew1997; Stone, Ousley, Yoder, Hogan & Hepburn, Reference Stone, Ousley, Yoder, Hogan and Hepburn1997). The development of language and related non-verbal communicative behaviors has been shown to be strongly related to outcome in verbal and non-verbal IQ and adaptive skills (Mundy, Sigman & Kasari, Reference Mundy, Sigman and Kasari1990; Sigman & Ruskin, Reference Sigman and Ruskin1999; Stone & Yoder, Reference Stone and Yoder2001; Tager-Flusberg, Paul & Lord, Reference Tager-Flusberg, Paul, Lord, Volkmar, Paul, Klin and Cohen2005). Furthermore, services that support the development of language and non-verbal communication have been found to improve later performance (Stone & Yoder, Reference Stone and Yoder2001). Understanding early communicative development is critical to mapping early developmental trajectories and designing appropriate treatments for children with ASD.
The identification and assessment of children at high risk for ASD is now beginning to occur sometimes within the first year of life (Zwaigenbaum, Bryson, Rogers, Roberts, Brian & Szatmari, Reference Zwaigenbaum, Bryson, Rogers, Roberts, Brian and Szatmari2005) and more often by the second (Wetherby, Woods, Allen, Cleary, Dickinson & Lord, Reference Wetherby, Woods, Allen, Cleary, Dickinson and Lord2004), especially for easily identifiable high-risk groups such as younger siblings of children with ASD. However, measures of language employed in a child assessment are often intended for youngsters at a level of development not yet attained by the children being assessed. As a result, formal measures typically used with older children may not be appropriate (Charman, Reference Charman2004), limiting the variability in findings and thus failing to yield an accurate picture of a child's development. This may be partly because the skills targeted by these measures are above the developmental level of the child. It also may occur because the tests themselves require certain early communicative skills (such as imitation and joint attention) which may be deficient in children with ASD. Indeed, recent studies have described floor effects on many standardized, formal assessments of language (e.g. Reynell Developmental Language Scales) in young samples of children diagnosed with or at risk for ASD (Charman, Baron-Cohen, Swettenham, Baird, Cox & Drew, Reference Charman, Baron-Cohen, Swettenham, Baird, Cox and Drew2003a).
As a result, researchers (Fenson, Dale, Reznick, Bates, Thal & Pethick, Reference Fenson, Dale, Reznick, Bates, Thal and Pethick1994; Charman, Reference Charman2004) have begun to suggest that it may be helpful to supplement (if not replace) these formal assessments with measures that extend beyond the laboratory and focus on very early stages of language development. Bornstein, Haynes & Painter (Reference Bornstein, Haynes and Painter1998) suggested that different forms of evaluation (such as parent report) that recognize the breadth of communication skills beyond language, as well as the range of communication in different contexts, may contribute a unique and equally valid perspective to more traditional measures of language. By using different data sources that complement one another, it may be possible to increase the validity of the overall measurement. One measure often used in this sort of approach is the MacArthur-Bates Communicative Development Inventory (CDI), a parent report measure of early vocabulary and non-verbal social-communicative development (Fenson et al., Reference Fenson, Dale, Reznick, Thal, Bates, Hartung, Pethick and Reilly1993).
The CDI is a standardized measure intended for typically developing children between the ages of 0 ; 8 and 2 ; 6 (Fenson et al., Reference Fenson, Dale, Reznick, Thal, Bates, Hartung, Pethick and Reilly1993; Fenson et al., Reference Fenson, Dale, Reznick, Bates, Thal and Pethick1994). There are two versions, both in checklist format: the Words and Gestures version, intended for children between the ages of 0 ; 8 and 1 ; 4; and the Words and Sentences version, intended for children between 1 ; 4 and 2 ; 6. The Words and Gestures version includes five pre- and early speech items, which cover skills such as response to name, verbal labeling and imitation. In the Phrases section, 28 phrases are listed. The caregiver is asked to report whether his or her child understands each phrase. In the Vocabulary Checklist, 396 items are listed, and the caregiver indicates whether the child ‘understands’ the item, or ‘understands and says’ the item. Last, there are 63 gestures organized into five categories covering First Communicative Gestures, Games and Routines, Actions with Objects, Pretending To Be a Parent and Imitating Other Adult Actions. The Words and Sentences version contains 680 vocabulary items that overlap with those on the earlier form. The caregiver indicates only whether the child produces each word. A second part of this version covers the child's use of a variety of grammatical structures. The CDI has been shown to have fair agreement with other standardized measures of language and direct observation of behavior (Fenson et al., Reference Fenson, Dale, Reznick, Bates, Thal and Pethick1994; Stone & Yoder, Reference Stone and Yoder2001; Charman, Reference Charman2004; Zwaigenbaum et al., Reference Zwaigenbaum, Bryson, Rogers, Roberts, Brian and Szatmari2005), although agreement for expressive language tends to be higher than for receptive.
The CDI, and the Words and Gestures version in particular, may be especially useful in studying children with ASD, because it permits researchers to investigate two related areas of development: (1) vocabulary comprehension and production; and (2) the use of early social-communicative behaviors. To address the first area, it may be helpful to use the CDI in clarifying profiles of lexical development. Hobson (Reference Hobson and Dawson1989) originally suggested that – as a consequence of their difficulty understanding the perspectives of others – children with ASD may have particular difficulty acquiring words in some domains, including those which require referential understanding. Several subsequent studies found that this was not the case, describing a profile of form class categories in autism that did not lack referential terms (Williams, Reference Williams1993) and that was generally the same as in typical development (Tager-Flusberg, Calkins, Nolin, Baumberger, Anderson & Chadwick-Dias, Reference Tager-Flusberg, Calkins, Nolin, Baumberger, Anderson and Chadwick-Dias1990; Charman et al., Reference Charman, Drew, Baird and Baird2003b). However, with the exception of Charman et al. (Reference Charman, Drew, Baird and Baird2003b), sample sizes have been quite small, and investigations have focused primarily on expressive rather than receptive language profile.
In addition to providing information about early lexical development, the CDI examines the delay or absence of typical, early-appearing social-communicative behaviors. These include items about imitation, functional and symbolic play and declarative and imperative gestures. These behaviors are some of the best differentiators of children with ASD from other developmentally delayed populations. They overlap substantially with a number of skills noted to be deficient in young children at risk for or diagnosed with ASD, such as pretend play, actions on objects (Charman, Swettenham, Baron-Cohen, Cox, Baird & Drew, Reference Charman, Swettenham, Baron-Cohen, Cox, Baird and Drew1998), imitation (Zwaigenbaum et al., Reference Zwaigenbaum, Bryson, Rogers, Roberts, Brian and Szatmari2005) and conventional gestures, such as pointing or showing (Osterling & Dawson, Reference Osterling and Dawson1994; Stone et al., Reference Stone, Ousley, Yoder, Hogan and Hepburn1997; Wetherby et al., Reference Wetherby, Woods, Allen, Cleary, Dickinson and Lord2004).
Previous research using the CDI with children diagnosed with developmental disorders has primarily used small samples. It is useful, then, to bolster these first steps with large-scale descriptive information, thus expanding our knowledge of what data the CDI yields in special populations. Recently, Charman et al. (Reference Charman, Drew, Baird and Baird2003b) used the CDI to investigate the early communicative skills of 134 preschool children with ASD. These researchers noted considerable variability in their ASD sample but found consistent trends in communication development (both vocabulary and social) associated with non-verbal mental age and chronological age. The ASD sample was substantially delayed relative to the normative sample reported by the inventory's developers (Fenson et al., Reference Fenson, Dale, Reznick, Thal, Bates, Hartung, Pethick and Reilly1993; Charman et al., Reference Charman, Drew, Baird and Baird2003b). Results provided evidence for some developmental pathways of vocabulary and social-communication consistent with typical development and others that were less consistent.
The present study is a replication of Charman and colleagues (Reference Charman, Drew, Baird and Baird2003b) and provides a descriptive analysis of the CDI information collected from parents of 93 children with ASD. It adds to the previous literature in its inclusion of two comparison groups: 31 children with non-ASD developmental delay and 29 typically developing children. The specific research questions within each area are outlined below:
(1) We examined CDI scores within the ASD group to address the following questions:
a. Are there differences in scores between children with autism and children with PDD-NOS?
b. Do skills increase with increasing non-verbal mental age and chronological age?
c. How do the scores observed in the ASD sample compare to published norms?
(2) We examined CDI scores for the entire sample (ASD, developmental delay and typical development) to address the following questions:
a. Do scores differ across diagnostic groups?
b. Does lexical composition differ across diagnostic groups?
c. What is the relationship between verbal communication and non-verbal communication on the CDI?
d. What is the relationship between receptive and expressive vocabulary on the CDI?
METHOD
This study used previously collected data that were gathered as part of three larger longitudinal investigations; these investigations focused on slightly different time frames. The first was a project on the early diagnosis of autism, which was a longitudinal study of toddlers referred for possible autism starting at age 2 ; 0. Exclusionary criteria included moderate to severe sensory impairments or cerebral palsy, known genetic abnormalities or poorly controlled seizures. The present investigation included 126 participants from this larger study who contributed 186 data points. Data for the present study were also collected through two longitudinal studies of children at high risk for developing ASD. Children were repeatedly evaluated starting at approximately age 1 ; 0. These two studies contributed 27 participants who collectively contributed 47 data points.
Participants
There were 153 children from the investigations described above with sufficient data (i.e. had at least one completed Words and Gestures CDI or composite version of the Words and Gestures and Words and Sentences versions, as well as diagnostic and cognitive testing) to be included in the present study. Three diagnostic groups comprise the sample: children with ASD (either autism, n=66 participants; or PDD-NOS, n=27 participants), children with developmental delay (DD, n=31 participants) and typically developing children (n=29 participants), who were assessed as a control group (see Table 1).
TABLE 1. Participant demographics
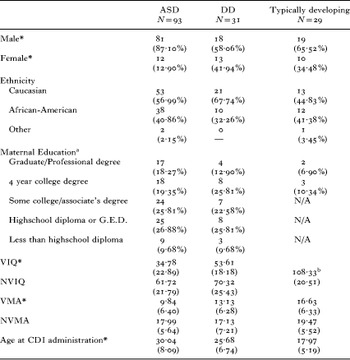
* groups signficantly different, p<0·001.
a Maternal education data missing for 24 typically developing participants and one participant with developmental delay.
b IQ data for typically developing participants are Full-Scale scores from the Bayley Scales of Infant Development (Bayley, Reference Bayley1993).
The ASD group was comprised of 81 males, 12 females; 53 Caucasian, 38 African-American, and two multi/other race. The DD group (18 males, 13 females; 21 Caucasian, 10 African-American) included children with mental retardation (n=15 participants), Mixed Receptive-Expressive Language Disorder (n=5 participants), chromosomal abnormalities (n=4 participants), Expressive Language Disorder (n=4 participants), Phonological Disorder (n=1 participant), Tourette's Disorder (n=1 participant) and Down Syndrome (n=1 participant). Children in the DD group met the same exclusionary criteria and had never been diagnosed with autism by age 2 ; 0. (Although some had been referred for possible autism, none ever received a diagnosis of autism upon assessment.) The typically developing group consisted of 19 males and 10 females; 13 Caucasian, 12 African-American, and one multi/other race, whose parents were recruited from local church groups in North Carolina to be comparable in socioeconomic status and ethnicity to the North Carolina children with ASD and DD.
Procedure
All children were assessed at multiple time-points. All families underwent a two-part standardized assessment at the initial evaluation. Most frequently, parents were interviewed in their homes prior to the child assessment and were asked to complete a number of caregiver report measures. Children were evaluated at a nearby clinic.
Measures
A number of diagnostic, cognitive and language measures were used at the initial evaluation, as well as at each follow-up assessment. A research associate administered a Toddler version of the Autism Diagnostic Interview – Revised (ADI-R: LeCouteur, Lord & Rutter, Reference LeCouteur, Lord and Rutter2003; Lord, Shulman & DiLavore, Reference Lord, Shulman and DiLavore2004), a standardized caregiver interview that generates separate scores in socialization, communication and restricted and repetitive behaviors for children referred for possible autism. All children received a version of the Autism Diagnostic Observation Schedule (either the Pre-Linguistic ADOS/PL-ADOS: DiLavore, Lord & Rutter, Reference DiLavore, Lord and Rutter1995; or the ADOS: Lord et al., Reference Lord, Risi, Lambrecht, Cook, Leventhal, DiLavore, Pickles and Rutter2000), which is a semi-structured, standardized assessment of communication, social interaction and play for children who have been referred for possible autism.
The specific cognitive and developmental tests administered to each child were chosen according to the observed developmental level of the child (to ensure that each child reached a basal score on every test). Moreover, tests differed according to age, because many of these tests are standardized according to chronological age and developmental level. At ages 2 ; 0 and 3 ; 0, the Mullen Scales of Early Learning (MSEL: Mullen, Reference Mullen1995) were most often used. The MSEL is a developmental test intended for children between the ages of 0 ; 1 and 5 ; 8. For older children, the Differential Ability Scales (DAS: Elliott, Reference Elliott1990) was typically administered. The DAS is a measure of cognitive abilities which assesses verbal and non-verbal skills separately. The preschool edition of the test is divided into lower preschool (ages 2 ; 6–3 ; 6) and upper preschool (ages 3 ; 6–6 ; 0), while the school-age edition is intended for children ages 5 ; 0 through 17 ; 0. The selection of cognitive tests followed a standard hierarchy. If a child did not have sufficient language to be administered the DAS, then he or she was administered the MSEL. Standard scores were obtained for each child if possible (based on the performance and age of the child), and ratio scores were calculated using the child's age equivalent (i.e. mental age) scores and chronological age.
Two versions of the MacArthur-Bates Communicative Development Inventory (CDI: Fenson et al., Reference Fenson, Dale, Reznick, Thal, Bates, Hartung, Pethick and Reilly1993) were used (Words and Gestures and an earlier composite version of the Words and Gestures and Words and Sentences forms) according to the developmental level of the child and instrument availability. The Words and Sentences version was not included because it does not allow for a receptive vocabulary score and does not include the Actions and Gestures sections. The vast majority of assessments (184 of 233) used the Words and Gestures version.
Clinical diagnoses for each participant were made by two examiners, who met immediately following the assessment to review the cognitive and language test results, the text from the ADI-R and the content of the ADOS (but not the scores). Based on this information, they proposed a binary clinical diagnosis (autism, not autism), with a certainty rating for one or the other. A final ‘best estimate’ diagnosis of autism, PDD-NOS or non-spectrum was then made using all available information.
Design and analytic plan
In order to maximize the usefulness of the data, each assessment was treated as a separate case. Mixed model analyses were used (Verbeke & Molenberghs, Reference Verbeke and Molenberghs2000) that took into account the lack of independence resulting from a single participant contributing two or more cases (which applied to 52 participants), resulting in 153 participants contributing a total of 233 cases: 153 ASD, 51 DD and 29 typically developing children. All parametric analyses reported below (i.e. t-tests, ANOVAs) using these 233 cases were completed using mixed model analyses (note: these analyses often produce fractional degrees of freedom). Adjustments were made (see ‘Results’ section for specifications) in all non-parametric tests in order to correct for the lack of independence of cases.
Analyses compared mastery on the CDI according to three sets of groups. The first two sets of groupings included only the ASD group and were based on two categorical sets of ‘bands’ used by Charman and colleagues (Reference Charman, Drew, Baird and Baird2003b) : one based on non-verbal mental age, where data were missing in seven cases (NVMA; n=226 cases) and one based on chronological age (CA) at the time of assessment (n=233 cases). Non-verbal mental age was derived by averaging a child's age equivalents on the non-verbal subtests of the cognitive assessments (i.e. either the DAS or the MSEL, which have been shown to be highly related for young children with ASD; Taylor, Pickering, Lord & Pickles, Reference Taylor, Pickering, Lord, Pickles, Everitt and Dunn1998). These two sets of bands are drawn from the same 233 cases but are distributed across the categories differently. The bands varied slightly from those reported in Charman and colleagues (Reference Charman, Drew, Baird and Baird2003b) in order to reduce disparity between cell sizes (see Table 2); results for these two sets of groupings are based only on the children with ASD (divided in autism and PDD-NOS subgroups for reasons discussed below) and are reported in ‘Section one’ of the results. (note: Because this was primarily a replication study, comments on how the current results compare to those of Charman et al. (Reference Charman, Drew, Baird and Baird2003b) are included in the ‘Results’ section for ease of interpretation, rather than reserving them for the discussion.) The third set of comparisons is based on diagnostic group: autism, PDD-NOS, DD and typically developing, and is presented in ‘Section two’ of the ‘Results’.
TABLE 2. Characteristics of autism and PDD-NOS participants by NVMA and CA bands

Data from both versions of the CDI (Words and Gestures and the composite version) were used. However, in order to compare across versions, only those items that were on both versions (Part I: First Signs of Understanding, Phrases, Starting to Talk, 392 vocabulary items, and all of Part II: Actions and Gestures) were included in the following analyses. Furthermore, according to the guidelines presented by the authors of the CDI (Fenson et al., Reference Fenson, Dale, Reznick, Bates, Thal and Pethick1994), the first two sections of the Actions and Gestures segment – First Communicative Gestures and Games and Routines – are referred to as the ‘early’ gestures, based on when they would be expected to appear in typical development. The last three sections (Actions with Objects, Pretending To Be a Parent and Imitating Other Adult Actions) are termed the ‘late’ gestures, because they tend to emerge later in normal development. Norms used to compare the current sample to typically developing children were used from the first printing of the MacArthur Communicative Development Inventories: User's Guide and Technical Manual by the Paul H. Brookes Publishing Company in 2002 (norms vary slightly with different editions of the manual).
RESULTS
Section one: CDI scores according to diagnostic classification, non-verbal mental age and chronological age for children with ASD
Preliminary analyses using linear mixed models indicated that the autism (n=99 cases) and PDD-NOS (n=54 cases) groups were significantly different on verbal IQ (autism: M=30·88, SD=23·32; PDD-NOS: M=60·52, SD=30·81; t (94·14)=−5·50, p<0·001) and non-verbal IQ (autism: M=58·52, SD=23·38; PDD-NOS: M=78·30, SD=22·89; t (92·95)=−4·25, p<0·001), with the autism group scoring lower than the PDD-NOS group in both instances. The two groups did not differ in age at CDI administration. Within the ASD groups, although there were more cases from male participants (n=132 cases from 81 participants) than from females (n=21 cases from 12 participants), there were no gender differences in verbal IQ, non-verbal IQ or age at assessment.
The autism and PDD-NOS groups differed on a number of summary scores for CDI variables. Non-verbal IQ (NVIQ) was covaried for all analyses below in order to test if there were differences in communication beyond those accounted for by level of cognitive impairment. Even after covarying NVIQ, a group difference remained between the autism and PDD-NOS groups in the number of words understood such that the autism group as a whole was reported to understand fewer words (M=76·61, SD=86·87) than the PDD-NOS group (M=187·07, SD=112·24), t (85·16)=−3·71, p<0·001. The autism group was also reported to produce significantly fewer words on average than the PDD-NOS group, 24·01 (SD=69·72) and 102·52 words (SD=120·77) respectively, t (82·72)=−3·06, p<0·01. Number of late appearing gestures (Sections C through E: Actions with Objects, Pretending To Be a Parent and Imitating Other Adult Actions) showed a group difference, such that the autism group (M=13·77, SD=10·28) had fewer skills than the PDD-NOS group (M=22·73, SD=12·72), t (90·03)=−2·91, p<0·01. A group difference also remained in the number of phrases understood, again with the autism group reported to have fewer phrases understood (M=11·56, SD=8·03) than the PDD-NOS group (M=19·28, SD=7·50), t (80·50)=−3·11, p<0·01, and in number of First Signs of Understanding/Starting to Talk [autism: M=2·62, SD=1·40; PDD-NOS: M=3·93, SD=1·20; t (63·92)=−4·52, p<0·001]. No group difference was found in number of early appearing gestures (Sections A and B: First Communicative Gestures and Games and Routines).
These findings are dissimilar to those of Charman et al. (Reference Charman, Drew, Baird and Baird2003b), who (when NVIQ was covaried) found a group difference only in number of early gestures between their autism and atypical autism/other PDD groups. Charman et al. (Reference Charman, Drew, Baird and Baird2003b) consequently conducted all further analyses on the ASD sample as a whole (including autism and PDD-NOS together). However, because of the preliminary findings reported above (which indicate substantial group differences) all analyses reported below were conducted for the autism (n=99 cases; chronological age: M=34·67, SD=11·07) and PDD-NOS (n=54 cases; chronological age: M=32·92, SD=15·75) groups separately.
First Signs of Understanding and Starting to Talk
There are five questions in the CDI's First Signs of Understanding (three questions covering response to name, response to there's mommy/daddy, and response to no no) and Starting to Talk (two questions covering the child's imitation of words and labeling objects) sections; these items cover basic skills in comprehension and production of language. Because of the differences in the ages at which these behaviors are expected to appear, analyses of whether each individual item was passed are used instead of an overall score. The non-parametric analyses were modified using an ad hoc correction to take into account the lack of independence of cases. Results indicated that none of the three First Signs of Understanding was more common with higher NVMA. ‘Respond when name is called’ increased with CA for the autism group only (χ2=9·02, df=3, p<0·05). As described by Charman and colleagues (Reference Charman, Drew, Baird and Baird2003b), significantly more children with autism (but not PDD-NOS) were reported to respond to their name (autism: 72·7%; PDD-NOS: 90·7%) and to no no (autism: 79·8%; PDD-NOS: 92·6%) than to there's mommy/daddy (autism: 58·6%; PDD-NOS: 90·7%) (McNemar sign test, χ2=9·25, df=1, p<0·01; and χ2=8·43, df=1, p<0·01, respectively).
Only one item in the Starting to Talk section increased with higher NVMA, and results differed across diagnostic groups. The autism group (but not the PDD-NOS group) showed an increase in labeling objects (χ2=12·84, df=3, p<0·01). Neither item showed a change with increasing CA. Similar to the developmental patterns found in the ASD sample of Charman and colleagues (Reference Charman, Drew, Baird and Baird2003b) and typical samples previously reported (Fenson et al., Reference Fenson, Dale, Reznick, Thal, Bates, Hartung, Pethick and Reilly1993), the children in the present sample were more likely to imitate words (autism: 34·3%; PDD-NOS: 68·5%) than to label things (autism: 16·2%; PDD-NOS: 50·0%; McNemar, χ2=9·01, df=1, p<0·01 for the autism group and χ2=11·90, df=1, p<0·001 for the PDD-NOS group).
There was a substantial delay in the appearance of most of the skills in the First Signs of Understanding and Starting to Talk sections in the present ASD sample. In typical development, more than 90% of children demonstrate each of the First Signs of Understanding by age 0 ; 10. Over 70% of typically developing children are reported to imitate words by 1 ; 0, and over half label objects by 1 ; 2. Attainment of these skills was somewhat uneven over the autism and PDD-NOS groupings (see Table 3 for proportions), although the most generally delayed skills were ‘reacts to there's mommy/daddy’ and the two Starting to Talk items.
TABLE 3. Proportion of children with autism and PDD-NOS who mastered each item by NVMA and CA bands

Phrase comprehension and receptive and expressive vocabulary
Children with autism and PDD-NOS showed increased understanding of phrases with increasing NVMA (ANOVA; autism: F(3, 91·30)=5·86, p<0·01; PDD-NOS: F(3, 32·99)=11·75, p<0·001). Only the children in the PDD-NOS group had increased phrase comprehension with increasing CA (ANOVA; F(3, 36·92)=3·97, p<0·05). However, phrase comprehension was delayed relative to norms. Even those children with autism who were in the highest NVMA and CA bands were not yet able to understand 20 phrases. In the PDD-NOS group, only those children in the highest bands (i.e. at least 2 ; 1 NVMA and 3 ; 4 CA) had reached that milestone. CDI norms based on typically developing boys (boys are used as a comparison group since the present sample was predominantly male) show that children performing at the 50th percentile are able to understand 20 phrases by 1 ; 3 (Fenson et al., Reference Fenson, Dale, Reznick, Thal, Bates, Hartung, Pethick and Reilly1993).
Analyses indicated that the number of words understood grew with increasing NVMA for both groups (ANOVA; autism: F(3, 91·62)=14·72, p<0·001; PDD-NOS: F(3, 41·20)=6·73, p<0·01) and CA for the PDD-NOS group only (ANOVA; F(3, 36·02)=11·67, p<0·001). Again, the present sample was substantially delayed relative to published norms. According to the NVMA bands, children with autism did not consistently understand more than 100 words until they had a NVMA of at least 2 ; 1 (1 ; 4 in the PDD-NOS group). Even the highest CA band in the autism group did not yet reach this milestone, but the PDD-NOS group had surpassed it by 1 ; 8. Norms indicate that typically developing boys at the 50th percentile understand 100 words by 1 ; 2 (Fenson et al., Reference Fenson, Dale, Reznick, Thal, Bates, Hartung, Pethick and Reilly1993).
Similar results were found in the number of words produced (log transform used), which increased with higher NVMA (ANOVA; autism: F(3, 49·31)=11·76, p<0·001; PDD-NOS: F(3, 34·33)=9·82, p<0·001). Number of words produced increased with higher CA for the PDD-NOS group only (ANOVA; F(3, 36·36)=3·19, p<0·05). The children in the autism sample did not consistently produce 30 words until they had a NVMA of at least 2 ; 1 (1 ; 4 in the PDD-NOS group) and were at least 3 ; 4 (1 ; 8 in the PDD-NOS group). Forty-eight cases in the autism group were reported to produce no words (mean CA=34·64 months, SD=10·69, range 19–72 months), and the same was true for only 9 cases in the PDD-NOS group (mean CA=30·78 months, SD=10·16, range 16–46 months). The children at the 50th percentile of the typically developing standardization sample (again, just males) were reported to have 30 words produced by 1 ; 4 (Fenson et al., Reference Fenson, Dale, Reznick, Thal, Bates, Hartung, Pethick and Reilly1993).
As in Charman et al. (Reference Charman, Drew, Baird and Baird2003b), the autism and PDD-NOS groups showed considerable variability in word production and phrase and word comprehension. Figures 1 to 3 indicate the box plot distributions (excluding outliers) for these variables, as well as the 25th (dotted line), 50th (solid line) and 75th (dotted line) percentile scores for the normative data. Norms from the CDI standardization indicate that typically developing boys at 1 ; 4 understand between 19 phrases (at the 25th percentile) and 26 phrases (at the 75th percentile). In number of words understood, typically developing boys understand between 126 (25th percentile) and 237 words (75th percentile) at 1 ; 4. Word production for typically developing boys at 1 ; 4 is between 11 (25th percentile) and 58 (75th percentile). These plots reveal that some children with autism or PDD-NOS had scores within the normal range, although the majority of children were considerably delayed. Charman et al. (Reference Charman, Drew, Baird and Baird2003b) reported similar findings of a general delay with some children falling within the normal range.

Fig. 1. Boxplot of phrase comprehension for autism and PDD-NOS groups by NVMA band.

Fig. 2. Boxplot of words understood for autism and PDD-NOS groups by NVMA band.

Fig. 3. Boxplot of words produced for autism and PDD-NOS groups by NVMA band.
Gestures
The next set of analyses looked at gesture use. With increasing NVMA, children showed a significant increase in the production of: (A) First Communicative Gestures in the autism group only (ANOVA; F(3, 93·59)=4·41, p<0·01); (B) Games and Routines in the autism group only (ANOVA; F(3, 91·42)=3·52, p<0·05); (C) Actions with Objects in the autism group only (ANOVA; F(3, 92·62)=9·72, p<0·001); (D) Pretending To Be a Parent (log transform used) (ANOVA; autism: F(3, 40·02)=6·92, p<0·01; PDD-NOS: F(3, 35·71)=4·23, p<0·05); and (E) Imitating Other Adult Actions (ANOVA; autism: F(3, 92·01)=8·66, p<0·001; PDD-NOS: F(3, 41·97)=3·57, p<0·05). In contrast to previous research (Charman et al., Reference Charman, Drew, Baird and Baird2003b), increasing CA was also associated with greater skills in (C) Actions with Objects in the PDD-NOS group only (ANOVA; F(3, 35·24)=5·18, p<0·01) and in (D) Pretending To Be a Parent (log transform used) (ANOVA; autism: F(3, 38·90)=2·93, p<0·05; PDD-NOS: F(3, 32·02)=4·26, p<0·05). See Table 4 for means and standard deviations according to NVMA and CA bands.
TABLE 4. Mean (SD) gesture use for children with autism and PDD-NOS by NVMA and CA bands

Note: First Communicative Gestures and Games and Routines are considered to be ‘early’ gestures; Actions with Objects, Pretending To Be a Parent and Imitating Other Adult Actions are considered ‘late’ gestures. Number of items in each category indicated in parentheses.
As with the other sections, children with ASD were considerably delayed (see Figures 4 and 5 for boxplots of the ASD sample; mean of normative sample of boys at 1 ; 4 months is indicated with the horizontal solid line, and 25th and 75th percentiles are indicated by dotted lines) in their development of gestures, both early (sections A and B) and late (sections C through E). The children with autism in this sample did not produce 10 early gestures until they had an NMVA of at least 2 ; 1 (1 ; 4 in the PDD-NOS group). Even the highest CA band in the autism group was not yet producing 10 early gestures, but the PDD-NOS group attained this milestone by 1 ; 9. In contrast, the norms for typical boys at the 50th percentile indicated that 10 early gestures are mastered by 1 ; 0 (Fenson et al., Reference Fenson, Dale, Reznick, Thal, Bates, Hartung, Pethick and Reilly1993). Late gestures were also somewhat delayed, with the autism sample demonstrating only slightly more than 15 at a NVMA of 1 ; 6 (also 1 ; 6 in the PDD-NOS group) and a chronological age of 3 ; 4 (1 ; 9 in the PDD-NOS group). Norms suggest that typically developing children have mastered 15 late gestures by 1 ; 1 (Fenson et al., Reference Fenson, Dale, Reznick, Thal, Bates, Hartung, Pethick and Reilly1993).

Fig. 4. Boxplot of early gestures for autism and PDD-NOS groups by NVMA band.

Fig. 5. Boxplot of late gestures for autism and PDD-NOS groups by NVMA band.
Developmental trajectories in gestures are shown in Figure 6. Percent of total gestures (rather than a raw score) was used because the early gestures only had a possible total of 18 gestures, whereas there were 45 late gestures in sum. Two lines represent the normative data for the CDI and two represent the performance of the current ASD sample (because trajectories did not meaningfully differ across groups, the autism and PDD-NOS groups have been put together for ease of interpretation). Both categories of gestures increase with increasing vocabulary comprehension for the ASD and the typical sample. However, when controlling for level of comprehension, there is a much greater discrepancy in mastery of early gestures across the two diagnostic groups than in late gestures, in which the typically developing children and the current ASD sample are much closer in their reported acquisition of skills. These findings are in contrast to those reported by Charman et al. (Reference Charman, Drew, Baird and Baird2003b), who used raw numbers of gestures (rather than percent of items mastered) and found that whereas late gestures continued to develop with increasing expressive vocabulary, mastery in early gestures remained relatively unchanged from 20 words understood onward.

Fig. 6. Percent of early and late gestures mastered by comprehension level.
Section two: CDI scores across diagnostic groups
Preliminary analyses of the data from the typically developing group indicated that the typically developing children (age: M=17·97, SD=5·19) had mastered fewer skills than the published norms (Fenson et al., Reference Fenson, Dale, Reznick, Thal, Bates, Hartung, Pethick and Reilly1993) for typically developing boys of their age. At almost 1 ; 6, our typically developing sample was performing equivalent to children age 1 ; 2 at the 50th percentile in phrase comprehension (M=19·14, SD=7·73) and total gesture production (M=35·76, SD=14·02). In number of words understood, our typically developing sample, at slightly under 1 ; 6, was performing similar to children age 1 ; 3 at the 50th percentile (M=155·93, SD=110·13). Direct comparisons were not possible for number of words produced because our typically developing sample was performing above the norms (1 ; 4 ceiling on the Words and Gestures version).
The next set of analyses compared summary scores on the CDI across diagnostic groups (see Table 5 for means and standard deviations). The total for each section is provided at the top of the column. The mixed model analyses reported below covaried non-verbal mental age. Mixed models indicated a fixed effect of diagnostic group on the number of reported First Signs of Understanding and productive communication skills, heretofore called the ‘pre-speech’ items (ANOVA; F(3, 140·70)=19·80, p<0·001), with the autism group scoring significantly lower than the PDD-NOS, DD and typical groups (p<0·001), which were not significantly different from each other. The same pattern was found, with the autism group scoring lower than the other groups (p<0·001), for phrase comprehension (ANOVA; F(3, 134·10)=13·56, p<0·001), number of late gestures (ANOVA; F(3, 138·59)=10·08, p<0·001), number of words understood (ANOVA; F(3, 147·10)=13·72, p<0·001) and number of words produced (ANOVA; F(3, 76·24)=8·22, p<0·001). An effect of diagnostic group was also found for number of early gestures (ANOVA; F(3, 143·76)=14·47, p<0·001), with the autism group scoring significantly lower than all other groups (p<0·001), and the PDD-NOS group scoring significantly lower than the DD and typically developing groups (p<0·01), which were not significantly different from each other.
TABLE 5. Mean (SD) scores in each CDI section by diagnostic group

Note: Number of items in each category indicated in parentheses.
Vocabulary profile across diagnostic group
The next set of analyses assessed whether the four diagnostic groups (autism, PDD-NOS, DD and typically developing) differed on the representation of form classes in their entire receptive and expressive vocabulary as reported on the CDI. To do this, the CDI sections were organized according to the methods used by Bates and colleagues (Reference Bates, Marchman, Thal, Fenson, Dale, Reznick, Reilly and Hartung1994), who investigated the composition of early vocabulary in typically developing children using the CDI Words and Sentences. Minor modifications were used because of the differences between the Words and Sentences and Words and Gestures version, resulting in the following categories: (1) Nouns (182 items, 46·43% of total checklist); included the sections on Animal Names, Vehicles, Toys, Food and Drink, Clothing, Body Parts, Furniture and Rooms and Small Household Items; (2) Predicates (92 items, 23·47% of total checklist); included sections on Action Words and Descriptive Words; (3) Closed class (35 items, 8·92% of total checklist); included sections on Pronouns, Question Words, Prepositions and Locations and Quantifiers.
The sections on Sound Effects and Animal Sounds, Outside Things and Places to Go, People, Games and Routines and Words about Time were excluded for reasons discussed by Bates and colleagues (Reference Bates, Marchman, Thal, Fenson, Dale, Reznick, Reilly and Hartung1994), who suggested that words in these categories may follow a different developmental trajectory. Each child's performance was based on the proportion of their entire lexicon (as reported on the CDI) was comprised by each of these three categories: nouns, predicates and closed class items. Mixed models were used, controlling for VMA and NVMA.
Results from the mixed models comparing autism, PDD-NOS, DD and typically developing groups on the proportion of their complete receptive and expressive vocabulary profile comprised by each of these three classes indicated no group differences (see Table 6). These results are consistent with those reported by Charman et al. (Reference Charman, Drew, Baird and Baird2003b).
TABLE 6. Percent (SD) of children's receptive (Rec.) and expressive (Exp.) vocabulary represented by form classes

Intercorrelations
Correlations between word comprehension, word production and gesture use for each diagnostic group (with and without NVMA partialled out) are reported in Table 7. Pearson product moment correlations were used, and scores across time-points (i.e. cases) were averaged for each participant in order to avoid the confound of non-independent data points. Correlations across groups were similar, although the correlation between word comprehension and word production (with NVMA partialled out) was significantly lower in the DD group than in autism group (z=2·21, p<0·05) (Blalock, Reference Blalock1960). We believe this reflects the fact that, in the DD group, very low scores in word production often occurred in the context of quite low NVMA. This limited range of variability was not observed to the same degree in comparison groups.
TABLE 7. Intercorrelations of CDI summary scores by diagnostic group

* p<0·05
** p<0·01
*** p<0·001.
The ‘bridge hypothesis’ (Volterra & Erting, Reference Volterra and Erting1990) proposes that young children (between 0 ; 8 and 1 ; 4) use gestures as a transition in moving from language comprehension to language production. Both Fenson et al. (Reference Fenson, Dale, Reznick, Bates, Thal and Pethick1994) and Charman et al. (Reference Charman, Drew, Baird and Baird2003b) have found confirmation for this, such that if age and the 3rd variable are partialled out, only the correlations between word comprehension and gestures and word comprehension and word production remain significant, and the relationship between word production and gestures does not. Results for all four diagnostic groups in the current sample were generally consistent with this profile (see Table 8), although, as above, the correlation between word comprehension and word production (with NVMA and gestures partialled out) was significantly lower in the DD group than in autism group (z=2·73, p<0·05).
TABLE 8. Partial correlations of CDI summary scores (with NVMA and 3rd variable partialled out) by diagnostic group

* p<0·05
** p<0·01
*** p<0·001.
Developmental trajectories
As in Charman et al. (Reference Charman, Drew, Baird and Baird2003b), word production in the children with autism and PDD-NOS was advanced relative to word comprehension when compared with typical developmental norms provided by the CDI authors (see Figure 7) but not when compared to the typical group within the present sample. When only the typically developing children who were within the designated age range for the Words and Gestures version are included in this analysis, the difference between the normative sample and the present typically developing sample was diminished, in part because the distribution was truncated.

Fig. 7. Growth in number of words produced by number of words understood.
DISCUSSION
Scores within the ASD group were analyzed to address the following concerns:
Are there differences in scores on the CDI between children with autism and children with PDD-NOS?
The current investigation found substantial differences in scores between children with autism and PDD-NOS, which was discrepant from the findings of Charman et al. (Reference Charman, Drew, Baird and Baird2003b). We are unsure of the reason for this difference; it may be attributable to the diagnostic process used. It is not clear exactly how the diagnoses were made in the paper by Charman et al. (Reference Charman, Drew, Baird and Baird2003b). We know that there is considerable variation in diagnostic approaches, particularly in how PDD-NOS is used (Klin, Pauls, Schultz & Volkmar, Reference Klin, Pauls, Schultz and Volkmar2005), which necessarily affects who is diagnosed with autism. Although the algorithms of the ADI-R and ADOS are in accordance with the ICD-10 (World Health Organization, 1992) standards used by Charman et al. (Reference Charman, Drew, Baird and Baird2003b), our diagnoses were relatively strict, employing both ADI-R and ADOS criteria even for younger children. As a result, our diagnoses of autism may have been more conservative than those of Charman et al. (Reference Charman, Drew, Baird and Baird2003b), which could have accounted for larger differences between the autism and PDD-NOS subgroups.
Overall, the present investigation found that the PDD-NOS group was not as impaired as the autism group, both in terms of the extent of their delay and in terms of the number of areas in which their scores differed from the non-ASD comparison groups. Nevertheless, the PDD-NOS sample did show a delay in nearly all areas measured by the CDI. We believe these findings are theoretically and clinically informative. Ideally, we could consider the severity of ASD on a continuum, but we do not yet have metrics to do this. However, the present findings indicated that a best estimate diagnostic distinction between autism and PDD-NOS made at an early age (and by experienced clinicians using standardized measures) can be meaningful, at least within a center with standard diagnostic protocols. That is, children given PDD-NOS diagnoses (as opposed to autism diagnoses) were not experiencing the same pervasive delay in communicative and social skills observed in children with autism. These diagnostic distinctions have also been shown to be predictive, along with other skills, of skills at later ages (Lord, Risi, DiLavore, Shulman, Thurm & Pickles, Reference Lord, Risi, DiLavore, Shulman, Thurm and Pickles2006). We do not take these results to indicate that autism and PDD-NOS are categorically distinct, nor are we certain that these distinctions are useful when comparing samples where diagnoses are less standardized. However, in this sample, the symptomatology of the children with PDD-NOS involved less developmental delay and more specific qualitative impairments of social and communicative functioning than the children with autism.
Do skills as measured by the CDI increase with increasing non-verbal mental age and chronological age in ASD?
Increasing non-verbal mental age was consistently associated with increasing skill level in vocabulary and non-verbal communication, object use and play skills. Chronological age was associated with level of communicative skill as well, but the association was somewhat less consistent across domains. Evidence of increasing skill with increasing non-verbal mental age and chronological age is an encouraging finding for those who work therapeutically and educationally with children with ASD. Children with autism and PDD-NOS do show improvement in communication with increasing non-verbal cognitive development and chronological age.
How do the scores observed in the ASD sample compare to published norms?
Consistent with Charman et al. (Reference Charman, Drew, Baird and Baird2003b), some children with ASD showed development that was within normal age expectations. However, most of the children with ASD in this sample showed marked delays in the appearance of vocabulary and non-verbal social-communicative skills (Fenson et al., Reference Fenson, Dale, Reznick, Bates, Thal and Pethick1994). It is of note that the children in the current ASD sample, and particularly those with autism as opposed to PDD-NOS, generally did not attain the skill level reported for children slightly over one year of age (according to published norms) until they had reached a non-verbal mental age of over two years old. This finding recalls previous reports of children with autism requiring a higher mental age than typically developing children in order to reach other cognitive milestones (Happe, Reference Happe1995). Together, these results suggest that children with ASD may follow unique developmental pathways, such that the route to certain skills (e.g. vocabulary, gestures) may be more indirect (i.e. require more prerequisite skills) or that learning may be more laborious.
Not surprisingly, the areas that were most delayed for the present autism and PDD-NOS groups were those requiring language (Starting to Talk items, vocabulary comprehension and production) and social-communication skills such as those found in the early gesture items. Although the ASD sample did show a delay in the late gesture items, it was less profound than their delays in other areas of performance. Unlike the study by Charman and colleagues (Reference Charman, Drew, Baird and Baird2003b), which used raw numbers in their analyses of gesture production, the current study used percent of total early and late gestures because of the discrepant number of items across sections. This permitted us to compare across the early and late categories and revealed that children with ASD showed steady improvements in both early and late gestures. They lagged further behind the typically developing children in the normative data in the early gestures items than in the late gestures items, but nevertheless they continued to show improvement in gesture use with increasing vocabulary comprehension. This finding points to the importance of considering how the results of an assessment, particularly from one evaluation to the next, may be influenced by the limits of the measure used.
It is useful to note, however, that although most children with ASD were delayed in the mastery of communication skills, there were some children on the autism spectrum that were within a normal range of development for one or many of these domains, as also reported by Charman and colleagues (Reference Charman, Drew, Baird and Baird2003b). This is useful knowledge both in theory and in practice, because it serves as a reminder that a child with some age-appropriate social-communication skills can have ASD (Charman et al., Reference Charman, Swettenham, Baron-Cohen, Cox, Baird and Drew1998).
Scores for the entire sample (autism, PDD-NOS, developmental delay and typical development) were analyzed to address the following questions:
Do CDI scores differ across diagnostic groups?
The autism sample was impaired in all areas measured by the CDI, except number of early gestures, relative to the children with PDD-NOS, DD and typical development. In the early gestures sections, the autism group was the most delayed, but scores in the PDD-NOS group were also lower than those reported for the DD and typically developing groups.
Does lexical composition differ across diagnostic groups?
There has been considerable discussion about language profiles in ASD, with some researchers arguing (at least until recently) that children with ASD showed deficits primarily in the pragmatics of language while other areas (i.e. phonetics, semantics, syntax) remained intact or generally delayed (Wilkinson, Reference Wilkinson1998). However, recent results suggest that children with autism do show impairments in many areas of language, namely grammar and morphosyntax (Tager-Flusberg & Joseph, Reference Tager-Flusberg and Joseph2003), that had previously been proposed to be unaffected. In this study, children with ASD showed a similar vocabulary profile (both receptively and expressively) to children with non-ASD DD and typical development. This finding is consistent with previous findings (Tager-Flusberg et al., Reference Tager-Flusberg, Calkins, Nolin, Baumberger, Anderson and Chadwick-Dias1990; Charman et al., Reference Charman, Drew, Baird and Baird2003b) and is valuable in clarifying the areas of deficit (i.e. vocabulary size) and relative intactness (i.e. vocabulary composition) in ASD.
What is the relationship between verbal communication and non-verbal communication on the CDI?
The ‘bridge hypothesis’ described the patterns of development in all three diagnostic groups (ASD, DD and typical), such that their acquisition of gestures appeared to bootstrap vocabulary production. This consistency suggests that there are some commonalities in underlying mechanisms of language development. This finding is similar to previous research, which has implicated the skills included in the CDI gestures sections (such as joint engagement, gestures, play and imitation) in language development for both typically developing children (e.g. Carpenter, Nagell, Tomasello, Butterworth & Moore, Reference Carpenter, Nagell, Tomasello, Butterworth and Moore1998) and children with ASD (Charman et al., Reference Charman, Baron-Cohen, Swettenham, Baird, Cox and Drew2003a; Sigman & McGovern, Reference Sigman and McGovern2005; Luyster, Qiu, Lopez & Lord, in press). The present results are intriguing, in that they imply multiple steps within the language learning process. However, both the present investigation and Charman et al. (Reference Charman, Drew, Baird and Baird2003b) used parent reports and cross-sectional models. More evidence is needed from longitudinal samples, direct observation and experimental approaches.
What is the relationship between receptive and expressive vocabulary on the CDI?
In contrast to the similarities to typically developing children in lexical composition and gesture and vocabulary learning, the relationships between developmental trajectories shown by children with ASD in word comprehension and production were qualitatively different than those observed in children with typical development. When compared to published norms, children with ASD were advanced in expressive vocabulary relative to their receptive vocabulary, as has already been reported (Charman et al., Reference Charman, Drew, Baird and Baird2003b). This finding suggests that there may be less of a discrepancy between receptive and expressive vocabulary in children with ASD than in typically developing children, although receptive vocabulary remains more extensive than expressive.
However, because the CDI forms are often used with children with developmental disorders and delay who are over the 1 ; 4 cut-off for the instrument, it is difficult to determine how much of this effect may be due to age differences and how much is due to variation in developmental trajectories. That is, it may be that the observed discrepancy between receptive and expressive vocabulary is due more to an effect of chronological age than disordered development. Although a relative strength in either expressive or receptive vocabulary is difficult to substantiate because of important qualitative characteristics of early language in children with ASD (i.e. how functional expressive language is, how much receptive language depends on context rather than the words themselves), it certainly may be the case that there is a different developmental pathway for receptive and expressive vocabulary development in children with ASD as compared to children without ASD. Future research should investigate this possibility further, perhaps using experimental methods.
The current study has some methodological limitations. The DD group is a heterogeneous group of children and is not representative of any diagnostic category in particular. Furthermore, our typically developing sample was small, and we could not conclude that they were similar to our ASD group in socioeconomic status, a factor which may influence parental report of behaviors (Roberts, Burchinal & Durham, Reference Roberts, Burchinal and Durham1999). Although we attempted to control for participants being represented multiple times in the data by using mixed models, our use of longitudinal data in a cross-sectional manner may have had some bearing on our results. Ideally, future research would confirm findings using independent cases. Last, our investigation of form classes in children's vocabulary was limited by our use of very broad categories.
Overall, the findings contribute to the understanding of early social-communication in children with ASD. As previous investigations have suggested, results indicate that the CDI may be particularly useful with children with ASD at early stages of language development. For the most part, there is fair consistency between the findings in the present study and other similar investigations (Charman et al., Reference Charman, Drew, Baird and Baird2003b). Furthermore, it is encouraging that the current study, which used data from parent report, yields similar findings as previous studies using observational measures in regards to a general delay in development (Chakrabarti & Fombonne, Reference Chakrabarti and Fombonne2001; Fombonne, Reference Fombonne, Volkmar, Paul, Klin and Cohen2005), diversity of social-communication profiles (Tager-Flusberg & Joseph, Reference Tager-Flusberg and Joseph2003) and an apparent discrepancy in receptive and expressive language (Bartak, Rutter & Cox, Reference Bartak, Rutter and Cox1975). These findings may be viewed as evidence for the validity of the CDI in particular, and parent report measures in general (Taylor et al., Reference Taylor, Pickering, Lord, Pickles, Everitt and Dunn1998). While further research should continue to evaluate agreement among parent reports, behavioral observations and traditional standardized testing, the CDI is a quick, easily administered assessment of a child's current level of functioning, which is particularly useful for those children who have such limited language that they receive no or minimally useful scores on formal language tests.


