Introduction
By 2010, there were an estimated 125 million missing women globally, of which 43.3 million were in India (Bongaarts & Guilmoto, Reference Bongaarts and Guilmoto2015). This number is driven by two factors: (1) excess mortality of girls before birth and (2) excess female mortality compared with males post-birth (Ram et al., Reference Ram, Jha, Kumar, Awasthi, Shet and Pader2013). Imbalanced sex ratios at birth in India are primarily due to sex-selective abortions (Arnold et al., Reference Arnold, Kishore and Roy2002; Oomman & Ganatra, Reference Oomman and Ganatra2002), while differentials in mortality are due to a multitude of factors, including gender-based differences in feeding practices, health-care-seeking behaviour and immunization rates (Arnold et al., Reference Arnold, Choe and Roy1998; Mishra et al., Reference Mishra, Roy and Retherford2004). In populations without gender preference, the sex ratio at birth slightly favours males, but it is much more extreme in India, reaching 914 girls/1000 boys in 2011 (Registrar General of India, 2011). Also, in populations without gender preference, male infants have higher rates of mortality than female infants, so one would expect female children to have better mortality rates than male children, rather than the reverse, as is found in India (Wells, Reference Wells2000).
Despite the overall trend in increasingly imbalanced child sex ratios in India, recent work at a district level between 2001 and 2011 found that while the ratio became more uneven in most districts, in almost 25% of districts it became less uneven (Diamond-Smith & Bishai, Reference Diamond-Smith and Bishai2015). Districts are referred to as ‘improving’ if their sex ratios become closer to parity (1 girl: 1 boy). Although there is some variation in the sex ratio at birth and sex ratio at other ages, in a ‘natural’ population, it is assumed that the sex ratio would be roughly 1. Amartya Sen coined the term ‘missing girls’ to refer to the number of girls expected in the population if there were roughly the same number of boys as girls (Sen, Reference Sen1992). This new finding in this subset of districts requires more exploration. To understand the causes of ‘missing women’, why this is becoming less extreme in these specific districts areas, and to inform how to direct interventions, it is essential to estimate what proportion comes from sex-selective abortion (measured by the sex ratio at birth) and what proportion comes from excess female mortality, and how these contributions are changing over time. Past research has decomposed (using various techniques) the contributions to the uneven sex ratio in India overall (Jayaraj, Reference Jayaraj2009; Anderson & Ray, Reference Anderson and Ray2012). However, a focus on the newly identified districts that have shown improvement in child sex ratios will shed new light on these dynamic trends.
The sex ratio at birth is challenging to collect data on, leading to the use of estimation methods. While birth registry data are the gold standard for calculating this, collecting such data in developing countries like India is notoriously difficult, since not all births occur in health facilities and record-keeping in health facilities is often poor. Where birth registry data are limited or unreliable the sex ratio at birth is most often calculated from survey data (including the United Nations estimates) (Anderson & Ray, Reference Anderson and Ray2012; Bongaarts & Guilmoto, Reference Bongaarts and Guilmoto2015). In some instances, the child sex ratio (ratio of boys/girls under 6 years old) is often the best available source of data on differentials in the youngest age groups (Guilmoto, Reference Guilmoto2009). However, survey data are prone to biases since women under-report newborn and infant mortality, and therefore techniques estimating sex ratios from other data sources can prove useful. Previous estimation methods have included extrapolation from trends in total fertility (Guilmoto, Reference Guilmoto2009). Given the limitations in the current data on sex ratios, it has also proven difficult for researchers to look at trends over time, especially at smaller geographic levels or within subgroups. Understanding micro-trends is important as it can highlight populations that have more or less sex preference or might be changing for the better or worse, to identify where to target interventions.
Given the limitations in the data and the need for subgroup analysis, new estimation techniques are needed. This study developed a method that decomposed the child sex ratio collected by census data into ‘mortality’ and ‘sex-selective abortion’ related components using data on mortality by sex and age from life tables calculated from annual population statistics. Then, this new method was applied to the districts that showed signs of improvement in their child sex ratio between 2001 and 2011. As a final test of this method, it was applied to compare changes in these two components of the child sex ratio at district level in rural and urban populations.
Methods
Data
This analysis relied on data from two primary data bases: (1) the number of children aged 0 to 6 and estimates of child mortality at a district level from the population counts of the Indian Censuses of 2001 and 2011 (Office of the Registrar General, 2011, 2013; Registrar General of India, 2001); and (2) life tables produced by the Sample Registration System for 1996–2000 and 2006–2010 (Office of the Registrar General, 2013). The Annual Health Survey of India 2010 was used for some missing data, as discussed in more detail below. This analysis focused on the 153 districts (out of the 640 in India in 2011) whose child sex ratio improved between 2001 and 2011 (Diamond-Smith & Bishai, Reference Diamond-Smith and Bishai2015). A detailed discussion of the census data used for these calculations can be found in Diamond-Smith and Bishai (Reference Diamond-Smith and Bishai2015). The child sex ratio was defined as the number of girls divided by the number of boys aged 0 to completed age 6. The literature on sex ratios conventionally uses a ratio of the number of boys over the number of girls. However, the standard in India uses the reverse (the ratio of number of girls over the number of boys). This paper used the same standard as is customarily used for India (girls/boys).
Decomposition methods
Child sex ratio
Let the population at ages 0–6 years (that is, those who were aged up to 7 years exact) at time t and who were of sex s (f=female; m=male) be denoted as P 0–6,t,s, and the child sex ratio (CSR) of girls over boys from ages 0 to completed age 6 at time t be denoted as ![]() $CSR_t = P_{0 - 6,t,f} /P_{0 - 6,t,m} $. The child sex ratio was decomposed into:
$CSR_t = P_{0 - 6,t,f} /P_{0 - 6,t,m} $. The child sex ratio was decomposed into:
the sex ratio at birth (SRB) in the last 7 years,
 ${\rm{SRB}}_{\hat t\limits^ } = B_{\hat t\limits,{\rm{f}}} /B_{\hat t\limits ,{\rm{m}}} $, where
  $B_{\hat t\limits ,s} $ corresponds to the births for sex s in years t−6 to t, with
  $\hat t $ denoting this timespan;
the child mortality sex ratio (CMSR) between years t−6 and t, or
 ${\rm{CMSR}}_{\hat t\limits^ } $, or ratio of girls that died from birth to completed age 6 to the boys that died from birth to completed age 6.
The main equation was:
This procedure was used to estimate the sex ratio at birth in 2001 and 2011.
Estimating the child mortality sex ratio
The child mortality sex ratio was based on survival ratios for girls and boys for the years t−6 to t, or ![]() ${\rm{SR}}_{\hat t\limits ,{\rm{s}}} $, calculated in the standard way (Preston et al., Reference Preston, Heuveline and Guillot2001) from life table measures; e.g. for females the survival ratio
${\rm{SR}}_{\hat t\limits ,{\rm{s}}} $, calculated in the standard way (Preston et al., Reference Preston, Heuveline and Guillot2001) from life table measures; e.g. for females the survival ratio ![]() $({\rm{SR}}_{\hat t\limits ,{\rm{f}}} )$ was calculated from the number of person-years until completed age
$({\rm{SR}}_{\hat t\limits ,{\rm{f}}} )$ was calculated from the number of person-years until completed age ![]() $6,{{\vskip-4.5pt\scale50%\hskip-3pt}}{_6}{L_{0,f}$, divided by the radix of the population,
$6,{{\vskip-4.5pt\scale50%\hskip-3pt}}{_6}{L_{0,f}$, divided by the radix of the population, ![]() $\ell_{\rm 0,f}$:
$\ell_{\rm 0,f}$:
Calculations of survival ratios were done separately for females and males, and the child mortality sex ratio in equation (1) was calculated as the female survival ratio divided by the male survival ratio for the years t−6 and t.
Estimating birth counts
The number of births in each time period was estimated by multiplying the inverse of the survival ratio by the population aged 0 to completed age 6.
Calculations of births were done separately for females and males, and the sex ratio at birth in equation (1) was calculated as the females divided by the males between times t−6 and t.
State- and district-level mortality data
District-level mortality was only available for the age group below age five. District-level child mortality (4q 1) estimates by sex from the 2001 census were published by the Registrar General (Registrar General of India, 2008). Therefore, to estimate the district-level l 0 (the radix of the population) and 5L 0, the method used by Kumar and Sathyanarayana (Reference Kumar and Sathyanarayana2012) was employed, where the ratio of child mortality at a district level to the state-level child mortality was applied to the state-level life table functions. The probability of survival to age 5 for each sex (e.g. for girls: 5q 0f,D) at the district level was divided by the probability of survival for each sex to age 5 at the state level. The ratio of district to state (θ f,D) was calculated for each district as:
where D=district and S=state, and this ratio was used to calculate the district-level survival ratio (for females) as:
This equation was calculated separately for males and females for each district that had showed evidence of improvement in the child sex ratio. From these calculations, the survival ratio for the age group 0–5 for males and females was calculated. Here it was assumed that there was no difference in survival ratio between age group 0–5 and 0–6. Once the survival ratio was calculated (using equation (2)), it was possible to calculate the number of births for each district and sex as shown in equation (3). This led to some potential for errors when comparing these two age groups. Substantial evidence exists for age-heaping on age 5 in the Indian Censuses and National Family Health Surveys (Bhat et al., Reference Bhat, Preston and Dyson1984; Retherford & Mishra, Reference Retherford and Mishra2001). Generally, it is accepted that using the 0–6 age group is better than the 0–4 age group because it helps account for age-heaping (Guilmoto & Rajan, Reference Guilmoto and Rajan2002). This is part of the reason that the 2011 child population data are given in 0–6, as opposed to 0–4, in 2001 (P. M. Kulkarni, unpublished observation). However, as long as people do not differentially age-heap boys compared with girls, this should not bias these results since the methods rely on comparing ratios. Data on age structure were not published for all districts in 2011, so some districts had to be dropped from the analysis. Next, trends in the number of missing girls per boys from each component over time (2001 compared with 2011) were explored to understand if the improvement was due to changes in child mortality or sex ratio at birth.
Decomposing the changes in child sex ratio
To calculate the changes in the child sex ratio due to abortion captured in the sex ratio at birth, or SRB, and due to mortality up to completed age 6, or CMSR, from 2001 to 2011, Kitagawa’s decomposition technique was applied to equation (1) (Kitagawa, Reference Kitagawa1955). Let the difference in CSR from 2001 to 2011, be denoted as:
Following Kitagawa’s decomposition this difference can be separated into:
where the two components on the right correspond to changes in the sex ratio at birth (ΔSRB) and changes in mortality up to completed age 6 (ΔCMSR) between 2001 and 2011. The two terms to the right were calculated as:
and
As before, ![]() $\hat t $ corresponds to the events in years t−6 to t.
$\hat t $ corresponds to the events in years t−6 to t.
The 2001 Indian Census published data on the child population aged 0–6 by sex, urban and rural areas and by district (Registrar General of India, 2001). Thus far, the 2011 census has published data on the child population aged 0–6 in rural and urban areas by district, except for the following states: Andaman and Nicobar, Chhattisgarh and Pondicherry. Steps were therefore taken out of the analysis (Registrar General of India, 2011). District-level child sex ratios were calculated for rural and urban populations. The change in child sex ratios between urban and rural areas over time was calculated, to see if the improvement found is only occurring in urban or rural areas, or in both. Then the decomposed child sex ratio was explored in rural and urban subgroups, using the methods described above.
Results
For 21 of the 153 districts, the child sex ratio constructed from the available data did not show signs of improvement between 2001 and 2011. Of these, the majority were within 5 points of each other, so these were kept in the analysis, but data were dropped for eleven districts where the 2001 child sex ratio was more than 5 points greater than the 2011 child sex ratio. Some of these were districts where borders had changed over time, so larger district data from 2001 were applied to smaller districts in 2011 and thus the differences were probably due to this estimation and not reflective of actual trends.
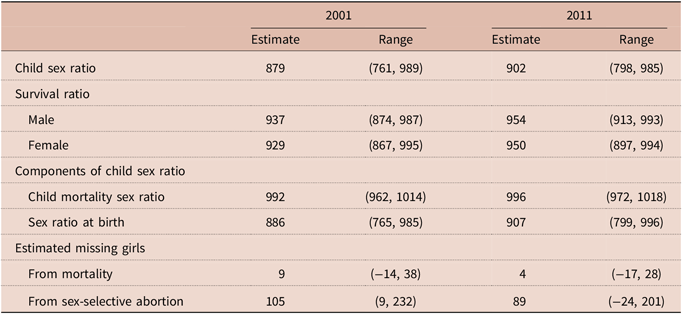
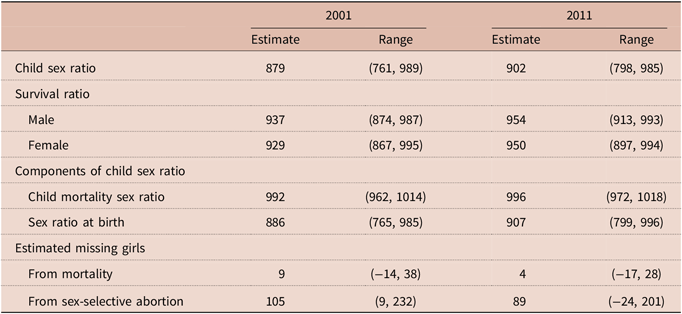
The mean district-level survival ratios increased between 2001 and 2011 for both males and females (Table 1). This is a reflection of improvements in infant and child mortality over the 10-year period. Although the survival ratios of both boys and girls improved over time, girls lagged behind boys in both periods.
Table 1. Mean district-level child sex ratio, survival ratio and component of imbalance from mortality and from sex-selective abortion in 2001 and 2011, in Indian districts that showed improvement
Source: authors’ calculations
Range of values for the districts included in parentheses. Survival ratios calculated as in equation (2). Components of the child sex ratio calculated as in equation (1). Missing girls calculated by subtracting the child mortality sex ratio and sex-selective abortion components from 1000 for each district separately and then summing. Due to rounding this results in slightly different estimate than if done for all of the states combined.
A mean of 114 girls were missing for every 1000 boys in 2001, and this fell to 93 in 2011 (Table 1). Of these, nine of the missing girls in 2001 were from excess girl mortality, and 105 from sex-selective abortion. In 2011, four of the missing girls were from excess girl mortality and 89 from sex-selective abortion. The component of the child sex ratio from child mortality was smaller than the component from abortion in both time periods, and it became slightly smaller over time.
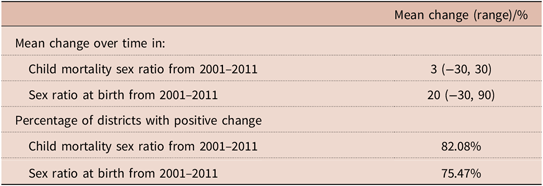
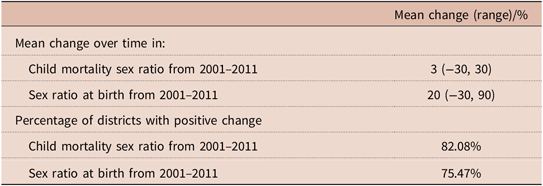
The mean change between 2001 and 2011 in the contribution to the imbalanced sex ratio from the sex ratio at birth was 20 (ranging from −20 to 20), and the contribution from differentials in child mortality was 3 (ranging from −30 to 30) (Table 2). This means that a greater amount of the change in child sex ratio was due to changes in the sex ratio at birth. Eighty-two per cent of districts showed positive change in their child mortality sex ratio, and 75.5% showed a positive change in their sex ratio at birth over time.
Table 2. Decomposition of the change over time of the components of the imbalanced child sex ratio, in the districts that showed improvement
There were seventeen districts that showed negative change in child sex ratios in both rural and urban areas. A closer examination of these districts showed that they were districts that had split into two districts over the time period, with the values in 2001 refer to a larger population than the data in 2011, so the comparison over time is not accurate. These seventeen districts were therefore dropped from the analysis. Furthermore, there were seven districts that were either completely rural or completely urban, or missing all data, and these were dropped from the analysis.
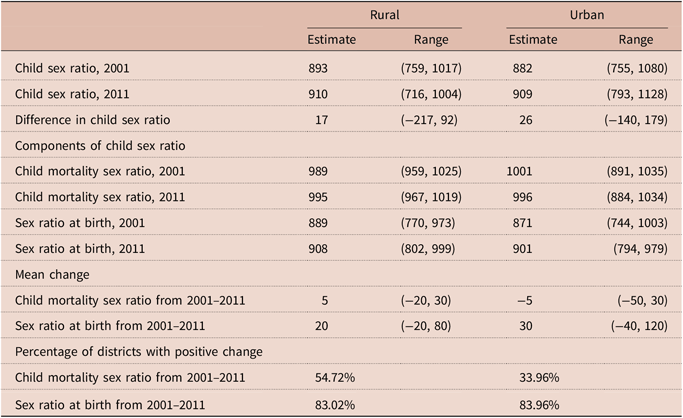
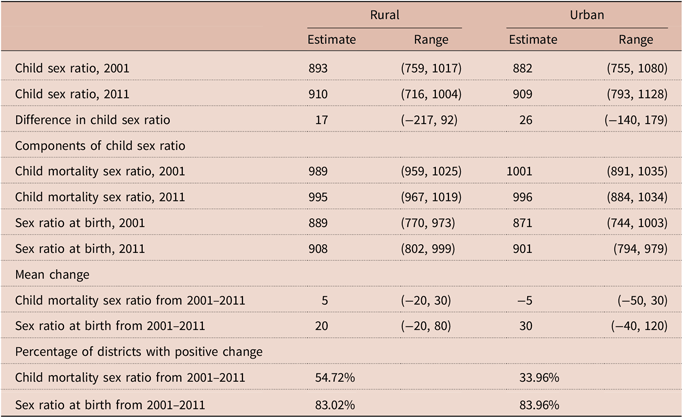
In the 123 remaining districts, urban areas improved by a larger magnitude than rural areas (Table 3). The average change in the child sex ratio in urban areas was 26.3 and 17.26 in rural areas. Eighty-one (66%) of the districts showed improvement in both rural and urban areas. Seventeen (13%) showed improvement only in rural areas, and 25 (20%) in only urban areas.
Table 3. Mean district-level child sex ratio, components of imbalance from mortality and from sex-selective abortion in 2001 and 2011, and decomposition of the change over time in the Indian districts that showed improvement by rural and urban status, 2001 and 2011
Source: authors’ calculations
Range of values for the districts included in parentheses. Components of child sex ratio calculated as in equation (1). Missing girls calculated by subtracting child mortality sex ratio and sex-selective abortion components from 1000 for each district separately and then summing. Due to rounding this results in slightly different estimate than if done for all of the states combined.
The child mortality component of the child sex ratio was 989 in rural areas in 2001, and 1001 in urban areas (Table 3). It rose to 995 in rural areas in 2011, but fell to 996 in urban areas. The sex ratio at birth component was 889 in rural areas and 871 in urban areas in 2001. It increased in both areas to 908 in rural areas and 901 in urban areas. The mean changes in the sex ratio at birth were not that different between rural and urban areas (20 and 30 respectively). However, there was a difference in the mean change in child mortality sex ratio over time between rural and urban areas. In rural areas, the change was positive (5), but it was negative in urban areas (−5). While about 83% of districts in both rural and urban areas showed signs of positive change in their sex ratio at birth, only 54.72% of rural areas showed signs of positive change in their child mortality sex ratio, and only about 34% of urban areas.
Discussion
This paper proposes a new estimation method that allows researchers to calculate the sex ratio at birth from data on the child sex ratio and age- and sex-specific mortality data. From this, the two components of an uneven child sex ratio (sex ratio at birth and excess girl child mortality compared with boys) can be separated and explored independently. Looking at the trends in these two components over time can help better understand the drivers of changes.
The application of these methods in the present study showed that most of the imbalance in the child sex ratio in India in 2001 and 2011 was from sex-selective abortion, as opposed to differential child mortality, and that the contribution from each became smaller over time, as was expected since only districts that had shown improvement were included. The majority of the change in the child sex ratio over time was from less sex-selective abortion, which was about an order of magnitude larger than the change in the child mortality sex ratio. Additionally, a greater percentage of districts showed positive improvement in their child mortality sex ratio than in their sex ratio at birth (82% compared with 75%, respectively). This suggests that most of the cause of the improvement in the child sex ratio in India is due to less sex-selective abortion, rather than from less disparity between the mortality of girls compared with boys. However, most districts have seen improvements in both.
The child mortality component increased in rural areas but it decreased in urban areas, suggesting that the situation for girls compared with boys in urban areas worsened over time. The sex ratio at birth component improved in both rural and urban areas over time. Of the districts that only showed improvement in either urban or rural areas, more showed improvement in urban areas, suggesting that the trend may be originating in these areas first. Other related trends in India (such as fertility decline and imbalanced child sex ratios) have originated in urban areas, so it was hypothesized that the same trend would occur with improvement in child sex ratios (Das Gupta & Bhat, Reference Das Gupta and Bhat1997; Bhat & Zavier, Reference Bhat and Zavier2007). Many of the districts that showed improvement were in more developed states, and closer to major metropolitan centres such as Delhi. These results support past findings that fertility and sex preference trends often originate in urban settings or near urban centres, but the improvement in child sex ratios has not been limited to urban areas.
It is worrisome to see evidence that the situation for girl children compared with boy children has become worse over time in urban areas, and is contributing more to the skewed child sex ratios in 2011 compared with 2001. This could be reflective of past findings that the child mortality rate has slowed, or ever stagnated, in India in recent years (Saikia et al., Reference Saikia, Jasilionis, Ram and Shkolnikov2009, Reference Saikia, Singh and Ram2010). These findings highlight that the decline in child mortality for girls lags behind that for boys, as has been noted elsewhere (Ram et al., Reference Ram, Jha, Kumar, Awasthi, Shet and Pader2013). Hill and Upchurch (Reference Hill and Upchurch1995), using Demographic and Health Survey data from around the world to look at gender differences in child mortality, found that when male child mortality declines, the female advantage in under-5 mortality also declines. Therefore, in the absence of gender preference and uneven care-giving practices, with development, it would appear that girls fare worse. Future research should focus on the reasons why improvements in mortality for girls under age five lag behind improvements in mortality for boys.
Sex-selective abortion has been illegal in India for almost 20 years, and there are many efforts to reduce access to sex-determination techniques (although it is important not to restrict access to abortion itself, which has been legal in India since the 1970s). Additionally, there have been a plethora of efforts in India aimed at reducing the preference for sons or increasing the preference daughters – from education/media campaigns to programmes that offer incentives for families to have daughters (Sekher, Reference Sekher2010, Reference Sekher2012). Assuming that most of the imbalance at birth is due to abortion, the finding that the magnitude of sex-selective abortion has gone down provides evidence that either families are not seeking sex-selective abortions, or they are less able to determine the sex of their fetuses, even if they wanted to. Changing preferences would indicate a possibility of more improvement in the future in a potentially larger geographic area, as social trends and preferences often spread. However, even if the change is due to better restrictions on sex-selective abortions (and not on changing preferences), this is still an improvement on previous decades of poor success in restricting sex-selective technology. Future research should aim at understanding whether changing preferences for, or reduced access to, sex-selective abortions are responsible for the improvement in the sex ratio at birth, and explore regional differences.
The study has its limitations. District-level life tables were not calculated, so person-years lived up to various ages at a district-level were estimated by applying ratios of child mortality at a district level compared with the state level, as has been done in past studies (Kumar & Sathyanarayana, Reference Kumar and Sathyanarayana2012). Additionally, district-level child mortality estimates were not available for the 2011 census, so the Annual Health Survey (AHS) estimates from 2010 for the states from which these data were available were used. However, the AHS is not collected in all states, so in those without AHS data, 2001 child mortality ratios were applied to 2011. Kumar and Sathyanarayana (Reference Kumar and Sathyanarayana2012) stated that ‘at moderate levels of mortality, birth rate estimates from the reverse survival procedure are not that sensitive to errors in child mortality estimates’ (p. 68). They also cited work by Bhat (Reference Bhat and Srinivasan1996), which showed that in India a 10% error in child mortality estimates only resulted in a 2% error in the estimates of crude birth rate, suggesting that even if there were small errors introduced by applying child mortality ratios from 2001 to 2011, this should not have affected subsequent estimates too much. Additionally, there was no life table information for smaller states, namely: Andaman and Nicobar, Arunachal Pradesh, Chandigarh, Delhi, Chhattisgarh, Jharkhand, Manipur, Meghalaya, Mizoram, Nagaland, Pondicherry, Tripura and Uttarakhand. Therefore, these had to be dropped from the decomposition analysis.
In conclusion, the methods proposed in this paper allow for the exploration of child sex ratios by component (sex ratio at birth and child mortality differentials) when data are limited on sex ratios at birth. Future researchers can apply these estimation methods to other countries, subgroups and time periods. The study used these methods to explore the composition of the new phenomenon of improvement in the child sex ratio in selected districts of India. Child sex ratios in India as a whole continue to worsen, and this analysis does not suggest that there is no longer a need to be concerned about the situation for girls in India. However, by examining the causes of improvement in the districts that have begun to show signs of positive change, it may be possible to encourage more reversals of the child sex ratio in the future. Sex-selective abortion is still the major cause of missing girls, so efforts to restrict access to sex-selective technology are still essential, as are efforts to improve people’s view of the value of girls throughout their life course, thereby reducing the desire for sex-selective abortions and perhaps encouraging more equality in care-taking by sex. While it is not yet known if the improvement seen will be sustained over time, these findings have helped understand this new phenomenon, which has today been little explored at a district level or by rural/urban populations in India.
Funding
This research received no specific grant from any funding agency, commercial entity or not-for-profit organization.
Conflicts of Interest
The authors have no conflicts of interest to declare.
Ethical Approval
The authors assert that all procedures contributing to this work comply with the ethical standards of the relevant national and institutional committees on human experimentation and with the Helsinki Declaration of 1975, as revised in 2008.


