


Introduction
In 1945 Kingsley Davis called attention to the double revolutions, industrial and demographic, that were revolutionizing women’s childbearing experience. They represented:
… an astounding gain in human efficiency. Under the old regime of high fertility and high mortality, women frequently experienced the drain and danger of pregnancy to no purpose, because a large proportion of the offspring died. Furthermore, energy was spent on the surviving offspring, only to find that many of them died before or during early maturity. Thus too much effort was spent in trying to bring each new generation to full productive maturity. Too much energy was lost in sickness, malnutrition, and preoccupation with death. The new type of demographic balance released a great amount of energy from the eternal chain of reproduction – energy that should be spent on other aspects of life. (Davis, Reference Davis1945)
This paper suggests a new measure of the ‘efficiency’ of which Davis spoke. By following a fresh cohort of conceptions through pregnancy wastage, and on through mortality to age 15, the extent of total loss and the step-wise pattern by which it occurs can be explored. It moves through miscarriages, abortions and stillbirths, then infant and child mortality and subsequent mortality to age 15. The paper also tests the expectation that the new measure of reproductive efficiency will show that increases in efficiency tend to hasten the shift from natural to controlled fertility behaviour.
Methods
The study data pertain to the seven regions that encompass the developing world (UN Population Division, 2017), omitting Oceania due to the small data base for abortions. The UN Population Division was the source for the numbers of births; life tables for ages 1, 5, 10 and 15; the general fertility rate; and contraceptive prevalence (all methods and modern methods). Estimates of pregnancy losses have been assembled in the Adding It Up analyses (Darroch, Reference Darroch2017); these start from the UN estimates of numbers of births, and use empirically based rules to estimate miscarriages, abortions and stillbirths from the births, with the sum giving the total number of conceptions. Regional estimates for the ratios of abortions to births were employed to estimate abortions, then the sum of miscarriages and stillbirths was estimated at 20% of births plus 10% of abortions. All data and estimates were subject to a variety of errors so only broad patterns were examined; however, these showed marked differences, as detailed below.
The measure presented here, for ‘reproductive efficiency’ (RE), is simply the proportion of conceptions that survive to produce a living child at age 15. This encompasses losses from the various pregnancy events and from mortality to age 15. The losses were separated by type and region. Table 4 lists the 129 countries by region; note that some regional results are especially dominated by a few countries, e.g. China and India for Asia, Nigeria for sub-Saharan Africa, and Mexico and Brazil for Latin America.
A correlation and regression analysis was carried out to assess the relationships between the abortion rate (number of abortions per 100 conceptions), reproductive efficiency, contraceptive use of modern methods (Modern Contraceptive Prevalence Rate, MCPR) and contraceptive use of any method (Contraceptive Prevalence Rate, CPR).
Results
The reproductive efficiency (RE) values shown in Fig. 1 and Table 1 reflect a mix of influences, since very low values of RE can be due to high abortion rates and/or high mortality rates. In fact, regions with many abortions usually have the lower mortality rates, and the higher values of RE are found in regions with low abortion rates.

Figure 1. Reproductive efficiency (RE) from conception to age 15, by region for 129 countries. Sources: estimates of pregnancy events are for 2017 and come from the 2017 edition of Adding It Up (Darroch, Reference Darroch2017). Life tables for survival to each age are from the UN Population Division, World Population Prospects, 2017 Revision.
Table 1. Reproductive efficiency (RE): losses by cause and region
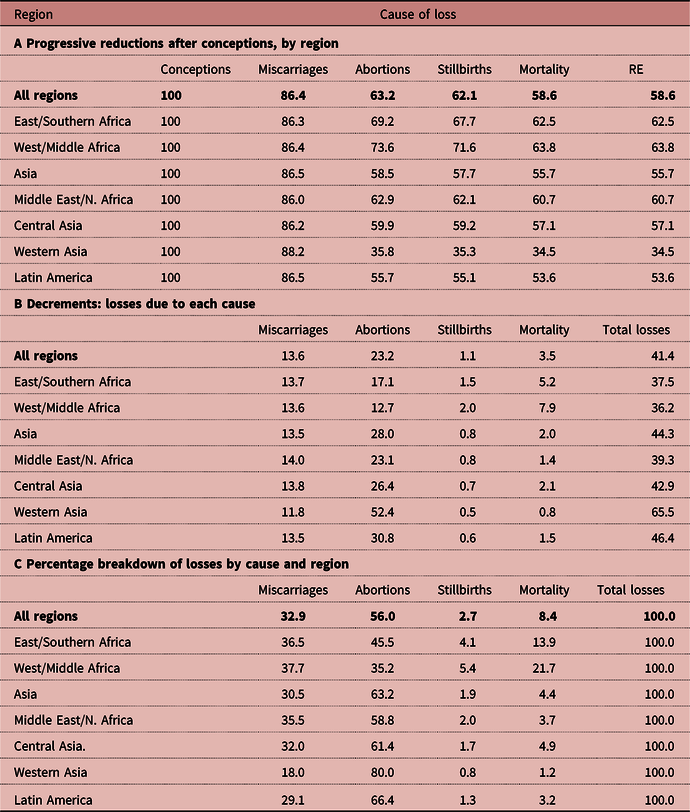
Estimates of pregnancy events are for 2017 and come from the 2017 edition of Adding It Up (see Darroch, Reference Darroch2017). Life tables for survival to each age are from the UN Population Division, World Population Prospects, 2017 Revision.
Stepwise losses from conception to age 15
Most wastage occurs during pregnancy, from abortions mainly, as well as from miscarriages and a small amount from stillbirths. Additional wastage comes from deaths, and most of that is due to infant mortality. When all types of wastage are subtracted from a starting cohort of conceptions, the result is conceptualized here as Davis’s ‘reproductive efficiency’ (RE).
The stepwise patterns by region are illustrated in Fig. 1, in which the final points are the RE values for each region. The two sub-Saharan African regions do best since their losses from abortion are small enough to more than balance their greater losses from mortality. The other regions are clustered at 55% to 60% of conceptions surviving after allowing for abortions (third point on the x-axis of Fig. 1). The lines are then relatively flat for stillbirth and mortality losses. The exception is the very high abortion rate in Western Asia, composed of the former USSR republics of Armenia, Azerbaijan and Georgia.
Series of losses following conception
The series of losses following conception are shown in Table 1 by component and region. The top panel of Table 1 (panel A) gives the percentage still continuing after each loss, continuing to the final column to show the RE values themselves. (These are identical to the percentages surviving through the mortality losses to age 15.) The next panel in Table 1 (panel B) shows the decrements due to each loss, and the third panel (panel C) shows the percentage breakdown of losses. Overall, 58.6% of conceptions survive to a living child at age 15. In panel B there is about a 14% drop-off due to miscarriages, then a large drop-off of 23% for abortions, then the very small loss of 1% from stillbirths, and finally the loss of 4% due to mortality.
The proportionate breakdown of all losses, adding to 100%, is in panel C of Table 1. The largest share, with over half of all losses, is due to abortions (56%). Miscarriages account for another third (33%). Stillbirths are a minor factor at 3%, but mortality is significant at 8%.
The within-mortality losses (not shown) break down as follows: 2% is from infant mortality, with another 0.81% from age 1 to 5. After that only an additional 0.38% is to age 10, and 0.27% to age 15. Summing from birth to age 15 these amount to 3.5% of all conceptions (Table 1B, next to last column).
Regional differences are quite marked. The two sub-Saharan Africa regions stand out: they have the highest overall RE ratings at 63% and 64% (Table 1A, next to last column), but they lose the most points for mortality at 5% and 8% (Table 1B). Then, for the shares of all losses due to mortality in Table 1C, they show the greatest losses. That is partly due to the relatively small role played by abortion in sub-Saharan Africa. Note the remarkable difference within sub-Saharan Africa, with the West/Middle region suffering from more mortality than the East/Southern region, at 22% vs 14%. All other regions are below 5% of total losses due to mortality (Table 1C).
Total numbers of losses
The total numbers of losses during pregnancy and from mortality appear by region in Table 2. Not surprisingly, losses are higher where regions are larger, as in Asia, with five of the most populous developing countries. Rates also matter, and Asia has one of the highest rates of loss (Table 1A). Any global reduction in total losses would largely follow the Asian rates, primarily through fewer abortions. A smaller contribution would flow from continued mortality declines.
Table 2. Numbers of losses (in thousands) by cause from conception to age 15, by type of loss and region

The grand total is about 86 million losses suffered between conception and a living child aged 15 (Table 2, next to last column.) Most of these losses are attributable to Asia and Africa. The losses shown come from a single annual cohort of conceptions. Over the next 15 years, a new cohort starts every year, with losses that overlap those coming from the first cohort. Each calendar year sees additional losses flowing from conceptions in the previous years.
Response of contraceptive use to the RE
The response of contraceptive use to the RE can be examined to test whether an increase in reproductive efficiency itself can encourage the use of contraception. Over the longer term, as reproductive efficiency improves and couples gain confidence that many pregnancies and births are not necessary to achieve their desired family size, more would turn to contraception as a means to achieve their objectives. That relationship is tested in Table 3. This shows the results of a regression analysis to predict contraceptive use as the dependent variable, by the two indicators CPR (all use, including traditional methods) and MCPR (modern method use). The results for both indicators are quite similar.
Table 3. Regression analysis for the effects of reproductive efficiency (RE) on CPR and MCPR

r: correlation coefficient.
b: regression coefficient.
**p≤0.01 or less.
Table 4. Regional list of countries

Contrary to expectation, the simple bivariate correlation (‘r’) between RE and MCPR is negatively associated (r=–0.345; p<0.01). This unexpected relationship is caused by the role of abortions, which drive the values of both RE and MCPR. An increase in abortions is associated with an increase in MCPR (r=0.495; p<0.01), but with a decrease in RE (r=–0.961; p<0.001; not shown). However, once the independent effects of abortion and the RE upon the MCPR are controlled for, a clear picture emerges, showing contraceptive use to increase with rising RE levels: regression coefficients of 4.46 for the MCPR and 4.75 for the CPR, after controlling for the effect of abortions.
Conceptually, the direction of effects is that conceptions are followed by abortions, which are followed by reproductive efficiency, which in turn affects the use of contraception positively. In practice, both contraception and abortion are part of a change from natural to controlled fertility behaviour. As the value of RE increases women may increasingly use abortion or contraception, or both, to control their fertility.
Discussion
Several questions arise in the context of the study findings. First, are abortions declining as a cause of pregnancy losses? Sedgh et al. (Reference Sedgh, Bearak, Singh, Bankole, Popinchalk and Ganatra2016) estimated that globally, abortions as a percentage of pregnancies were nearly steady, at about 24%, over the five-year periods running from 1990–94 to 2010–2014. However, around that average, developed countries experienced a decline from 39% to 28% – a one-quarter change. Developing countries, on the other hand, showed a small upward trend, from 21% to 24%. All estimates were subject to rather broad confidence intervals, but it appears that in the developed countries, with their especially high abortion rates, continuing declines can appreciably reduce reproductive wastage. There are particular country cases of interest; for example, Georgia’s national surveys for 2000, 2005 and 2010 showed a remarkable shift away from abortion, towards contraceptive use. The Total Abortion Rate fell from 3.7 to 1.6 while contraceptive prevalence rose from 41% to 53%; the net effect was a small increase in the very low fertility rate (Serbanescu et al., Reference Serbanescu, Egnatashvili, Ruiz, Suchdev and Goodwin2011).
Second, have improvements in mortality made important changes in the RE values? The remarkable public health improvements since the end of World War II have had long-term effects on infant mortality and under-five mortality rates. Over the period 1950–1955 to 2010–2015, infant mortality declined from 59 to 5 deaths per 1000 live births in more-developed regions and 161 to 38 deaths per 1000 live births in less-developed regions (UN Population Division, 2017). For the same period, under-five mortality declined from 77 to 6 deaths per 1000 live births in more-developed regions and from 248 to 53 deaths per 1000 live births in less-developed regions (UN Population Division, 2017). In developing countries there is no let-up in the pace of the decline; also, the gap is closing between infant and child mortality as infant mortality with its neonatal component is more resistant to change. These infant and child mortality declines work directly towards higher RE values, as do the smaller declines between age 5 and age 15. Table 1C gives the overall share of mortality in the context of all losses.
Third, have the absolute numbers of child deaths declined? That is, have the advances in mortality reduction more than offset the increases in births? The UN Population Division (2017) estimated that since 1990 the under-five mortality rate fell by 58%, and that under-five deaths fell from 12.6 million to 5.5 million in 2017. Most of this was from advances in developing countries, due both to their sheer sizes and to the greater relative declines in the rates.
Fourth, how do abortion rates respond to increases in contraceptive use? Globally, abortions are the primary cause of reproductive losses; they bear an interesting relationship to contraceptive use, and policy formulations need to take account of the different ways in which contraception and abortion can relate to each other over time. While contraception only affects the pregnancy rate, it can also affect the abortion rate indirectly if it averts pregnancies by women who would otherwise be especially prone to aborting them. Apart from that, however, it is a question of behaviour: in practice, does the abortion rate decline as contraceptive use increases? That can depend upon which indicator of ‘abortion rates’ is examined: total numbers, lifetime abortions per woman (Total Abortion Rate, TAR), abortions as a percentage of pregnancies or of unintended pregnancies, or abortions per woman per year. Without attempting a full discussion of the possibilities, two sets of data are discussed, each suggestive in a different way.
More use of modern contraceptive methods can clearly be accompanied by lower TARs. Westoff (Reference Westoff2008) showed that in countries where few women use a modern method, many use abortion. The reverse occurs where modern contraceptive use is common. The resulting negative correlation is a strong –0.95 across 59 observations from 44 countries. If this cross-sectional pattern holds within countries as they transition over time it represents a changing mix of the two ways to avoid unwanted births.
Next, Westoff (Reference Westoff2008) also showed that reliance on high-failure traditional methods has the reverse effect, leading to more abortions with more use (correlation 0.79). However, because most of the data are from the more developed countries, with rather low fertility rates, the patterns may not apply fully to developing countries.
Whether these cross-sectional results would occur over time, and whether they would occur in different sets of countries at different fertility levels, was examined by Marston and Cleland (Reference Marston and Cleland2003) in a review of thirteen countries. They found that in seven countries, abortion incidence declined as contraception use increased. In the other six, the two rose simultaneously during periods of fertility decline, but once fertility had stabilized some of these countries showed falling abortion incidence as contraception rose further. This second set contained more countries at relatively more advanced stages of development.
In summary, of every 100 women who become pregnant, over 40 fail to see the conception result in a living child at age 15. This reproductive wastage continues, due more to abortions than to child mortality, though regions differ considerably in their relative importance. Returning to the Davis observation regarding the heavy losses that women traditionally experienced during pregnancy and childrearing, great progress has occurred as conceptions and births per woman have fallen. The total numbers are another matter, since population growth has worked in the other direction. The UN estimated that the numbers of births in developing countries rose from 79 million annually in 1950–55 to 94 million in 1960–65, with a temporary peak of 124 million in 1985–1990 and finally reaching 127 million in 2015–2020 (UN Population Division 2017).
For infant and child mortality, both rates and numbers have seen dramatic declines. Pregnancy wastage over time has been less certain; it depends primarily upon the trend for abortions, first as a percentage of conceptions, and next in terms of numbers. For the developing world, Sedgh et al. (Reference Sedgh, Bearak, Singh, Bankole, Popinchalk and Ganatra2016) estimated 38.6 million abortions for 1990–94, growing by 11 million to 49.6 million for 2010–2014. That increase reflects population growth primarily since the overall rate decline was only from 39 to 37 abortions per 1000 women per year, though considerably more for East and South-eastern Asia. Continuing research may tell whether favourable declines have been underway since 2014.
Abortions lower the RE ratings through pregnancy wastage, while they nevertheless, in combination with contraception, have helped women come closer to their desired family sizes. Davis himself, as early as Reference Davis1963, famously noted the use of alternative paths to fertility reduction (Davis, Reference Davis1963). Efforts to shift the balance towards fewer unplanned pregnancies via contraception, and away from abortions, will help to reduce pregnancy wastage and raise overall reproductive efficiency, which in turn will increase contraceptive use.
Mortality remains an important loss in severely disadvantaged countries, especially in sub-Saharan Africa, but the abortion rates are lower there. This is reversed in the more advanced countries and regions, where mortality is low but abortion rates are higher. Total losses numerically depend upon the various rates in combination with numbers of conceptions.
Abortions drive RE and are correlated with contraceptive use. The relationship between RE and contraceptive use was initially observed to be negative, which turned out to be an artifact of the abortion correlation. An increase in RE is in fact associated with an increase in contraceptive use after controlling for the effect of abortions. That confirms the underlying tendency of better reproductive efficiency to change reproductive behaviour over the long term. It is also consistent with Davis’s observation above that ‘The new type of demographic balance released a great amount of energy from the eternal chain of reproduction – energy that should be spent on other aspects of life.’
Acknowledgments
The authors wish to thank Jacqueline Darroch for important suggestions and assistance with data sources and Tomas Frejka for helpful suggestions on the text.
Funding
This research received no specific grant from any funding agency, commercial entity or not-for-profit organization.
Conflicts of Interest
The authors have no conflicts of interest to declare.
Ethical Approval
The authors assert that all procedures contributing to this work comply with the ethical standards of the relevant national and institutional committees on human experimentation and with the Helsinki Declaration of 1975, as revised in 2008.


