Introduction
The sharp dip in fertility rates in recent years, combined with falling mortality rates over the last four decades, is leading to an increase in the absolute and relative size of the elderly population in developing countries (Rajan et al., Reference Rajan, Misra and Sarma1999). Population projections indicate an increasing greying of the world's population, with the share of persons aged 60 years and above predicted to increase from 9.5% in 1995 to 30.5% in 2150 (United Nations, 2005). The growth rate of the elderly population varies between countries, but is expected to be high in Afro-Asian countries. In India, for instance, the share of aged has increased from 6.5% (1981) to 7.4% (2001), and is expected to constitute about a quarter of the population by 2075. Although some researchers argue that the increase in the elderly population merely comprises a change in dependency structure, with resources freed from a reduction in the share of the young being sufficient to take care of the elderly (Ball & Bethell, Reference Ball and Bethell1998), the issue is more complex, particularly in developing countries, and goes beyond looking after the special needs of the elderly with respect to health care, housing and financial insecurity (Nyce & Schieber, Reference Nyce and Schieber2005). In these countries, as Palloni (Reference Palloni2005) points out, ageing of the population is occurring in economic, social and political contexts that are often fragile and precarious.
The last two decades have witnessed a significant transition in the Indian economy and in society that has crucial implications for elderly care. Changes like integration of the economy with global markets and liberalization have created new economic opportunities for the population at large. At the same time, growing economic inequality, urbanization, modernization, increasing individualism and consumerism, women's increasing participation in paid work and greater mobility of the population have led to the disintegration of traditional extended families and the rise of nuclear families in India. This has resulted in economic dependence during old age on the one hand, and reduced family support for the elderly on the other. Studies have demonstrated how reduced family support has resulted in the elderly having to live a marginal and precarious existence (Planning Commission, 2001; Visaria, Reference Visaria2001; Rajan & Kumar, Reference Rajan and Kumar2003).
At the same time, the Government of India has initiated a number of social welfare programmes and policies. For example, legislative activity at both the state and national levels for the very poor elderly occurred during the middle and late 1990s, accompanied by a growing advocacy for a national policy on ageing (Gokhale, Reference Gokhale2003). The National Social Assistance Programme (1995) made the first attempt to provide a social security network for the elderly through the provisioning of, inter alia, a pension scheme for the elderly destitute. The National Policy on Older Persons (1999) is another major step forward in this regard. Intervention areas include financial security, health care, shelter, welfare and other needs of elders; protection against abuse and exploitation; opportunities for developing the potential and participation of elders; and services to improve the quality of life of elders. The concept of healthy ageing enunciated in this policy was further reiterated in the National Population Policy of 2000. However, the institutional response – in the form of developing social health care and security mechanism, old age homes and other necessary steps – to the problem of ageing has not been effective and remains inadequate and more in the nature of lip service (Rajan et al., Reference Rajan, Misra and Sarma1999; Bose & Shankardass, Reference Bose and Shankardass2004).
Consequently, given problems like high levels of morbidity (World Bank, 1993; Rajan et al., Reference Rajan, Misra and Sarma1999; Alam, Reference Alam2006) and commensurately high health care expenses (Nyce & Schieber, Reference Nyce and Schieber2005), the well-being of the elderly may be threatened. In particular, the impact of economic independence and living arrangements on well-being and health status of the elderly is an area that has generated considerable interest among researchers. The effect of economic independence on quality of life of the aged was examined by Rajan & Kumar (Reference Rajan and Kumar2003), while the relationship between old age poverty, chronic ailments and lack of functional autonomy among elderly was studied by Alam & Mukherjee (Reference Alam and Mukherjee2005) and Albert et al. (Reference Albert, Alam and Nizamuddin2005). Rajan & Kumar (Reference Rajan and Kumar2003) have addressed the issue of living arrangement among Indian elderly and argued that restoring familial care of the elderly is much needed in the wake of modernization. Surveys conducted in other south-east Asian countries found that children continue to be an important source of support to the elderly (Chan, Reference Chan1997; Knodel & Debavalya, Reference Knodel and Chayovan1997; Natividad & Cruz, Reference Natividad and Cruz1997; Sobieszczyk et al., Reference Sobieszczyk, Knodel and Chayovan2002; Arifin, Reference Arifin2006). Recently – using the 60th round of National Sample Survey Organization (NSSO) 2004 data – Ghosh & Husain (Reference Ghosh and Husain2010) have examined the effect of economic independence and living arrangement on perceived health status among the elderly in India. In addition, other studies have focused on the prevalence of morbidity among the elderly, their socioeconomic correlates and the availability of health facilities (Kumar, Reference Kumar1996, Reference Kumar1999, Reference Lall and Seal2003; Rajan, Reference Rajan2006; Alam, Reference Alam2006), and on social security aspects (Kumar, Reference Kumar2003; Subrahmanya, Reference Subrahmanya2005).
Using disability and chronic ailment as a proxy for health status, Gupta & Sankar (Reference Gupta and Sankar2003) have found that economic conditions and living arrangements influence the reporting of physical vulnerability among the aged in India. In a recent study, Mini (Reference Mini2009) assessed the contribution of different factors to the overall health status (measured by combining self-perceived health status, physical mobility and presence of any disease) among the elderly population of Kerala and concluded that while women report less morbidity, perceived well-being and physical mobility were better for men. Alam (Reference Alam2008) found that caste, widowhood and public health measures were major determinants of health status among the rural elderly. However, these studies have focused on a single point of time, using either primary surveys or data from one of the National Sample Survey Organization (NSSO) 52nd and 60th rounds (relating to 1994–95 and 2004, respectively).
The present study pools data from these two surveys, allowing the impact of time to be introduced into the picture and the analysis of the change in perceived health status of the elderly in India over a decadal period. The paper attempts to examine the impact of economic independence and living arrangements on the perceived health status of the elderly in India after controlling for a number of other demographic and socioeconomic characteristics, and time. Moreover, the study argues the need to take into account differences between rural and urban sectors and between the sexes.
Methods
The NSSO has conducted two waves of surveys on morbidity and health care, which contain information on the health status of the elderly (aged 60 years and above): the 52nd round (July 1995 to June 1996) and the 60th round (January to July 2004). The sample was selected using a two-stage stratified design, with census villages and urban blocks as the first-stage units (FSUs) for rural and urban areas respectively, and households as the second-stage units (SSUs). A total of 194,810 households (120,942 in the 52nd round and 73,868 in the 60th round) were surveyed. These two datasets were merged taking variables that were common to both rounds, and data for the elderly extracted. Information pertaining to a total of 68,852 persons was extracted, of which 49.4% was from the 52nd round and the remaining from the 60th round. The final merged dataset contained information on self-reported health indicators, basic demographic features (age, gender, caste, marital status, educational level, household size, place of residence, state of residence), economic characteristics (like household expenditure, occupation, usual activity status) and information on living arrangements and economic independence.
The study uses perceived health status in order to assess the change in health condition at two points of time. The NSSO provides information on three indicators of health status: mobility (responses to the question ‘Whether physically immobile’ were categorized on a three-point scale – ‘confined to bed’, ‘confined to home’ and ‘not immobile’), perceived current health status (grouping responses to ‘What is your own perception about current state of health?’ using a three-point scale – ‘excellent/very good’, ‘good/fair’ and ‘poor’) and perceived improvement in state of health (NSSO also seeks information about whether there has been an improvement in health status relative to the past year; the responses are coded on a five-point scale). This paper uses perceived current health status as an indicator of health status.
Use of self-reported health status may be questioned, particularly as it is subjective (Gupta & Sankar, Reference Gupta and Sankar2003). Self-reporting may also be shaped by the social context in which the person is situated (Sen, Reference Sen1993). However, there is a large volume of literature suggesting that self-reported health is an acceptable indicator of general health with good construct validity (Smith, Reference Smith1994; Soldo & Hill, Reference Soldo and Hill1995; Wallace & Herzog, Reference Wallace and Herzog1995; Manton et al., Reference Manton, Stallard and Cordel1997), and a powerful predictor of mortality risks (Idler & Benyamini, Reference Idler and Benyamini1997), disability (Idler & Kasl, Reference Idler and Kasl1995) and morbidity (Schechter et al., Reference Schechter, Beatty, Willis, Schwarz, Park, Knauper and Sudman1998; Beckett et al., Reference Beckett, Weinstein, Goldman and Yu-Hsuan2000). A medical study in Bangladesh has found strong correspondence between self-reported health and actual physical measures of health (Rahman & Barsky, Reference Ball and Bethell2003).
The consistency of response has also been verified by comparing self-reported current health status with mobility of the respondent from the pooled dataset. It was observed that only 1.7% of immobile respondents report themselves to be in excellent health, while the majority (82.9%) feel that they are in poor health. Similarly, most of the physically mobile persons report themselves to be in either good health (75%) or excellent health (8%). This indicates that self-reported current health status is an acceptable indicator and can be used in the present analysis.
The response to state of current health status has been coded into three categories: poor, good/fair and excellent. Researchers like Gupta & Sankar (Reference Ball and Bethell2003) and Mini (Reference Mini2009) have converted this three-fold classification to a binary form and used a binary logit model. This results in loss of information on the health status of respondents. Since the response variable has more than two levels (polychotomous) and is ordered ordinally, Ghosh & Husain (Reference Ball and Bethell2010) suggested use of an ordered logit model.
The ordered logit model is a multi-equation model, with each equation resembling a logit model (Appendix). The equations are estimated for the binary options (1, 2 to J), (1 to 2, 3 to J), (1 to 3, 4 to J) … of the response variable. Therefore, the number of equations is always one less than the number of categories of the dependent variable. Typically, the logistic regression models assumes that the coefficients of each of the explanatory variable included in the model are constant across all the categories of the response variable; that is, the different equations are parallel, and only the intercept changes for each level of transition. This is known as the assumption of proportional odds. This assumption, however, is strong and should be tested (Brant, Reference Brant1990). If the assumption is violated, the researcher should consider shifting to a variable parameter model (Williams, Reference Williams2006). Here again, two possibilities should be considered (Long & Freese, Reference Ball and Bethell2006). One is to completely remove restrictions on parameters and allow all coefficients to vary. This results in a set of logistic equations. On the other hand, only some parameters (selected on the basis of the Brant test) may be allowed to vary, while others are held constant. The imposition of some restrictions results in the partial proportion odds model, as opposed to the (fully) variable parameters model without any restrictions. The justification and validity of the additional restrictions may be tested using the Likelihood Ratio test (Williams, Reference Williams2006) and the appropriate parsimonious model chosen. The computation of these tests is a methodological improvement over Ghosh & Husain's (Reference Ball and Bethell2010) work mentioned earlier using an ordered model.
The main explanatory variables of the models are economic independence, living arrangement and the two time periods (1995–96 and 2004). The variable ‘economic independence’ has been categorized as not-dependent on any other family members, partially dependent on other family members and fully dependent on other family members. Family support has been determined by the living arrangement (categorized as living with spouse, with spouse and others, with children but without spouse, and a residual category including living alone, in old age homes, with other relatives or with non-relatives). Control variables included in the models were gender, age, educational attainment, caste, activity status and per capita household expenditure. Expenditure levels in 1995–96 were converted to 2004 prices using wholesale price indices published by the Central Statistical Organization. Respondents were classified into four groups based on their usual activity status: engaged in economic activities (activities producing goods and services for the market, which are incorporated within the national income of the country), extended System of National Accounts (SNA) activities (production activities, like subsistence production, falling outside the market realm, which are not incorporated within the national income of the country), unemployed but seeking work, and a residual category (comprising of rentiers, pensioners, remittance recipients, disabled, beggars, prostitutes, etc.). Given regional differences in level of overall development, available health facilities, socio-cultural practices and family structures, regional dummies were also incorporated into the models. The total sample was divided into six cultural/geographical regions: Central (reference category), North, North-east, East, West and South. Another dummy indicating place of residence (rural and urban) was also incorporated. Marital status of the respondent was incorporated in the bivariate analysis but dropped in the multivariate models due its high correlation with ‘living arrangement’.
Results
Comparison of sample characteristics between rounds
An examination of the sample profile between the two rounds revealed some variations. It has been observed that while economically fully dependent elderly comprise the majority of respondents (52%), the proportion of economically independent persons is also quite high (33%) and has increased in 2004 (by 4 percentage points). In conformity with the family structure observed in Asian countries, the majority of the elderly (82%) reside with their children (with or without spouses); however, this proportion has declined over time (by 4 percentage points).
About half of both sub-samples are females. The proportion of ‘young-old’ (respondents aged between 60 and 69 years) constitutes about two-thirds of the respondents and increased by 4 percentage points between rounds. Currently married and widows/widowers comprise most of the sample.
In India, religious and social groups comprise an important category of analysis. As the 52nd round does not provide information on religion, only social groups were considered here. The sample is divided into three groups: scheduled castes (15%), scheduled tribes (9%) and a residual group, others (76%), comprising of forward caste Hindus, and other religious groups. Scheduled castes (SCs) are Hindus belonging by birth to the lowest of the four castes. They were formerly untouchables and, even now, are often economically and socially depressed. Scheduled tribes (STs), on the other hand, are members of economically and socially depressed tribes (which may be non-Hindu also) who were also treated as untouchables. In post-Independence India, Articles 341 and 342 of the Constitution provide a list of all SCs and STs under the Constitution (Scheduled Castes) Order, 1950, and the Constitution (Scheduled Tribes) Order, 1950, respectively, to facilitate affirmative action targeting such social groups. The caste profile shows a marginal increase in SCs and STs over the study period. This may reflect a greater willingness to report their underprivileged social status to take advantage of the increased benefits provided by the Government to SCs and STs since the 1990s (Government of India, Reference Ball and Bethell2006).
About 84% of the sample has primary education or an even lower level of education. However, educational levels have increased, with an increase in the proportion of respondents with more than primary level education from 15% to 17%. A large proportion of the elderly are engaged either in economic or in extended SNA activities, though the majority are in the residual category. There does not seem to have been any significant changes in their activity status.
The sample has a higher proportion of rural residents (63%), with the proportion increasing over time by 2 percentage points. Respondents from the Central and the Southern states comprise the major part of the sample (33% and 24%, respectively). Regional variations in the samples may be observed over time. Representation from the Northern and the Western states has declined (both by 2 percentage points), while that of the Central and the North-eastern states has increased (by 2.4 and 1.4 percentage points, respectively).
In addition to the above, mean and median per capita expenditure levels were also estimated. Means of expenditure in 1995–96 and 2004 were Rs437 and Rs740, respectively; the corresponding figures for the median were Rs362 and Rs571 (when an Indian Rupee is equal to about two US cents).
Comparison of self-perceived health status of elderly between rounds
Most of the respondents perceived a good state of health in both rounds, varying from excellent (8%) to good (70%). About 22% of respondents, however, perceived poor health status. This proportion is not concerning, given their age profile. What is interesting is that the proportion of respondents reporting poor health status has increased over the study period by 5 percentage points.
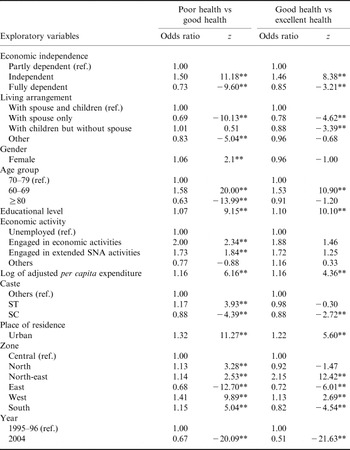
Table 1 presents the results of bivariate analysis between perceived health status and explanatory and control variables across the study period. It can be observed that there has been a substantial increase in respondents reporting poor health status in almost all cases. Although the percentage of persons reporting poor health status has increased among economically independent, partially dependent and fully dependent persons, the change in terms of percentage points between these categories is marginal. The increase is highest among respondents who reside with non-relations and are unemployed. Health status has improved only among inmates of old age homes, possibly as a result of improvement in their functioning, reflecting the growing societal concern for the elderly and increasing activism among NGOs and similar organizations. However, the decrease in proportion of inmates of such homes reporting excellent health over the study period indicates that there is still a need for improvement in this regard.
Table 1. Bivariate analysis of perceived current health status and explanatory (predictor) and control variables in 52nd round (1995–96) and 60th round (2004) of NSSO

Table 1 also shows that elderly males are more likely to report poor health than females. Compared with the ‘young-elderly’ (those aged between 60 and 69 years), ‘middle aged elderly’ (between 70 and 79 years) report a greater decline in excellent health; the ‘old-elderly’ (aged 80 years or more) also report a decline in health status, but its magnitude is in between the two age groups. Elderly with living spouse, widows and widowers are more likely to report poor health status compared with never-married respondents and divorcees. This may be because the latter had planned financially and had prepared themselves psychologically in advance for old age and destitution. Analysis of reported self-perceived health by educational level reveals that the decline in reporting ‘excellent’ health is greater among those with ‘middle’ levels of education, i.e. secondary (10 years of schooling) and higher secondary (12 years of schooling). This possibly implies that those with lower educational levels may be, in general, relatively less affluent (monthly per capita expenditure of the graduate elderly is Rs1676, compared with Rs1044 for those with secondary and higher secondary level education) and have relatively modest expectations compared with more educated elderly in terms of health status. Interestingly, graduates reporting poor health status have higher per capita expenditure levels than those reporting fair and excellent health.
There has also been a decline in economically active respondents reporting excellent health. This may reflect deteriorating working conditions over the study period. A substantial increase in unemployed respondents reporting poor health has also been observed.
Bivariate analysis of caste and perceived health status indicates a marked increase in reporting of ‘poor’ health status among the forward castes, followed by scheduled castes. Contrary to expectation, scheduled tribes, expected to have least access to health facilities and government programmes, have registered a marginal improvement in perceived health status.
The elderly belonging to urban areas were more likely to report poor health status in 2004 compared with 1995–96. Analysis by zones reveals that residents of Central India (comprising Bihar, Jharkhand, Uttarkhand, Uttar Pradesh, Chattisgarh, Madhya Pradesh and Rajsthan) have experienced the greatest decline in self-perceived health, followed by the aged living in the Eastern states of West Bengal, Orissa and Assam. Residents of North-east India actually report an improvement in self-perceived health status, while the decline in good reported health status among the elderly living in the Southern states of Andhra Pradesh, Kerala, Tamil Nadu and Karnataka is marginal.
Econometric analysis of all-India sample
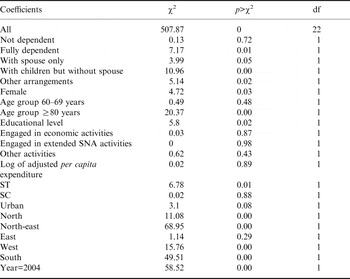
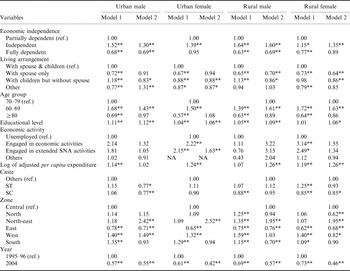
An ordered logit is used to identify determinants of self-perceived health status of the elderly in India. The χ 2 statistic for the Brant test (507.86, p<0.001) indicates that the proportional odds assumption is invalid. Two variants of the ordered logit model are considered. The likelihood ratio (LR) test statistic between the partial proportional odds model (results of the Brant test, given in Table A1, were used to select the variable parameters) and the variable parameter model is 122.31 (p<0.001). This indicates that the assumption of even the partial proportion odds assumption is too restrictive, so that the variable parameter model is appropriate. The results of this model are shown in Table 2. As expected, economically dependent elderly are more likely to report poor perceived health status compared with their independent counterparts. Results of the ordered logit model (Table 2) also indicate that residence in inter-generational households improves perception of health status positively. Persons engaged in economic activities or extended SNA activities are also more likely to report fair or excellent health status. In fact, the odd ratios of these two groups are higher than for all other variables.
Table 2. Results of generalized ordered variable parameters logit model, 52nd round (1995–96) and 60th round (2004) of NSSO
Ref.: reference category
** Significant at 5% level.
Observations=66,138; LR χ 2 (44)=9384.90 (p<0.001); Pseudo R 2=0.092.
Table 3. Results of ordered logit model by sex and place of residence, 52nd round (1995–96) and 60th round (2004) of NSSO
Ref.: reference category. NA, not applicable.
Significant at **5% level; significant at *10% level.
Females are found to be more likely to report fair health, and are as likely as males to report themselves to be in excellent health. Scheduled tribes are more likely to report themselves to be in fair health while SC members report poorer health status than non-SC or ST members. Both results are somewhat surprising and deserve a closer look. Among other control variables age, educational attainment and household per capita expenditure are found to have significant positive relationship with perceived health status.
It has been observed that urban residents are more likely to report themselves to be in fair or excellent health. This possibly reflects better access to health care facilities. Moreover, econometric analysis reveals that elderly people living in Western and North-eastern India are more likely to report themselves to be in fair or excellent health than those residing in Central India. In contrast, respondents from the Eastern states report themselves to be worse off. Respondents from both North and South India are more likely to report themselves to be in fair health. However, while the probability of a North Indian reporting excellent health is the same as a Central Indian, a South Indian is less likely to report excellent health.
Finally, the impact of the time dummy needs to be discussed. It had been seen earlier that self-reported health status deteriorated over the study period. Econometric analysis shows that this holds even after controlling for changes in socioeconomic characteristics. A person was 33% less likely to report fair health and 49% less likely to report excellent health in 2004 than in 1995–96.
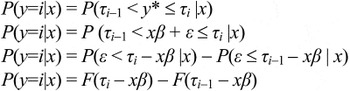
Econometric analysis by sex and place of residence
Table 3 presents estimates of the appropriate ordered logit model for the four major population groups: urban males, urban females, rural males and rural females. It can be seen that these results are similar to those obtained for the entire sample. What is interesting to analyse is the change in odds ratio for the time dummy. It can be seen that the odd ratio for the time dummy is less than unity (indicating a negative relationship with reported health status) for all sub-samples. In the case of Model 1 (poor health vs fair health) the odds ratio of time is lowest for urban males and females, respectively. This implies that the deterioration in health status between 1995–96 and 2004 is highest in urban areas. Given better access to health facilities and greater activism of NGOs in urban areas this result is surprising. The odd ratio in the case of Model 2 (fair versus excellent health) is lowest for urban females, closely followed by rural females; although the odd ratio is highest for rural males, the difference between males is marginal. Overall, therefore, urban females seem to be the most vulnerable section of the population compared with others.
Discussion
Based upon nationally representative data collected during 1995–96 and 2004 by NSSO, India, during its 52nd and 60th round surveys on Morbidity, Health Care and Condition of Aged, the present study shows the changes in demographic and socioeconomic conditions in the self-perceived health status of the elderly population in India over a decade.
The study used self-reported health status as a response variable. Several earlier studies have shown that self-reported health among elderly adults is a valid measure of the respondent's objective health status, an important predictor of survival in old age and a strong predictor of healthy longevity, even after controlling a number of factors associated with mortality, morbidity and disability (Jagger et al., Reference Jagger, Spiers and Clarke1993; McCallum et al., Reference McCallum, Shadbolt and Wang1994; Lee, Reference Lee2000; Ghosh & Husain, Reference Ball and Bethell2010).
An important result of this analysis is that the perceived health status of elderly has declined over the study period. Further, this decline is observed even after controlling for socioeconomic characteristics. Although studies on the elderly in India have emphasized their poor health status, they have not considered changes in the reported or actual health status over time. However, there has been a secular improvement in health facilities and greater acknowledgement of societal responsibility towards the elderly. The Government has introduced welfare schemes targeting senior citizens (like Annapoorna, Antodaya, National Social Old Age Pension, etc.), provided benefits to the elderly (lower train fares, higher exemption limits under income tax, etc.) and introduced legislation in the form of the Maintenance and Protection of Parents and Senior Citizens Act. Moreover, there has been increasing levels of activism by NGOs providing economic security and health care to the elderly. Given these steps, the current finding is unexpected. The reason for the deterioration in reported health status, in spite of this, needs a closer look and may comprise an area for future research.
In line with existing studies (Chou & Chi, Reference Chou and Chi2002; Gupta & Sankar, Reference Ball and Bethell2003; Rajan, Reference Rajan2006; Alam, Reference Alam2008; Mini, Reference Mini2009; Ghosh & Husain, Reference Ball and Bethell2010), age, educational attainment and household per capita expenditure are found to have a significant positive relationship with perceived health status.
This study's findings contrast with those of other researchers that observed females to report poorer health status than males (Gupta & Sankar, Reference Ball and Bethell2003; Rajan, Reference Rajan2006; Mini, Reference Mini2009; Ghosh & Husain, Reference Ball and Bethell2010). Sen (Reference Sen, Agarwal, Humphries and Robeyns2006), however, warns that social influences may reduce expectations and keep a person content in situations that appear unsatisfactory to others: ‘…the malleability of mental attitudes … may tend to hide and muffle the extent of deprivation in many cases,’ (Sen, Reference Sen, Agarwal, Humphries and Robeyns2006, p. 387). In this context, Sen (Reference Sen1985, Reference Ball and Bethell1993) cites a study by Lall & Seal (Reference Lall and Seal1949) during the Great Bengali famine of the 1940s reporting that 48.5% of widowers felt themselves to possess poor health status, as compared with 2.5% of widows. Sen (Reference Sen1993) also refers to the poorer self-reported health conditions reported in Kerala (having developed health and education) compared with states like Bihar and Uttar Pradesh with poor health infrastructure.
Scheduled castes are in a relatively less disadvantageous position in terms of education and economic status in Indian social strata compared with STs. Hence, the finding that STs are more likely to report fair health than SCs is somewhat surprising, and not entirely consistent with other works (Alam, Reference Alam2008). This finding may also be explained in terms social conditioning of perceptions referred to earlier (Sen, Reference Sen1993, Reference Ball and Bethell2006). Scheduled tribes have lower expectations and are content with lower actual health status. In contrast, SCs – who have benefited more from affirmative action (Government of India, Reference Ball and Bethell2006) – have higher expectations, so that they are dissatisfied with a health status better than that of STs.
From the present study it may be argued that economic conditions appear to be the crucial factor for the elderly across the world as it underlies all other determinants of living conditions and health status. This reconfirms findings of earlier studies (Knodel & Chayovan, Reference Ball and Bethell1997; Guilmoto & Rajan, Reference Ball and Bethell2002; Rajan & Kumar, Reference Rajan and Kumar2003; Gupta & Sankar, Reference Ball and Bethell2003; Alam, Reference Ball and Bethell2008; Mini, Reference Mini2009; Ghosh & Husain, Reference Ball and Bethell2010). This is important as about 52% of the elderly are completely dependent on their relatives. The lack of savings and economic vulnerability of the aged in India is also confirmed by the finding that 60% of female elderly and 30% of male elderly in India do not possess any valuable assets, and that about 10% of rural elderly face difficulties in accessing one of three basic needs such as food, clothing and medicine (Rajan, Reference Rajan2006).
The economic vulnerability of the elderly is particularly important given the high proportion of ailing persons (PAP) among the aged. The National Sample Survey Organization (2006) reports, for instance, PAP to be 30% among elderly in India. The report also estimates that 40% of the ailing persons were suffering from visual, locomotive, auditory or vocal disability, while a significant proportion was suffering from chronic diseases. For instance, about 20% of them were suffering from cardiovascular diseases, 15% had a cough (including tuberculosis of the lung, asthma, bronchitis and whooping cough) and 9% had diabetes. Along with day-to-day living expenses, treatment of these diseases requires prolonged medication. This reduces their purchasing power since familial transfers may not be sufficient in many cases to meet all these expenses. This is aggravated by the deceleration in productive employment and growing casualization of the labour market (Alam & Karim, Reference Ball and Bethell2006). Moreover, Alam (Reference Alam2008) has found that if consumption is taken as a close proxy for income, the internationally accepted one-dollar poverty norm appears to be a distant dream for many rural households with co-residing elderly. All this evidence indicates the extent of economic vulnerability and marginalization of the aged in India and calls for multi-pronged strategies and programmatic considerations.
Given the economic vulnerability of the elderly, residential arrangements may constitute an important source of security. Sen & Noon (Reference Ball and Bethell2007) have observed that residence in inter-generational households seems to provide protection from falling sick with short-term illnesses. Similar findings were also reported by Gupta & Sankar (Reference Ball and Bethell2003). The importance of residing in inter-generational households is also underlined by the present study.
Many researchers on ageing in India have argued that the influx of Western attitudes and culture, increasing work pressure on the working class, and similar processes associated with the integration of Indian economy and society with Western economies have led to a substantial reduction in co-residential arrangements and interaction between elderly parents and children (Rajan et al., Reference Rajan, Misra and Sarma1999; Bali, Reference Bali1999; Bose & Shankardass, Reference Ball and Bethell2004; Alam, Reference Alam2006). The increasing conflict between generations has led to an increasing preference among even the elderly to live apart from their offspring, though maintaining ties with them. An increasing proportion of the aged are thus found to be residing in nuclear families, with their spouses, rather than in inter-generational households. Further, studies have also shown that work pressure and physical strain on the children, coupled with rising costs of living intensifying competition for scarce family resources, adversely affects relations between the elderly and their family members (Agewell Foundation, Reference Ball and Bethell2010). Such trends are marked in urban areas where the forces of urbanization and Westernization are more sweeping and where social isolation and lack of social networks is more common. In particular, the plight of elderly females appears to be most concerning. Starting from an initially disadvantaged position in a patriarchal society, the status of women deteriorates sharply as they lose their functional importance within the family (Bagchi, Reference Bagchi1997). Further, inter-generation conflict is often sharpest between the elderly female and her daughter-in-law. Lack of economic security, mobility and scope for social interaction increases her social isolation and vulnerability (Ghosh & Husain, Reference Ball and Bethell2010). In the case of widows, their lives are further disorganized by the emotional loss suffered and erosion of status within the family. Given this situation, the decline in reported health status found in the present study is not surprising.
The bleakness of these findings should be counterbalanced with the stability of co-residential arrangements (Palloni, Reference Palloni2001): NSS data reveals that 84% of the aged still co-reside with their children in urban areas. The phenomenon of ‘living apart but together’ (Sokolovsky, Reference Sokolovsky2001) also shows how traditional living arrangements are adapting to structural and socioeconomic changes (Gangrade, Reference Gangrade and Bali1999). In such families, although co-residential arrangements have disintegrated, the joint family persists as a functional unit with the family drawing closer during crisis (Nayyar, Reference Nayyar and Bali1999). In addition, factors like the altruistic caring of parents by children (Alam, Reference Alam2006), media campaigns attempting to sensitize society and institutions to the needs and concerns of the elderly (a recent advertisement by a fast food company, for instance, shows children relieving the social isolation of their aged neighbours by sharing a pizza with them), increasing activism of the civil society and various institutions (like the judiciary), and the introduction of government policies referred to earlier seeking to provide economic, social and emotional security to the aged are also important.
This raises questions about the ‘discourses of neglect’ being heard in developing countries. As pointed out by Sokolovsky (Reference Sokolovsky2001), these discourses are, in part, narratives of caution. To some extent, also, these may be the result of the activism of civil society providing a new platform where these discourses can be voiced and increasing awareness of one's rights and society's duties. To what extent, therefore, the decline in reported health status is a result of actual changes in the predictor variables, and to what extent it is the result of changes in subjective evaluation of one's welfare, is an important question that needs exploring.
Appendix
Ordered models
The basic idea underlying the ordered model is the presence of a continuous latent variable (y*) that can only be captured through the ordinal response variable (y). The latent variable can be related to the ordinal response variable using the following rule:
The structural model is:
The model can now be expressed in terms of probabilities:
In terms of odds:
The log likelihood function for ordered logistic regression is:
![$$\sum\limits_{i=1}^{j} \sum\limits_{j=1} Ln[F(\tau_j X\beta) F( \tau_{j-i} 1 X\beta)]$$](https://static.cambridge.org/binary/version/id/urn:cambridge.org:id:binary:20151019051641895-0286:S0021932010000623_eqnU5.gif?pub-status=live)
Its relevance to the current research problem is obvious – the actual health condition is a continuous latent variable that is captured through the reported health status (an ordinal categorical variable).
Table A1. Results of Brant test