


Introduction
The literature abounds with studies of intergenerational transmission of reproductive behaviour. Evidence from a number of countries and time periods indicates the existence of a positive correlation between the number of parents' siblings and the number of their own children. Demographers and sociologists have, for over a hundred years, been interested in intergenerational reproductive behaviour patterns. Pearson et al. (Reference Pearson, Lee and Bramley-Moore1899) considered the number of children of different dyads, including father–son, mother–daughter and paternal grandmother–granddaughter pairs. Pearson product moment correlation coefficients are the most common form of summary measure used today. Economists have largely focused on the relationships between reproductive behaviour and investments in human capital (Becker, Reference Becker1960; Becker & Lewis, Reference Becker and Lewis1973; Becker & Tomes, Reference Becker and Tomes1976; Becker & Barro, Reference Becker and Barro1988; Hanushek, Reference Hanushek1992; Ermisch, Reference Ermisch2003) and between reproductive behaviour and life expectancy (Livi-Bacci, Reference Livi-Bacci2001; Lee, Reference Lee2003).
Murphy & Knudsen (Reference Murphy and Knudsen2002), using the Danish Fertility Database, found that the reproductive behaviour of parents and their children is positively correlated. Tremblay (Reference Tremblay1997) studied intergenerational transmission of reproductive behaviour in Saguenay at the end of the 19th century. The results of their analysis suggest that daughters' fertility levels are responsive to their mothers' relative fertility. These studies generally assert that women whose parents had a large number of children tend to have larger numbers of children than their peers. These studies often refer to parental role model effects and the impacts of early childbearing on subsequent family structure.
Patterns of early childbearing, and their tendency to be repeated in subsequent generations, feature prominently in the literature on intergenerational transmission of reproductive behaviour. Thus, respondents whose mothers were teenagers at first birth were more likely to be parents in their teens. Anderton et al. (Reference Anderton, Tsuya, Bean and Mineau1987) suggest that observed correlations in reproductive behaviour between generations are largely a consequence of similarity in ages at marriage. The studies also tend to focus on family background as a factor that exerts a powerful influence on teenage reproductive behaviour. Young people for whom one or both parents are absent are more likely to become parents early in life (Wellings et al., Reference Wellings, Wadsworth, Johnson, Field and McDowall1999). Many such studies have noted that women from single-parent households are at higher risk of forming such households themselves (Thornton & Camburn, Reference Thornton and Camburn1987; McLanahan & Bumpass, Reference McLanahan and Bumpass1988; Trent, Reference Trent1994).
However, none of these studies specifically examines the link between the number of siblings and the number of children ever born to a woman of completed fertility in Botswana. The dynamics of growing up in a large or small family might shape a woman's reproductive behaviour and subsequently characterize her lifetime reproductive performance.
This study investigates the intergenerational transmission of reproductive behaviour patterns in Botswana. It aims to find out whether the reproductive behaviour of one generation affects the reproductive behaviour of the next in Botswana, and specifically the degree to which original family size affects women's subsequent completed fertility. Based on the literature reviewed, which suggests that women whose original families were large are significantly more likely to have larger families themselves, the study will explore whether transmission of reproductive behaviour from one generation to the next affects women in Botswana homogeneously.
Data and Methods
Data for this analysis come from the Botswana AIDS Impact Survey (BAIS), which was conducted in 2001 under the auspices of the Central Statistics Office's programme of household surveys. A nationally representative, randomly selected sample of men and women aged 10–64 years were interviewed in both urban and rural areas.
Sampling design
A stratified two-stage probability sample design was utilized for the sample selection. The first stage was the selection of enumeration areas (EAs) as primary sampling units (PSUs), selected with probability proportionate to size (PPS), where measures of size were the number of households obtained from the 1991 Population and Housing Census. In all, 98 EAs were selected with PPS out of 215 EAs. At the second stage of sampling, households were systematically selected from a fresh list of occupied households prepared at the beginning of the survey's fieldwork (i.e. listing of households for the selected EAs). Overall, 2126 valid households were selected systematically. The sample is not self-weighting because it was stratified by districts. Of the 2126 households selected for the BAIS sample, 2023 were found to be occupied. Of these, 1781 households were successfully interviewed, yielding a household response rate of 88% (90% for urban areas and 86% for rural areas). In the interviewed households, 4728 eligible persons aged 10–64 years were identified. Of these, 4494 persons were successfully interviewed, yielding a response rate of 95%. The National Ethics Committee gave ethical approval for the survey.
This analysis examines the association between the number of siblings and the number of biological children ever born to women respondents aged 40–64 years. This age group was chosen based on the assumption that even though childbirth may still occur at this age, it is rare. In this study childbirth is assumed to have been completed at these ages. Also, women who have never given birth to a live child have been excluded from this study. The restriction on women who are childless is based on the fact that there will be no observations on age at first birth if they were included in the sample. With these restrictions, the weighted sample is composed of 90,523 women.
Survey respondents were asked questions on their socioeconomic background, demographic characteristics and their knowledge and awareness of HIV and AIDS. Women were also asked questions on their reproductive performance. To obtain variables such as the number of siblings and total number of children ever born to a woman, the following questions were asked:
• How many children were born to your natural mother in her life time?
• How many times have you given birth (to a live child)?
Answers obtained from the first question above were taken as a proxy for the size of the family the respondent grew up in (the number of siblings). Answers obtained from the second question were taken as a proxy for the total number of children ever born to a woman, which constituted the dependent variable in this study. Other independent variables included age, education, residence, duration at residence, marital status, age at first birth, religion and contraceptive use.
Numerous other factors may influence women's reproductive behaviour, including family type, gender preference in offspring, cultural beliefs about the value of children, and others. This analysis was not able to include these factors since the data were not collected in the original survey. Also, as is the case with all survey data based on individuals, responses in the Botswana AIDS Impact Survey are not immune to errors such as recall errors due to memory lapses, duration heaping and event omission (both deliberate and accidental).
Analysis
Statistical methods applied in this study are: descriptive statistics (means and standard deviations for continuous variables and proportions for categorical data); multiple linear regressions (given that the dependent variable is continuous); and a correlation matrix to measure the linear relationship between the dependent variable and the independent variables on the one hand and among the independent variables on the other.
Descriptive statistics
Commonly used measures of central tendency for continuous variables are applied. If X 1, X 2, X 3,… Xn are independent variables of interest, then the mean and the standard deviations are computed using the following formulae:
For categorical variables percentages are applied.
Correlation matrix
The study sought to investigate whether there is a relationship between the size of the family a woman grew up in and the number of her children ever born. One way of expressing this relationship is to construct a correlation matrix, which is a measure of the linear relationship between the dependent variable and the independent variables on the one hand and among the independent variables on the other, relating positively or negatively or non-related (Edwards, Reference Edwards1976). The degree of the relationship is measured by the correlation coefficient (Dowdy & Wearden, Reference Dowdy and Wearden1983; Rodgers & Nicewander, Reference Rodgers and Nicewander1988), which quantifies the relationship between two variables.
Variables that are thought to be associated with the number of children ever born to a woman in her lifetime in this study are: number of siblings (X 1); age at first birth (X 2); education in years (X 3); duration at place of residence (X 4); age at time of survey (X 5); religion (X 6); marital status (X 7); urban–rural residence (X 8); and contraceptive use (X 9).
Multiple linear regression
Given the study objective, namely to find out whether the reproductive behaviour of one generation affects the reproductive behaviour of the next, the total number of children ever born to a woman aged between 40 and 64 years will be predicted when the number of siblings equals i, and all the other variables are at their means. If Y is the dependent variable and X stands for the independent variables, the linear additive functional relationship between the dependent and independent variables can be presented as:
where Y is the dependent variable; α is the marginal value; β 1, β 2, β 3 … βn are the coefficients of determination; X 1, X 2, X 3, … Xn are the independent variables of interest and ε is the error term.
The parameter β 1 measures the change in the mean value of Y to a unit (positive/negative) increase or decrease in the value of X 1 when all other independent variables are held constant. The strength of the linear relationship is measured by the coefficient of determination R 2. One of the advantages of multiple regression analysis is that it allows the identification of which few variables among a large set of independent variables have a significant relationship with the dependent variable after adjusting for other important independent variables.
Hypotheses
The study's hypotheses are:
• There is a positive relationship between the reproductive behaviour of an older generation and the reproductive behaviour of its descendants.
• Intergenerational transmission of reproductive behaviour from an older generation does not affect the subsequent generation uniformly in Botswana.
• Age at first birth and the number of children ever born are negatively related.
• Education has a negative relationship with children ever born.
Results
General characteristics of the sample population
More than half of women in the sample (57%) had their first child when they were aged less than 20 years; 39% had 7–9 siblings each; 28% had never been to school; 53% were educated only up to primary school level; and only 23% had used contraceptives.
Measures of central tendency
Table 1 presents descriptive statistics for the average number of children ever born to women aged 40–64 years by socio-demographic variables. It clearly shows an increase in the number of children ever born for an increase in the number of siblings a woman has. The highest number of siblings corresponds with the highest number of children ever born to a woman, on average.
Table 1. Average number of children ever born to women aged 40–64 years by selected independent variables

Comparatively large numbers of births are found among uneducated women, women of Muslim and ‘other’ religions, women living in rural areas (including those living in urban villages) and among women in the 60+ age cohort.
The table also shows that the number of children declines with an increase in education. The reproductive performance of women who have never been married before is notable. Although they constitute only 26% of the sample, their average number of children is almost as high as that of women who are either married now or have been in the past (4.9 versus 6 respectively).
Application of the correlation matrix
Outputs of this model are summarized in Table 2. The correlation matrix output indicates that the total number of children ever born to a woman is either negatively or positively correlated with all the independent variables at the 1% level of significance. The table shows that the number of siblings (X 1) is positively correlated with children ever born (Y). This means that the higher the number of siblings, the higher the number of children ever born to a woman of completed fertility. Other variables showing a positive relationship with children ever born include duration of stay at place of residence (X 4), woman's age at survey (X 5) and marital status (X 7). Those variables inversely related with children ever born are age at first birth (X 2), education (X 3), religion (X 6), residence (X 8) and contraceptive use (X 9). From the table, the number of siblings also appears to be negatively correlated with age at first birth. In other words, a tendency to start childbearing earlier for women who grew up in large families is indicated, but this relationship is not statistically significant.
Table 2. Results of the correlation matrix model

* Correlation is significant at the 1% level (2-tailed).
Y, children ever born; X 1, number of siblings; X 2, age at first birth; X 3, education; X 4, duration of residence; X 5, age at survey; X 6, religion; X 7, marital status; X 8, residence; X 9, contraceptive use.
Regression analysis
Table 3 summarizes the results of the regression models. Model 1 is a bivariate regression model, which views the expected number of children ever born as a linear function of the number of siblings. Alone, the number of siblings appears to exert a significantly positive influence on the children ever born. One additional sibling increases the number of children ever born by 12%.
Table 3. Regression of children ever born on number of siblings and other selected socio-demographic variables

* Significant at 1% level.
Reference categories are: women of Muslim and other religions; women who had never married before; women who reside in urban villages and in rural areas; and women who have never used contraceptives.
It is possible that an independent variable will have an important effect on a dependent variable when considered by itself, but will not be significant after adjusting for other independent variables. Model 2 show the influence of the number of siblings after adjusting for continuous independent variables included in the analysis. Model 3 extends Model 2 by incorporating the dummy variables, namely religion, marital status, residence and contraceptive use. This constitutes the full model. The number of siblings maintains its significant effect on the number of children ever born even after adjusting for all the independent variables in the model. In fact the effect gets stronger with addition of controls. After controlling for other variables, one additional sibling increases the number of children ever born by 17%, as opposed to 12% in Model 1 when it was considered alone.
Of all the independent variables included in the analysis, second only to marital status, the number of siblings appears to have a strong influence in increasing the number of children ever born (1% significance level). The other β coefficients generally confirm the relative influence of each independent variable depicted in the correlation matrix. Duration at place of residence, marital status and age at survey exert a positive influence on the number of children ever born; while age at first birth, education, religion, residence and contraceptive use exert a negative influence.
Women who start their childbearing later significantly reduce their number of children ever born. One year's increase in the age at first birth decreases a woman's fertility level by 8%. While this impact does not change with the introduction of control variables, the effect of education diminishes from 18% to 14% when additional independent variables are added, as shown in Model 3. Similarly, the relative influences of marital status, religion, contraceptive use, age and duration of stay at the place of residence can be interpreted from the values of the β coefficients of the models in Table 3.
The collective effect of the independent variables on the woman's parity is reflected by a parameter designated as R 2, the coefficient of determination. This measures the percentage of the total variability in the dependent variable that is explained by the independent variables. If this number is large, it suggests a substantial predictive ability of the independent variables. In Model 3 the adjusted R 2 is 0.235, which means that about 24% of the total variability in the number of children ever born to a woman can be explained by the variables in the model. The remaining percentage of variability is assumed to be explained by other independent variables that were not included in the regression model.
Therefore, there are other variables (measurable and non-measured) that can directly or indirectly affect the number of children ever born to a woman. Some of these variables may include migration factors, types of marriages and other socio-cultural beliefs of different societies. In societies where there is a strong desire for sons, for example (Hank, Reference Hank2007), the number of children ever born to a woman may be high if many families continue to have children until they have at least one son. There may also be heritable conditions associated with reduced fertility of the woman's parents, such as epithelial ovarian carcinoma which, if inherited, may contribute to a woman's reduced fertility (Harlap et al., Reference Harlap, Olson, Curtin, Caputo, Nakraseive, Sanchez and Xue2002).
Prediction of children ever born
A conditional effect plot shows predicted values of Y against one X variable, with the other X variables held constant. The regression equation in Model 3 is:
The relationship between Y and X 1 when all the other X variables equal their mean is:
Supposing a woman's mother gave birth to a total of six children, i.e. the number of siblings (X 1)=6, the number of children ever born to this woman can be predicted as:
Similarly, predicted children ever born (Ŷ i) for all the remaining values of sibling size (X 1) can be calculated. Connecting a set of such (X 1, Ŷ) points produces a conditional effects plot. Figure 1 is a conditional effects plot showing Ŷ=0.167X+4.615. The conditional effects plot clearly shows that when the number of siblings is high, the predicted number of children ever born also tends to be high, and vice versa. This confirms the hypothesis that there is a positive relationship between the fertility of the ‘older’ generation and the fertility of its descendants.
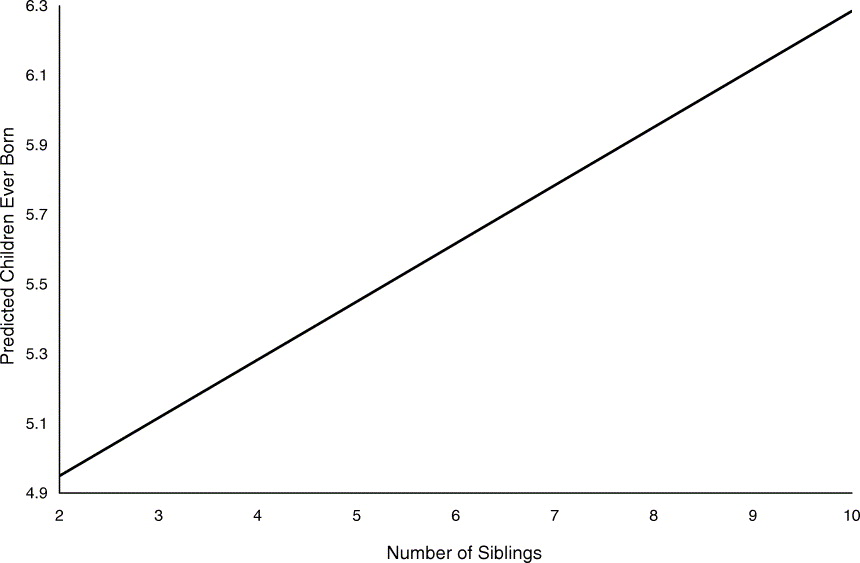
Fig. 1. A conditional effects plot showing Ŷ=0.167X+4.615.
A challenge for studies attempting to measure the impact of the number of siblings on fertility is that there may be some variables that are correlated with both the number of siblings and the dependent variable, i.e. completed fertility. With regard to education for example, the question is: does the transmission of fertility affect higher educated women less than lower educated women? To answer this question, the sample was stratified into three subsamples: one comprising women with no education, the second women educated only up to primary school level, and the third women with secondary and higher education. The results are presented in Table 4.
Table 4. Regression of children ever born: stratified by education

* Significant at 1% level.
Reference categories are: women of Muslim and other religions; women who had never married before; women who reside in urban villages and in rural areas; and women who have never used contraceptives.
The regression results show a big difference in the manner in which the number of siblings affects children ever born among women stratified by education. For highly educated women, the regression coefficient is only 0.021, while for women with no education the coefficient is 0.325. This means that the effect of original family size on the offspring is larger for women who have never been to school (i.e. the number of siblings has a greater influence in increasing the number of children ever born among non-educated women than it does among highly educated ones). For non-educated women, one additional sibling increases the number of children ever born by 33%, while for highly educated women an additional sibling increases children ever born by only 2%, thus confirming that the transmission of reproductive behaviour affects higher educated women less than it does lower and non-educated women.
Table 5 shows the regression of children ever born stratified by cohorts aged 40–49 years, 50–59 years and 60+ years. In all three age cohorts, the number of siblings has a positive effect on the number of children ever born. However, the influence of the number of siblings on children ever born is highest in the middle cohort aged 50–59 years (28% compared with that for the oldest and youngest cohorts which stands at 24% and 8% respectively).
Table 5. Regression of children ever born: stratified by age cohort

* Significant at 1% level; **significant at 10% level.
Reference categories are: women of Muslim and other religions; women who had never married before; women who reside in urban villages and in rural areas; and women who have never used contraceptives.
Table 6 stratifies the sample by age at first birth; namely those who started childbearing before age 20, those who started between the ages of 20 and 24 years, and those who started at age 25 and above. The table shows that transmission of reproductive behaviour appears to have a strong influence on the number of children ever born among women who started childbearing later in life. Among women who initiated childbearing at age 25 and above, one additional sibling increases their biological children by 41% while for women whose age at first birth was less than 20, an additional sibling increases their offspring by only 8%. The influence of sibling size on children ever born gets stronger as the age at first birth gets older. This table also confirms the negative correlation between the age at first birth and the number of children ever born.
Table 6. Regression of children ever born: stratified by age at first birth

* Significant at 1% level.
Reference categories are: women of Muslim and other religions; women who had never married before; women who reside in urban villages and in rural areas; and women who have never used contraceptives.
Conclusion
This study explored whether there is an association between the number of siblings and the number of children ever born to a woman of completed fertility in Botswana. The fertility of parents (the number of siblings) consistently had a significant and positive influence on the number of children ever born per woman of completed fertility. A negative correlation between the number of siblings and age at first birth was also found (i.e. as the number of siblings increases, a woman's age at first birth decreases).
The study also showed that the transmission of reproductive behaviour from an older generation does not affect the subsequent generation uniformly. The influence on children ever born was much stronger for women who started their childbearing at an older age compared with those whose age at first birth was lower. The results suggest that transmission of reproductive behaviour affects higher educated women less than lower and non-educated women. It was found that the age cohort 50–59 years was influenced most by reproductive behaviour when it comes to intergenerational fertility transmission. The number of siblings as a fertility determinant may very well have confounded previous completed fertility analyses in Botswana. It is concluded that a woman's number of siblings is strongly associated with her completed family size in Botswana and this relationship should not be ignored.


