Introduction
Involuntary childlessness and difficulties conceiving are associated with detrimental psychological and social effects in a variety of contexts across sub-Saharan Africa (Dyer et al., 2002b, Reference Dyer, Abrahams, Mokoena, Lombard and Van der Spuy2005; Hollos & Larsen, Reference Hollos and Larsen2008; Hollos et al., Reference Hollos, Larsen, Obono and Whitehouse2009; Fledderjohann, Reference Fledderjohann2012; Rouchou, Reference Rouchou2013). In light of the negative social consequences associated with infertility, the high rates (Larsen, Reference Larsen2000; Mayaud, Reference Mayaud2001) found across much of the subcontinent are troubling. However, without adequate measures of infertility, the social impact of the condition is difficult to pinpoint. Much of the literature on measurement of infertility in sub-Saharan Africa focuses on the best measure for estimating prevalence, and on the utility of demographic measures in particular (Larsen & Menken, Reference Larsen and Menken1989, Reference Larsen and Menken1991; Larsen, Reference Larsen2000, Reference Larsen2005; Larsen & Raggers, Reference Larsen and Raggers2001), but these measures very often err on the side of producing conservative estimates, and may not align with women’s own definitions of infertility (Gerrits, Reference Gerrits1997; Leonard, Reference Leonard2002). More broadly, as several previous studies have noted (Habbema et al., Reference Habbema, Collins, Leridon, Evers and Lunenfeld2004; Gnoth et al., Reference Gnoth, Godehardt, Frank-Herrmann, Friol, Tigges and Freundl2005; Gurunath et al., Reference Gurunath, Pandian, Anderson and Bhattacharya2011), there is a wide variety of measures available in the extant literature. A key criticism of extant measures is that even measures falling within the same broad category (e.g. epidemiological measures, demographic measures) vary from one another on factors such as how long the couple must spend trying to conceive and whether individuals should be excluded from definitions of infertility on the basis of their marital status and age. One consequence of this ambiguity is substantial disagreement on point estimates of infertility prevalence (Gurunath et al., Reference Gurunath, Pandian, Anderson and Bhattacharya2011).
Following from this criticism, a broad debate has emerged regarding how infertility should be measured, particularly in the context of comparability when assessing prevalence (Habbema et al., Reference Habbema, Collins, Leridon, Evers and Lunenfeld2004; Gnoth et al., Reference Gnoth, Godehardt, Frank-Herrmann, Friol, Tigges and Freundl2005; Gurunath et al., Reference Gurunath, Pandian, Anderson and Bhattacharya2011). We would add to this debate that comparability is of value beyond the context of prevalence studies, and that assessments of the social consequences of infertility are improved by consistency with prevalence figures, and vice versa: if the social consequences of infertility are found to be severe, it is helpful to know which fraction of the population is impacted. Inversely, if there are few consequences of infertility, a high prevalence may not be of great public health concern when compared with other reproductive health issues. In the context of limited public health resources, consistency of measurement is thus crucial. Furthermore, as some of the highest rates of infertility in the world are found in sub-Saharan Africa (Mascarenhas et al., Reference Mascarenhas, Flaxman, Boerma, Vanderpoel, Mathers and Stevens2013), we contend that a suitable measure should be capable of being constructed with relative ease from secondary survey data, as much of the quantitative work on infertility across sub-Saharan Africa (and in other low- and middle-income regions, where infertility rates are also high) is based on secondary survey data. Finally, we argue that, in addition to underlying biological ability to conceive, perceptions about one’s ability to conceive are likely to be salient for understanding social outcomes (Leonard, Reference Leonard2002), and a useful measure of infertility should therefore also correlate with subjective assessments. Using Ghana as a case study, this paper compares several potential measures of infertility with the aim of identifying a measure that a) closely matches standard objective measures, b) can be constructed from survey data, and c) is correlated with subjective assessments of ability to conceive.
Childbearing in Ghana
Childbearing, which provides couples with economic resources, adult status and ancestral ties, is an expected and nearly universal aspect of marriage in Ghana; the consequences of infertility are often severe (Oppong & Abu, Reference Oppong and Abu1987; Donkor, Reference Donkor2008; Farnes et al., Reference Farnes, Beckstrand and Callister2011; Tabong & Adongo, Reference Tabong and Adongo2013). The practice of bridewealth is on the decline in Ghana but, where still practised, repayment may be demanded of the bride’s family if the couple fails to produce biological offspring (Armstrong, Reference Armstrong1997; Aryee, Reference Aryee1997), highlighting the centrality of childbearing to marriage in Ghana (and placing severe pressure to conceive on the bride). In addition to suffering repayment of the bridewealth, infertile women may also lose access to their land and homes, and may struggle to find a source of economic support (Hollos et al., Reference Hollos, Larsen, Obono and Whitehouse2009). Beyond economic concerns, infertile women are often blamed for their infertility, resulting in substantial social stigma and ostracism (Fledderjohann, Reference Fledderjohann2012; Tabong & Adongo, Reference Tabong and Adongo2013). Infertile women may be labelled as worthless, and are seen as incapable of fulfilling their roles as adult women, giving rise to depression and diminished self-worth (Donkor, Reference Donkor2008). Childlessness may even lead to denial of important funerary and burial rights in some contexts, particularly where funeral costs are borne by one’s offspring (Donkor, Reference Donkor2008; Hollos et al., Reference Hollos, Larsen, Obono and Whitehouse2009).
Although the majority of childbearing occurs within the context of marriage, non-marital childbearing is not uncommon (Gyimah, Reference Gyimah2003; Takyi & Gyimah, Reference Takyi and Gyimah2007). Of particular interest in the context of this study, some extramarital partnerships may in fact be entered into for the specific purpose of testing one’s fertility if a child has not been conceived within the marriage (Fledderjohann, Reference Fledderjohann2012). While family size is declining, the Ghanaian total fertility rate (TFR) of 4.2 children per woman is low compared with the figure of 5.1 children for sub-Saharan Africa as a whole (Population Reference Bureau, 2012). The timing and pace of fertility are influenced by factors such as norms regarding postpartum abstinence and breast-feeding, gender roles and migration patterns. These factors in turn shape the duration of spells of abstinence, coital frequency, fertility desires, contraceptive use and other determinants of fertility (Bongaarts et al., Reference Bongaarts, Frank and Lesthaeghe1984).
However, the associations between fertility and its determinants are not straightforward, and often these factors interact in complex ways. For example, where there is not a high premium placed on gender egalitarianism in relationships, partner fertility preferences may asymmetrically influence fertility behaviours. Several studies of contraceptive use and fertility behaviour in Ghana have provided evidence that a sizeable portion of the inverse relationship between women’s empowerment and fertility rates in fact operates through the influence of partner preferences in fertility behaviour (Ezeh, Reference Ezeh1993; DeRose & Ezeh, Reference DeRose and Ezeh2005; Dodoo & Frost, Reference Dodoo and Frost2008). Similarly, pointing to the complexities of the determinants of fertility in Ghana, a recent study of urbanization and fertility provides evidence of a strong, negative association between urbanization and fertility (White et al., Reference White, Muhidin, Andrzejewski, Tagoe, Knight and Reed2008), but also shows that this association differs by parity, and may in part be driven to selection effects, in which those most likely to migrate to urban areas may already have lower fertility desires. These examples highlight the multifaceted nature of family structure and childbearing decisions in Ghana, and point to the need for an infertility measure that is applicable across a wide variety of family formation pathways.
Measurement of infertility
Measurement of infertility is an area of much debate in recent literature, owing in part to the vast and growing array of available measures (Habbema et al., Reference Habbema, Collins, Leridon, Evers and Lunenfeld2004; Gnoth et al., Reference Gnoth, Godehardt, Frank-Herrmann, Friol, Tigges and Freundl2005; Gurunath et al., Reference Gurunath, Pandian, Anderson and Bhattacharya2011). While there is wide agreement that a standardized, comparable measure of infertility is needed, there is less agreement about the form the measure should take. Habbema et al. (Reference Habbema, Collins, Leridon, Evers and Lunenfeld2004) argued that ambiguous terminology in the infertility literature has led to confusion of infertility with sterility, as well as disagreement about how long a couple must try to conceive before being labelled infertile, leading to confusion both within the literature and, in a medical setting, among patients. To ameliorate these issues, they advocate using a three-pronged clinical approach based on a descriptive statement of time spent trying to conceive, a diagnostic measure of ability to achieve a pregnancy (rather than live birth) and a prognostic statement on a 4-point scale ranging from normal fertility (Grade 0) to sterility (Grade 4) based on the probability of spontaneous conception. Gnoth et al. (Reference Gnoth, Godehardt, Frank-Herrmann, Friol, Tigges and Freundl2005) agree that a clinical measure is useful, but instead propose a three-step grading of infertility: slightly subfertile (after six ovulatory cycles without a conception), moderately or serious subfertile (after twelve cycles – the standard cut-off in the literature) and completely infertile (after 48 cycles). Notably, while the description of both approaches includes a discussion of the decline in ability to conceive with age, neither advocates the exclusion of couples or women on the basis of a strict age cut-off. In fact, Gnoth et al. (Reference Gnoth, Godehardt, Frank-Herrmann, Friol, Tigges and Freundl2005) asserted that the effect of age varies on the basis of individual factors to such an extent that the association between probability of conception and age is only able to be assessed after a first clinical infertility exploration.
The approaches outlined above are clearly aimed at medical practitioners, and may be of less use to researchers focused on the prevalence and/or psychosocial implications of infertility rather than on its treatment. While we agree that consistency of measurement is vital for ensuring the comparability of findings, we contend much of the research on infertility in low- and middle-income countries comes from secondary survey data, and clinical measures may be difficult to construct from these data. Especially concerning is that survey responses cannot adequately capture conception (Larsen, Reference Larsen1994), and may underestimate pregnancy loss (Casterline, Reference Casterline1989). In order to facilitate cross-national comparisons of the prevalence of infertility over time, Gurunath et al. (Reference Gurunath, Pandian, Anderson and Bhattacharya2011) called for development of a standardized definition of infertility based on an age-specific waiting time to pregnancy. They noted that, while biomedical measures of infertility fail to capture the spectrum of reproductive capacity (conception may be more or less difficult, rather than simply a binary state) and are of limited utility for prevalence and public health research, demographic measures are not useful for identifying patients in need of treatment in a clinical context owing to the long waiting times to conception required by the measures.
In the biomedical literature, clinical definitions identify infertility as no conception after 12 months of regular, unprotected sex; epidemiological definitions extend the requisite length of intercourse to 24 months (Marchbanks et al., Reference Marchbanks, Peterson, Rubin and Wingo1989), but the focus remains on conception rather than live births. Clinical definitions are often used in medical settings, where short waiting times to diagnosis and a focus on conception ensure that couples will receive treatment early to address potential problems. These measures may overestimate infertility, as couples may naturally take longer than 12 months to conceive without being infertile (Larsen, Reference Larsen2005). Demographic infertility measures are based on live births rather than conception for a sexually active woman not using contraception (Larsen, Reference Larsen2005), and most require 5 or 7 years from either (a) the date of marriage in the case of primary infertility (childlessness), or (b) the date of last birth in the case of secondary infertility (subsequent to the birth of a child). While this approach could still overestimate infertility rates, the long waiting times used for these measures tend to minimize bias.
When contraceptives are used, lack of pregnancy probably reflects the effectiveness of the contraceptive method rather than underlying infertility. While some couples using contraceptives may be sterile, failure to remove successful contraceptors from the pool of women at risk for infertility results in an overestimate of infertility (Marchbanks et al., Reference Marchbanks, Peterson, Rubin and Wingo1989; Larsen, Reference Larsen1994). Modern contraceptives may be more effective than traditional methods at preventing pregnancy, but research in Tanzania and Nigeria suggests that some women may believe that modern contraceptives actually cause infertility (Koster-Oyekan, Reference Koster-Oyekan1999; Gijsels et al., Reference Gijsels, Mgalla and Wambura2001; Mgalla & Boerma, Reference Mgalla and Boerma2001). Women who desire no more children may also be consciously limiting fertility via methods other than contraceptive use (such as lactational ammenhorea), but women’s fertility desires may have a limited impact on their fertility behaviour due, in part, to the strong role of men’s desires in shaping fertility behaviour (Ezeh, Reference Ezeh1993; DeRose & Ezeh, Reference DeRose and Ezeh2005). Women who are infertile with intent (i.e. who desire to have children but are infertile) report greater distress and other negative consequences than women without intent (that is, who are sterile but not trying to conceive; Greil & McQuillan, Reference Greil and McQuillan2004; Greil et al., Reference Greil, McQuillan, Johnson, Slauson-Blevins and Shreffler2010). Although excluding those who do not wish to conceive from the pool of infertile women may underestimate infertility, including those who are infertile without intent may cause a downward bias in estimates of the social impact of infertility. There is a natural decline in the ability to conceive over time (Larsen, Reference Larsen1994; Gnoth et al., Reference Gnoth, Godehardt, Frank-Herrmann, Friol, Tigges and Freundl2005; Broekmans et al., Reference Broekmans, Knauff, te Velde, Macklon and Fauser2007; Gurunath et al., Reference Gurunath, Pandian, Anderson and Bhattacharya2011), and infertility can be expected to increase as cohorts age. Whether perceived difficulties conceiving also increase as cohorts age is unclear. There may also be religious and ethnic differences in the prevalence of infertility, perhaps as a result of differences in sexual and childbearing norms (Frank, Reference Frank1983; Ericksen & Brunette, Reference Ericksen and Brunette1996; White et al., Reference White, Zaba, Boerma and Blacker2001; Anarfi & Owusu, Reference Anarfi and Owusu2011).
The value of self-identified infertility
Little attention has been paid to the association of biomedical and demographic measures with perceived ability to conceive, particularly in sub-Saharan Africa, due in part to the dearth of self-identified measures in survey data. However, there is some evidence pointing to the value of self-identified measures in the study of infertility. One study (Dick et al., Reference Dick, Bain, Purdie, Siskind, Molloy and Green2003) using case-control data on ovarian cancer in Australian women showed only 70% of women who were identified as infertile using an epidemiological measure self-identified as infertile, and 5% who were identified as fertile reported difficulty conceiving. The study concluded that self-reported difficulty conceiving is a particularly useful measure for assessing the burden of fertility problems. In Tanzania, Larsen (Reference Larsen2005) found that a significantly higher proportion of women were identified as infertile based on time to conception than on time spent trying to conceive (in both cases using a 24-month measure), providing further evidence that perceptions may not align with biomedical definitions as currently constructed.
Yet it remains unclear how perceived difficulties conceiving and more objective measures in the biomedical and demographic literatures are related. For many outcomes of interest, perceived difficulties conceiving may be more salient than externally defined measures. It may be the case that self-assessment is the most useful measure for understanding the influence of infertility on social outcomes; the effects will presumably be greatest when a woman is perceived to be infertile, by herself and/or her husband, family, friends and other members of her community. For example, marital discord will probably arise only when difficulties conceiving are acknowledged by at least by one member of the dyad. Indeed, US-based survey research has shown that, compared with other measures of fertility barriers, self-identified infertility is the greatest predictor of fertility-specific distress (Jacob et al., Reference Jacob, McQuillan and Greil2007). Acceptable waiting times to pregnancy – that is, the amount of time a couple may try to conceive before suspecting impaired fertility – will differ between social groups (Leonard, Reference Leonard2002), reducing the stability of the measure and thereby making the subjective assessments less attractive for assessing the epidemiological prevalence of infertility in a population. Yet ‘objective’ measures in biomedicine and social science may fail to accurately capture the social consequences of infertility, as these measures apply a uniform waiting time to all women, and are therefore unable to account for variability in personal and cultural perceptions as to what constitutes an acceptable waiting time to conception.
Leridon’s (Reference Leridon1991) work on impatience to conceive in France during 1978–1988 highlighted the importance of perceptions in shaping who is identified as infertile. Leridon documented a steep rise in self-reported difficulties conceiving, without corresponding evidence of a rise in infertility, which he attributed to changing norms around acceptable waiting times. In sub-Saharan Africa, studies that focus on perceptions of infertility are rare due to data limitations; however, a few key qualitative studies provide some evidence on the importance of these perceptions. Using in-depth interviews with 26 Malawian men and women, Barden O’Fallon (Reference Barden-O’Fallon2005) found that expectations for rapid childbearing are high, and that couples who do not conceive within a period as short as a few months may begin to perceive fertility problems. Based on qualitative interviews in Chad, Leonard (Reference Leonard2002) noted that the underlying assumption of demographic measures that infertility is the same across time and place is inaccurate, and argued instead that infertility may be perceived as having too few children, with the definition of ‘too few’ varying across time and between cultures. As a result, Leonard contended, subjective measures of infertility may be a better predictor of social outcomes, including marital disruption, abuse, poverty, social isolation and treatment-seeking.
Contributions of the current study
Work on perceived difficulties conceiving in sub-Saharan Africa suggests that self-identified measures may be more salient for social outcomes, but this body of work tends to rely on small samples of cross-sectional data, and has generally not examined the degree to which subjective measures are correlated with more objective measures from the demographic and biomedical literature. Acceptable waiting times to pregnancy, which are shaped by cultural norms (Gijsels et al., Reference Gijsels, Mgalla and Wambura2001; Leonard, Reference Leonard2002), influence who identifies as having difficulties conceiving. An accurate understanding of the implications of infertility in sub-Saharan Africa requires use of an appropriate definition: if objective and subjective assessments are closely aligned, it may be possible to use the measures interchangeably in social science research; if, however, the correlation between subjective and objective assessments is low, reliance on biomedical/demographic measures may provide an inaccurate picture of the social consequences of infertility in the region. In order to assess the utility of these measures, this paper uses longitudinal data to examine: 1) which measure of infertility that can be constructed from survey data is tied to both objective biomedical/demographic measures and perceived difficulties conceiving and, as a validity check, 2) whether measures relate to background characteristics (age, ethnicity, religion) in an expected manner. The assessment of relationship to background characteristics is based on the association between sexual practices, infertility and sociodemographic background established in the literature.
Methods
Data and measures
Eight rounds of secondary longitudinal data collected across six communities in Ghana by the Population Council of New York and the University of Cape Coast between 1998 and 2004 were used for the analyses. Ethics approval for this research was obtained from the Pennsylvania State University Institutional Review Board. Selection of the six communities included in the sample was based on a purposive sampling design in which between-community diversity in local ecology, economic modality and ethnicity was maximized (for full details, see Casterline, Reference Casterline2007). Preliminary data collection to assess the proposed survey sites in the form of exploratory interviews and focus groups, a pilot survey and a household census took place between 1994 and 1997. Of the six communities, two were in coastal and four were in inland regions. The locations were mainly rural, located in the Western, Central and Greater Accra regions, and the primary economic modalities across communities included a range of fishing, trading and farming. Within the four smallest communities, the households were enumerated in the preliminary data collection phase, and all women of reproductive age were included in the survey sample. In the larger communities, simple random sampling was employed to select the sample. As a result of this survey design, the data cannot be taken to be representative of Ghana as a whole, but are representative of the selected communities. Interviews were conducted face-to-face in local languages (Ewe, Fante, Ahanta, Twi, Ga, Adangbe or Hausa) using an instrument that had been pre-tested both in English and in the local language. Interview teams consisted of one supervisor and four interviewers, with interviewers being selected from the sampled communities.
Women aged 15–50 at Wave 1, of all marital statuses, were sampled. Respondents were given a main survey relating to demographic characteristics, fertility behaviours and other variables. Respondents also provided retrospective information on contraceptive use for each month between waves. Due to left-censoring, data were not available for contraceptive use prior to the first wave of data collection. In Wave 1, 1219 women were sampled; 219 women were added in Wave 2 to adjust for attrition. Twelve cases were ineligible, resulting in a sample of 1364. Where respondents did not participate in one wave, considerable effort was made to locate the respondents in the next wave, resulting in some small fluctuation in sample sizes from wave to wave. The original Cape Coast survey schedule and sample sizes at each wave are provided in Fig. 1. In order to compare the same sample of women across measures while reconciling quite a disparate array of infertility criteria, the sample was restricted to women aged 15–49 because the association between self-identified difficulties conceiving and age is not well-established in the literature, and because many survey data sets focused on reproductive health tend to focus on this age range. The final analytic sample size was 1350. Missing data for background and demographic variables were around 3% in most cases, and more varied among other indicators. Fertility desires had the highest amount of missing data (19.27%). Missing data were multiply imputed using the ICE procedure in Stata 11 with ten imputed data sets. Results were combined using the mim procedure.

Fig. 1 Data collection schedule and sample sizes by wave for the Cape Coast data, 1998–2004.
Four objective measures of infertility were drawn from the literature, but with important modifications to fit with the goals of identifying a measure that a) closely matched standard objective measures, b) could be constructed from survey data, and c) was correlated with subjective assessments of ability to conceive. Note that the term ‘standard’ measure is used loosely here given that, as discussed above, there is considerable disagreement in the literature on how to construct these measures. The main criterion used to maintain consistency with previous literature was time to a live birth. Most common in the extant literature is a 12-month measure, typically called clinical infertility, followed by 24-, 60- and 72-month measures (Gurunath et al., Reference Gurunath, Pandian, Anderson and Bhattacharya2011). No adjustments were made for postpartum amenorrhoea, both because specific questions on amenorrhoea may not be available in survey data, and because it may be difficult to distinguish postpartum from nutritional amenorrhoea, which may be of particular concern in countries with high rates of malnutrition.
The objective measures modified and included here were clinical, epidemiological, demographic 5-year and demographic 7-year infertility. These measures of infertility focused on women who were infertile with intent (Greil & McQuillan, Reference Greil and McQuillan2004; Greil et al., Reference Greil, McQuillan, Johnson, Slauson-Blevins and Shreffler2010). Unfortunately, it was not possible to distinguish between primary and secondary infertility due to data limitations. Specifically, the number of cases of primary infertility was too low (as low as seven cases by the end of the survey in the case of the demographic 7-year measure) to support models split by primary and secondary infertility. The focus was on live births due to difficulties accurately identifying conception (particularly pregnancy wastage, which may be underestimated by 50% in survey data; Casterline, Reference Casterline1989). Additionally, survey data may underestimate pregnancy if the respondent is pregnant but not aware of the pregnancy. This is particularly problematic for cross-sectional data, where there is no opportunity for a follow-up survey to reveal a pregnancy retrospectively. Moreover, measurement of conception is vital in a clinical setting, where the aetiology of infertility determines the available treatment. However, as infertility is a social phenomenon in addition to being a biological condition, a focus on live births would seem more appropriate, as the goal for most couples is a live birth, not simply a conception. In fact, in some settings, even having too few children, or not having children of a particular sex, may be viewed as a form of infertility (Leonard, Reference Leonard2002).
The clinical definition identified a woman as infertile after 12 months of regular, unprotected sex without a birth; the epidemiological definition extended the waiting time to 24 months. The demographic definitions identified a woman as infertile if she had not achieved a live birth after 5 or 7 years of unprotected intercourse. The distinguishing factor between objective measures was waiting time. Self-assessed difficulties conceiving were measured by responses to the question ‘When you want to become pregnant, do you become pregnant quickly, or does it take a long time?’ Women who responded ‘takes a long time’ or ‘can no longer become pregnant’ were classified as having perceived difficulties conceiving; women who responded ‘quickly’ were classified as not reporting any difficulties conceiving. Women (5.4%) who responded ‘cannot get pregnant’ to a second question, ‘Would you like to have (a/another) child (with your husband/partner) or would you prefer not to have any (more) children (with him)?’ were also classified as reporting perceived difficulties conceiving. These questions were asked only in Waves 1 and 6–8.
Among respondents who perceived difficulties, 83.5% responded ‘takes a long time’ and 16.5% said that it is impossible (based on either measure) to conceive. The response ‘takes a long time’ could mean that a woman takes longer than average to conceive but is capable of conception, is infertile but reluctant to classify herself as such, or is unaware that she is infertile. However, Greil (Reference Greil1991) found that US women undergoing treatment were more likely to identify as ‘not yet pregnant’ than ‘infertile’, suggesting that indirect questions may include women who experience stigma and fertility-specific distress, but are reluctant to embrace the infertile label. Similarly, qualitative work by Loftus (Reference Loftus2009) and Andrews et al. (Reference Andrews, Abbey and Halman1991) showed that infertile women may experience the social consequences of infertility without labelling themselves as such due to the negative connotations associated with the label, supporting use of the response ‘takes a long time’ as a measure of perceived difficulties conceiving.
A substantial portion (25.5%) responded ‘don’t know’ when asked whether they become pregnant quickly. While women who express uncertainty about their infertility status could conceivably say they don’t know because they are not currently sexually active, they are unlikely to be identified as infertile because the contraceptive measure used includes abstinence. Moreover, only women who were married or in a union were included; while couples may abstain due to migration, norms about postpartum intercourse, or a variety of other reasons, excluding single women from the sample does reduce the risk of identifying sexually inactive women as infertile. Robustness checks were conducted using correlations, test–retest, and random effects models to compare the effects of dropping respondents who replied ‘don’t know,’ coding ‘don’t know’ responses as reported perceived difficulties conceiving, and coding ‘don’t know’ responses as reporting no difficulties. Based on these robustness checks, women who replied ‘don’t know’ were counted as reporting perceived difficulties. Waiting times were calculated based on months since the most recent birth. For women who had never given birth, waiting times were based on the union start date. Due to small cell counts for primary infertility (as discussed above), primary and secondary infertility were combined, with infertile women being coded 1, and ‘other’ as 0.
In order to avoid false positives in the coding of infertility, successful contraceptors should not be counted as infertile; however, it seems that no prior research has systematically compared different methods for accounting for contraceptive use – particularly when assessing the correlation between subjective and objective measures. In this study, three subsets of measures were created: (a) unadjusted measures, which do not account for contraceptive use or fertility desires, (b) contraceptive adjusted measures, which consider only women who desire to have a child and who are not using any contraceptives (including herbs, withdrawal and abstinence) as potentially infertile (with women who do not desire additional children and/or who are currently contracepting coded as 0), and (c) modern adjusted measures, which treat only women who desire children and are not currently using modern contraceptive methods (IUDs, the pill, etc.) as potentially infertile. Given that equivalent results were obtained for contraceptive and modern adjusted measures, only results for modern adjusted measures (hereafter referred to as adjusted measures) are presented in the random effects and test–retest models. The risk period began at the first survey in which no contraceptive use was reported. Questions regarding current contraceptive use for each month were taken from the retrospective calendar data. Infertile women may use contraceptives; while false negatives would create a downward bias in estimates of infertility, if infertility is unperceived, it is unlikely to have social consequences. Table 1 provides an overview of how each measure was constructed, with differences in waiting times and contraceptive use between measures catalogued.
Table 1 Infertility measures by waiting time and contraceptive use

Contraceptive use was higher than expected. Among those who said it takes a long time to conceive, 65% reported using any form of contraceptive. Contraceptive use was even higher among those who said it is impossible to conceive (73%), but lower among those who said they didn’t know (56%). Contraception was highest among those who said it was impossible to conceive. This may stem from cultural notions about ageing and reproductive fatigue (Bledsoe, Reference Bledsoe2002), and may support the notion that couples use contraceptives for purposes other than pregnancy prevention (Meekers & Calvès, Reference Meekers and Calvès1997).
Analytic strategy
First, correlations between measures of infertility/perceived difficulties and contraceptive use were examined at each wave and across waves. The next set of analyses examined relationships between measures of infertility, perceived difficulties and key background variables: age, ethnicity and religious identification. Age was expected to be positively associated with all measures of infertility, as prior research has documented the decline in the ability to conceive with age (Weinstein et al., Reference Weinstein, Wood and Chang1993). Ethnicity and religious affiliation were considered due to their association with sexual and birthing practices (Addai & Trovato, Reference Addai and Trovato1999), which may shape both exposure to risk factors for infertility (reproductive tract infections, STIs, etc.; Frank, Reference Frank1983; Addai, Reference Addai1999, Reference Addai2000) and notions of acceptable waiting times. For this analysis, observations were pooled across all waves. As pooling violated the independence assumption (Johnson, Reference Johnson1995), random effects logistic regression models were employed in order to adjust for the non-independence of observations across waves (Hall, Reference Hall2000; Hartzel et al., Reference Hartzel, Agresti and Caffo2001).
The paper also sought to answer the question of which measure was the most reliable over time using a test–retest model. A tetrachoric test–retest model for dichotomous outcomes was employed to examine the stability of measures across waves; as with the random effects models, the test–retest approach appropriately accounts for the non-independence of observations across waves (Johnson, Reference Johnson1995; Alwin, Reference Alwin2007). Assuming the least stringent biomedical measure, most stringent demographic-style measure and the subjective assessment of difficulties conceiving will approximately capture the range of impaired fertility, and given the high correlation of biomedical and demographic measures, only one biomedical measure (clinical) and one demographic (7-year) measure were included in the model. Because the perceived difficulties measure was not available in Waves 2 to 5, the test–retest analysis was limited to Waves 6, 7 and 8. Wave 1 was excluded both because trends could not be continuously assessed throughout Waves 2 to 5, and because impaired fertility figures in Wave 1 are slightly inflated.
One advantage of using random effects models with longitudinal data, as has been done here, is that within-person change can be modelled. In the cross-sectional case, it is difficult to disentangle a cohort effect (for example, if improvements in reproductive health care across time have meant better reproductive health for younger individuals) from an age effect, in which the underlying biological ability to conceive diminishes with age. As the longitudinal models employed here track within-person change across time, the age covariate more accurately reflects the underlying phenomenon of interest. In a similar vein, the aim of the test–retest models is to uncover which measure is most reliable over time. A measure that accurately captures shifts in underlying ability to conceive is crucial, and such an assessment is best accomplished with longitudinal data.
Results
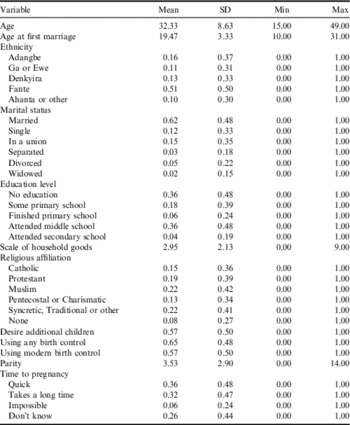
Table 2 provides descriptive statistics. Respondents are aged between 15 and 49, with a mean of 32.33. Mean age at first marriage (19.47) is on a par with national statistics (Demographic and Health Surveys, 2011). A majority (51%) of the sample is Fante. Over 60% of the sample is married, and an additional 15% are involved in a non-marital union. Twelve per cent are never-married, while the remaining 10% are either separated, divorced or widowed. Note that the inclusion of separated, divorced and widowed women in the sample represents women who were married or in a union in previous waves, but who were excluded from subsequent waves after relationship disruption because they no longer fit the inclusion criteria. Nearly a quarter of the sample identifies as Muslim (22%), and an equal percentage identify with a syncretic, traditional or another religion. Only 8% report no religious affiliation.
Table 2 Descriptive statistics, Cape Coast data, Ghana, 1998–2004

N=1350; pooled N=10,800.
Fifty-seven per cent report wanting a(nother) child. Sixty-five per cent of respondents use contraceptives, and 57% report using a modern method. Respondents average 3.53 children, close to the TFR for Ghana. Thirty-six per cent of the sample report that they become pregnant quickly. Nearly another third (32%), say it takes a long time for them to become pregnant, while 6% say it is impossible. An additional 26% responded ‘don’t know’ to this question.
Table 3 presents the proportion infertile across waves for the measures included in subsequent analyses (for findings for measures not included in the subsequent analyses, see Table 4). Impaired fertility figures in Wave 1 are slightly inflated when compared with subsequent waves, probably due to an ambiguous measurement period for contraceptive use at Wave 1. Similarly, the increase in impaired fertility observable in Wave 8 may reflect women who are pregnant but do not realize it. Unadjusted and adjusted versions are presented for clinical, epidemiological and demographic-style measures, as well as for perceived difficulties conceiving. More women are identified as infertile by clinical measures than by epidemiological and demographic measures. The proportions identified as infertile by the unadjusted measures are substantially higher than adjusted measures.
Table 3 Proportion infertile across waves for measures included in subsequent analyses, Cape Coast data, Ghana, 1998–2004
N=1350.
Table 4 Proportion infertile across waves for measures not included in subsequent analyses, Cape Coast data, Ghana, 1998–2004

N=1350.
With minor exceptions, impaired fertility increases across waves, probably as a result of ageing across waves. The highest estimate (unadjusted clinical in Wave 6) identifies nearly three-quarters of the sample (0.74) as infertile. The lowest estimate (the demographic-style 7-year measure; adjusted, in multiple waves) identifies only 1% of the sample as infertile. A large portion of this variation can be accounted for by eliminating successful contraceptors from the pool of at-risk women. On considering only the measures that exclude women who are using contraceptives, the highest proportion identified as infertile drops from 0.74 to 0.20 (adjusted perceived difficulties, Waves 1 and 8). The second factor accounting for this variation is waiting time. Short waiting times may reflect difficulty conceiving without indicating inability to conceive; couples may still conceive naturally beyond the clinical 1-year mark (Larsen, Reference Larsen2000, Reference Larsen2005). For perceived difficulties conceiving, culturally defined ‘acceptable’ waiting times may influence identification as infertile; variance between subjective and objective measures is partially dependent on cultural norms.
Correlations within and between all measures across all waves were tested. For brevity, selected results are presented here. Results for epidemiological infertility are remarkably similar to clinical results, while demographic-style 5- and 7-year results closely approximate one another. Among the unadjusted objective measures, impaired fertility and contraceptive use are positively, significantly associated within each wave; a significant portion of women who are classified as infertile by the unadjusted measure are successful contraceptors. There is a weak, sometimes significant, positive correlation between perceived difficulties conceiving and contraceptive use. Correlations were examined for each measure with itself across waves. For all measures, correlations range from weak to moderate, with correlations between proximate waves being greater than those between distal waves. Associations between impaired fertility in Wave 1 and subsequent waves are the weakest, probably due to the inflated frequencies discussed above. The same relationship holds for perceived difficulties conceiving. Correlations are generally positive and statistically significant, with strength ranging from weak to moderate.
The highest correlation for the biomedical measures across waves is 0.47. There appears to be substantial variation in who is identified as infertile from wave to wave, probably as a result of the short waiting times involved in these measures. Among demographic-style measures, the highest correlation is 0.60, with less variation from wave to wave, probably due to longer waiting times resulting in greater stability. Correlations between perceived difficulties are comparatively low; the highest correlation among perceived difficulties is 0.30. Among objective measures, correlations are highest among measures similar in terms of waiting times; the correlation between adjusted clinical and epidemiological measures is 0.86 – nearly as high as the correlation between the clinical measure and its adjusted contraceptive counterpart. The correlations between the clinical and demographic-style 5- and 7-year measures are much lower, at 0.52 and 0.38 respectively. Perceived difficulties are most closely aligned with the clinical measure, followed by epidemiological, demographic 5-year, and, finally, demographic 7-year measures; perceived difficulties are positively associated with the objective measures, though the demographic 7-year measure is non-significant.
Table 5 provides results for random effects models examining the relationship between measures and background characteristics. Model 1 shows clinical infertility as a function of age, ethnicity and religious identification. For every one-year increase in age, there is a 9% increase in the odds of identification as infertile. Denkyira respondents have greater odds (OR=1.45) of identification as infertile than the reference group (Ahanta or other ethnicity). Religion is not a significant predictor. Model 2 shows the results for adjusted clinical infertility. The relationship between adjusted clinical and age is highly significant, positive (OR=1.17) and curvilinear; ethnicity and religious affiliation are non-significant predictors.
Table 5 Random effects model of clinical infertility, demographic infertility, perceived difficulties conceiving, and background characteristics, Cape Coast data, Ghana, 1998–2004

Pooled N=10,800.
*p<0.05; **p<0.01; ***p<0.001.
Age2 divided by 1000.
Model 3 shows unadjusted demographic infertility as a function of age, ethnicity and religious affiliation. Age is positively, significantly associated with infertility: for every year increase in age, the odds of identification as infertile increase by 18%. Denkyira respondents are significantly more likely (OR=1.75) to be infertile than those identifying as Ahanta or another ethnic group. The odds of infertility are 52% higher for Protestant respondents than those who don’t identify with any religion. The results for the adjusted demographic measure are provided in Model 4. The relationship between age and standard demographic infertility is significant (OR=1.40) and curvilinear, with infertility increasing until around age 40, then declining slightly thereafter. Ethnicity and religion are no longer significant predictors.
The final models in Table 5 provide the random effects models for perceived difficulties conceiving. There is a statistically significant curvilinear relationship between unadjusted perceived difficulties conceiving and age. Model 5 shows that perceived difficulty conceiving declines until around age 30, then begins to rise steadily thereafter. Catholic respondents have 36% lower odds of perceiving difficulties conceiving than those with no religious affiliation. Model 6 shows the results for the adjusted measure. The relationship between age and perceived difficulties is significant but no longer curvilinear once contraception is accounted for. Additionally, accounting for contraception reduces the effect of religious affiliation to non-significance.
Table 6 provides results for the test–retest model. Model fit, measured by the Root Mean Square Error of Approximation (RMSEA), was examined for the following theoretically motivated models: a) all errors were uncorrelated, and no paths were constrained to be equal across waves, b) errors for each measure between Waves 6 and 7, and Waves 7 and 8 are correlated, c) errors for each measure between Waves 6 and 7, 6 and 8, and 7 and 8 are all correlated, d) errors were uncorrelated, but paths for each measure were constrained to be equal across waves, e) paths were constrained to be equal and errors were correlated between Waves 6 and 7 and Waves 7 and 8, and, finally, f) within measures across waves, all errors were correlated, and all paths were constrained to be equal. Based on the model fit statistics, model (f) was selected (RMSEA=0.027). Results presented are from standardized models.
Table 6 Test–retest model for clinical, demographic 7-year and perceived difficulties conceiving, Cape Coast data, Ghana, 1998–2004

N=1350.
*p<0.05; **p<0.01; ***p<0.001; RMSEA=0.027.
Coefficients within measures across waves have been constrained to be equal, and thus do not vary across waves. The coefficients for the impaired fertility measures represent their reliability (Johnson, Reference Johnson1995; Alwin, Reference Alwin2007). Clinical infertility appears to be the most reliable measure of the latent construct, as indicated by the large coefficients for this measure across waves, though the coefficient is not significant. Clinical infertility is followed by the demographic 7-year measure, which is a highly significant indicator of underlying infertility. Reliability is lowest for perceived difficulties conceiving, though also significant and only slightly less reliable than the demographic measure.
The paths for the relationship between latent impaired fertility in Waves 6 and 7 and Waves 7 and 8 represent the stability of the measures across waves. Although these paths were not constrained to be equal, they are remarkably similar, suggesting that the stability between Waves 6 and 7 is only marginally lower than the stability between Waves 7 and 8. This suggests that the stability of the measures fluctuates very little across time. However, given that these coefficients are only moderate in strength (B=0.57 and 0.58 respectively), the stability of the measures is not particularly high across waves. This is somewhat surprising given within-person variation in biological ability to conceive could reasonably be expected to be fairly low, and further pointing to the salience of psychosocial factors in identifying impaired fertility. The moderate stability of the measures across waves, then, suggests that current measures are imperfect indicators of underlying inability to conceive.
Finally, Table 6 includes the correlations of errors to capture associations among unmeasured characteristics. While these correlations do not provide information about the reliability or stability of the measures, they do suggest that there is a significant association between the unmeasured characteristics of respondents who are identified as infertile by the demographic measure and, to some extent, by the perceived difficulties conceiving, but not those who are clinically infertile. Characteristics used to identify demographic infertility vary little as a result of the long waiting time; this is less true of perceived difficulties conceiving, which does not specify a waiting time, and especially of clinical infertility, which designates a very short waiting time, causing substantial change in identification according to the latter measures across time. Moreover, because the time span of the demographic measures is greater than the time between waves, some of the same births are counted in each measure producing substantial autocorrelated error. Overall, the test–retest models show that the demographic 7-year measure was the most reliable statistically significant indicator of infertility. This provides some support for Larsen’s (Reference Larsen2005) assertion that biomedical definitions of impaired fertility are not stringent enough to be useful for estimating prevalence.
Robustness checks
A number of alternative specifications of the models were tested as a robustness check on the findings. First, secondary infertility may differ qualitatively from involuntary childlessness, both in terms of the social consequences of infertility and the likelihood of self-identifying as having difficulties conceiving. Although the data did not include a sufficient number of cases to model primary infertility separately, the correlations, random effects models and test–retest excluding primary infertility (that is, excluding non-pregnant women at parity 0) were re-estimated. With one exception (discussed below), results were largely unchanged when women with primary infertility were excluded from the models.
For example, in the random effects models predicting unadjusted clinical infertility as a function of background sociodemographic characteristics (corresponding to Model 1 in Table 5 for the full sample), age (OR=1.09) and ethnicity (Denkyira OR=1.47) are the only significant predictors. The coefficient for age is identical to that in the full sample, while the odds ratio for Denkyira has increased by 0.02 (from OR=1.45 in the full sample). Similar patterns were found across the other measures and models – that is, occasional marginal shifts in the magnitude of coefficients, but no changes in significance levels or the direction of the relationships. The only exception was for the random effects models predicting unadjusted perceived difficulties: ethnicity became a marginally significant predictor in the sample restricted to women of parity greater than 0. Specifically, while the odds ratio for Adangbe was non-significant at 0.79 in the full sample, a stronger, significant association was observed for this ethnic group in the restricted sample (OR=0.64; p<0.05). The remaining coefficients in the restricted sample remained similar in significance, magnitude and direction to those observed in the full sample.
Second, although only results from the clinical, demographic 7-year and self-identified measures were reported for conciseness, it is possible that substantial differences exist between the two biomedical measures, as well as between the two demographic measures. To examine this possibility, both the test–retest and random effects models were estimated using the epidemiological and demographic-style 5-year measures (rather than the clinical and 7-year measures, as reported above). Results for the epidemiological models were nearly identical to those for the clinical measure, while results for the 5-year demographic measure were also very similar to those for the 7-year measure.
Discussion
A large array of infertility measures have been identified in the demographic and biomedical literature, contributing to a lack of comparability across studies and widely varying prevalence rates (Gurunath et al., Reference Gurunath, Pandian, Anderson and Bhattacharya2011). While there is a clear need for standardization of measurement (Habbema et al., Reference Habbema, Collins, Leridon, Evers and Lunenfeld2004; Larsen, Reference Larsen2005; Gnoth et al., Reference Gnoth, Godehardt, Frank-Herrmann, Friol, Tigges and Freundl2005; Gurunath et al., Reference Gurunath, Pandian, Anderson and Bhattacharya2011), many of the proposed measures are of limited utility outside of a clinical setting. A suitable measure should be easily constructed from secondary survey data and should correlate with subjective assessments. In this paper, longitudinal survey data were used to answer the following: (1) which measure of infertility that can be constructed from survey data is tied to both objective biomedical/demographic measures and perceived difficulties conceiving and (2) which measures relate to background characteristics (age, ethnicity, religion) in an expected manner?
Capitalizing on the ability to assess within-person reliability of measures across time arising from the longitudinal data, the present results show that while the trends in infertility across time are similar across the objective measures, longer waiting periods result in more stringent, stable measures. However, perceived difficulties conceiving were most closely aligned with clinical infertility, suggesting that long waiting times required by demographic-style measures may be too conservative to fit with women’s own assessments. The demographic 7-year measure behaved in the most predictable way – that is, rising steadily across time, in keeping with bodily ageing and declining probability of conception. Notably, the fact that correlations between the same measure across waves are not higher probably reflects the idea that fertility is not a binary state, but a continuum along which conception may be easier or more difficult. Though there is a sporadic relationship between infertility, ethnicity and religious affiliation, only age is consistently related to infertility. The models provide evidence that the effects of ethnicity and religious affiliation are tied to one another, as well as being closely tied to contraceptive use, in keeping with literature outlining differences in sexual practices associated with ethnicity and religious beliefs (Frank, Reference Frank1983).
In order to compare the same sample of women across measures while reconciling quite a disparate array of infertility criteria, several coding decisions were made about the measures that, in different instances, resulted in some modifications to the measures. First, the sample was restricted to women aged 15–49 because the relationship between self-identified difficulties conceiving and age (particularly cross-culturally) is not well-established in the literature, and because many survey data sets focused on reproductive health tend to focus on this age range, probably reflecting both biological and normative limits on reproductive age around the globe. Second, adjusted and unadjusted measures were compared to examine the effect of fertility desires and contraceptive use. Gurunath et al. (Reference Gurunath, Pandian, Anderson and Bhattacharya2011) noted that demographic-style measures of infertility often do not (or cannot) distinguish between voluntary and involuntary absence of a live birth, and so may overestimate infertility if the absence of a birth is voluntary. They suggested that marital status may be a useful proxy for voluntary childlessness depending on the context, but this suggestion of a context-specific measure seems to be at odds with the call for a standardized measure for cross-national comparisons across time. Furthermore, previous qualitative research has suggested that infertility may increase the risk of relationship disruption (Dyer et al., 2002a; Dyer, Reference Dyer2007; Fledderjohann, Reference Fledderjohann2012), pointing to potential endogeneity between marital status and infertility; empirical research is needed to test this association.
This study has examined how controlling for fertility desires and contraceptive use shapes our understanding of infertility. It was found that the correlations revealed little difference between measures controlling for all contraceptive use compared with adjusted methods. Comparing unadjusted and adjusted measures reveals that a large proportion of those identified as infertile based purely on waiting times are successful contraceptors; accounting for contraceptive use, then, is important to avoid false positives. Finally, no adjustments were made for postpartum amenorrhoea, both because specific questions on amenorrhoea may not be available in survey data, and because it may be difficult to distinguish postpartum from nutritional amenorrhoea, which may be of particular concern in countries with high rates of malnutrition. As malnutrition may be sustained, nutritional amenorrhoea could represent a barrier to fertility, and correction for this phenomenon could create a (probably slight) conservative bias.
In sum, demographic measures of infertility are too conservative to match with individual notions of difficulties conceiving. The distinction between controlling for modern versus all contraceptives made little difference; controlling for all methods is advisable for a stringent measure. Individual assessments of ability to conceive may be far more salient for understanding the social implications of infertility, and the clinical measure appears to be the most appropriate objective measure for social research on infertility. This probably reflects the short waiting time to conception often expected of couples. However, given the strong similarities between biomedical measures of infertility, epidemiological infertility may serve as a more reasonable and conservative substitute. The longer waiting time to conception required by an epidemiological measure is particularly important because, constructed on the basis of survey data using time to live births rather than conceptions, the clinical measure may identify a woman as infertile after 12 months since her last birth. In reality, this leaves approximately 3 months for a conception to be achieved when 9 months of gestation is factored in. As a result, a clinical measure may overestimate infertility, especially as many women with potential secondary infertility will still be experiencing postpartum amenorrhoea.
This possibility of overestimating infertility is particularly problematic for prevalence studies. While it would be possible with longitudinal survey data to retrospectively track the date of pregnancy based on the date of live birth and thereby improve the measure, this method poses two problems for the current purposes. First, many of the most widely used data sources for this purpose (especially the Demographic and Health Surveys) are cross-sectional, and such retrospective correction would not be possible. Second, the method would be unlikely to capture spontaneous abortions, particularly those in early pregnancy, and inability to accurately track pregnancy wastage in survey data (Casterline, Reference Casterline1989) could result in a systematic bias. Furthermore, while a focus on ability to conceive is useful in a clinical setting, where treatment options vary based on the infertility aetiology, arguably for most couples the ultimate goal is live birth, not a pregnancy. As infertility is a social and not just a biological condition, focus on a live birth is arguably preferable. As an epidemiological measure is less likely to overestimate infertility while still correlating closely with self-assessed measures, use of a 24-month epidemiological measure of infertility is recommended in future research, corrected for both fertility desires and contraceptive use.
There are some important limitations to the study. First, because the data are based solely on Ghana, the findings cannot be generalized more broadly. Additional research is needed both within and outside of sub-Saharan Africa to determine if the measure recommended here performs well in other settings. Moreover, the sampling frame for the Cape Coast data was designed to maximize ethnic, economic, kinship and between-community diversity (Casterline, Reference Casterline2007). This emphasis on diversity of the sample may have resulted in selection bias. Future research should attempt to replicate the findings using a nationally representative sample. Second, due to data limitations, it was not possible to distinguish between primary and secondary infertility. The prevalence of secondary infertility tends to be much higher than that of primary infertility (Larsen & Raggers, Reference Larsen and Raggers2001; Mascarenhas et al., Reference Mascarenhas, Flaxman, Boerma, Vanderpoel, Mathers and Stevens2013), and the causes and social consequences of primary versus secondary infertility can be quite different (Larsen, Reference Larsen2000; White et al., Reference White, Zaba, Boerma and Blacker2001). Following from these points, it may also be the case that the reliability of infertility measurements, and particularly their relationship to background characteristics, may differ for primary and secondary infertility.
Third, in order to maximize criterion agreement between the objective measures of infertility used here, the versions of these measures in this paper are modified versions of the clinical, epidemiological and demographic measures identified in the literature. For instance, Larsen and Menken (Larsen & Menken, Reference Larsen and Menken1989, Reference Larsen and Menken1991) suggested using age 45 rather than age 49 as the upper bound age group for infertility calculations. In a similar vein, although a strict definition of biomedical infertility focuses on conception rather than live births, our analysis focused on births due to the difficulties measuring conception; a focus on conception may produce different results. However, it is also worth noting that all extant measures are imperfect indicators of underlying ability to conceive, as evidenced, for example, by the large number of diagnosed cases of unexplained infertility. It is estimated that between 15 and 30% of clinical infertility cases are of unexplained aetiology, and approximately 50% of these conceive within 12 months of this diagnosis (Gelbaya et al., Reference Gelbaya, Potdar, Jeve and Nardo2014), suggesting that even clinical diagnosis is an imperfect indicator of ability to conceive.
Finally, it is unclear how the subjective measure of perceived difficulties conceiving may compare with other potential subjective measures. The US National Survey of Fertility Barriers, for example, includes two questions that assess self-identified infertility directly: ‘Do you think you have/have had/might have trouble getting pregnant?’ and ‘Do you think you have/have had a fertility problem?’ (Johnson & White, Reference Johnson and Whiteno date). However, there is a serious dearth of survey data that include subjective measures of infertility in any form. Much of the available data on subjective assessments of fertility status are qualitative, and consequently rely on small samples that are generally not publicly available. Future research should consider a variety of measures of perceived difficulties conceiving and self-identified infertility to assess which is most valid. In order to accomplish this, it is imperative that subjective measures of infertility be included in social surveys in sub-Saharan Africa as a complement to existing qualitative work.
In sum, there is considerable heterogeneity in how infertility is measured and defined both within and between fields, which has been further complicated in sub-Saharan Africa by the exclusion of infertility measures from survey data. There is no consensus on how best to measure infertility (Habbema et al., Reference Habbema, Collins, Leridon, Evers and Lunenfeld2004; Gnoth et al., Reference Gnoth, Godehardt, Frank-Herrmann, Friol, Tigges and Freundl2005; Gurunath et al., Reference Gurunath, Pandian, Anderson and Bhattacharya2011). Infertility is a social problem as well as biological issue, and a subjective assessment is an important but previously neglected component of its measurement. As a result, while extant demographic measures offer an elegant and well-validated means of measuring prevalence based on cross-sectional survey data, they do not necessarily represent the best possible measure for other kinds of social research. Given the dearth of direct infertility measures in most data in sub-Saharan Africa, this study has sought to identify a measure that closely matches standard objective measures, can be constructed from survey data, and, most importantly for the study’s purpose, is correlated with respondents’ own subjective assessments of their ability to conceive. Ultimately, the aim was not to definitively identify the best possible measure of infertility. Rather, the study sought to identify the best measure given current data constraints and, importantly, to suggest that the social components of infertility need to be considered in its measurement. Additionally, there should be widespread inclusion of subjective measures in survey data, and there is an urgent need for further development of subjective measures. Much work remains to be done on this important topic, but this work will be aided considerably by the inclusion of infertility measures in survey data.
Acknowledgments
Thanks are due to Drs Jenny Trinitapoli, Leif Jensen and Alan Booth, who provided invaluable feedback on previous drafts of the manuscript. The authors also wish to thank Dr John Casterline, the Population Council of New York, and the University of Cape Coast for providing the data permissions and support. The project was supported by awards to the Policy Research Division of the Population Council (New York) from the National Institute of Child Health and Development (R01–HD34524), the Mellon Foundation and the Hewlett Foundation. Support from the Rockefeller Foundation was provided via an award to the University of Cape Coast. There are no conflicts of interest to disclose.