Introduction
It has been hypothesized that body height (stature) is highly influenced by socioeconomic factors such as education and income level (Silventoinen, Reference Silventoinen2003; Gyenis & Joubert, Reference Gyenis and Joubert2004; Arcaleni, Reference Arcaleni2006; Baynouna et al., Reference Baynouna, Revel, Nagelkerke, Jaber, Omar and Ahmed2009; Bielecki et al., Reference Bielecki, Haas and Hulanicka2012; Som et al., Reference Som, Ulijaszek, Pal, Bharati and Bharati2014; Selita & Kovas, Reference Selita and Kovas2019). Body height has increased in many modern countries, particularly since the mid-20th century (Hermanussen et al., Reference Hermanussen, Scheffler, Groth and Aßmann2015). Better living conditions can increase a population’s anthropometric dimensions, such as height (Fredriks et al., Reference Fredriks, van Buuren, Burgmeijer, Meulmeester, Beuker and Brugman2000; Silventoinen, Reference Silventoinen2003; Matton et al., Reference Matton, Duvigneaud, Wijndaele, Philippaerts, Duquet and Beunen2007; Hanson et al., Reference Hanson, Sperling, Gard, Ipsen and Olivares Vergara2009; Schwekendiek & Jun, Reference Schwekendiek and Jun2010; Bubaš et al., Reference Bubaš, Milošević, Delić-Brkljačić and Zahariev-Vukšinić2012; Tomkinson et al., Reference Tomkinson, Daniell, Fulton and Furnell2017). On the other hand, scarcity and suffering experienced during childhood can decrease final adult height, highlighting inequalities within a given population (Cole, Reference Cole2000, Reference Cole2003; Hanson et al., Reference Hanson, Sperling, Gard, Ipsen and Olivares Vergara2009). Thus, height can be used as an indicator of well-being (Tanner, Reference Tanner and Demirjian1986). These positive and negative secular trends in height show that human growth usually is a complex phenomenon with both genetic and environmental causes, especially since growth is considered to be accumulated during the first 2 years of an individual`s life (Tanner, Reference Tanner and Demirjian1986, Reference Tanner1992; Cole, Reference Cole2000, Reference Cole2003).
Anthropometric dimensions change with time in adult populations. Although body height is a highly relevant and widely used anthropometric dimension, its measurements may not be accurate, mainly because of subject ‘dependability’: the variation due to physiological factors (Ulijaszek & Kerr, Reference Ulijaszek and Kerr1999; Sicotte et al., Reference Sicotte, Ledoux, Zunzunegui, Ag Aboubacrine and Nguyen2010). An example of dependability is the variation of height in the same subject at different times of the day, for, regardless of how it’s measured, height decreases throughout the day and can show a reduction of 1.4 cm (Tillmann & Clayton, Reference Tillmann and Clayton2001). Additionally, it is known that as people age they have a tendency to shrink (Sorkin et al., Reference Sorkin, Muller and Andres1999). The osteo-degenerative changes in trunk dimensions associated with ageing, as reflected in trunk and body heights, have been called ‘unreliable indicators of life-accumulated growth’ (Stewart et al., Reference Stewart, Hardy and Richards2015). Therefore, body height might be better complemented with the dimensions of other body segments, such as the lower leg (popliteal height), which express growth more accurately since they do not seem to be affected by age (Tanner et al., Reference Tanner, Hayashi, Preece and Cameron1982; Bogin & Varela-Silva, Reference Bogin and Varela-Silva2010; Fernihough & McGovern, Reference Fernihough and McGovern2015). Popliteal height is defined as the vertical distance from the floor or footrest to the posterior surface of the knee (popliteal surface) (ISO, 2008). Leg dimensions have also been used to study relationships with other variables, such as cognitive function in mid-life (Stewart et al., Reference Stewart, Hardy and Richards2015) and dementia (Prince et al., Reference Prince, Acosta, Guerra, Huang, Jimenez and Rodriguez2018), and to design school furniture for children (Castellucci et al., Reference Castellucci, Arezes and Molenbroek2015a).
Education level has been shown to be highly associated with body height in several populations (Gyenis & Joubert, Reference Gyenis and Joubert2004; Arcaleni, Reference Arcaleni2006; Komlos & Lauderdale, Reference Komlos and Lauderdale2007; Baynouna et al., Reference Baynouna, Revel, Nagelkerke, Jaber, Omar and Ahmed2009; Bielecki et al., Reference Bielecki, Haas and Hulanicka2012; Núñez & Pérez, Reference Núñez and Pérez2015). This is thought to be due to people with higher levels of education tending to have better financial situations. In the case of Chile, since the 1990s, after democratization, several public policies have been put in place to improve the living conditions of the population. The CASEN surveys have been conducted in Chile with a consistent methodology every two or three years since 1990 to assess several aspects of welfare in Chilean society, including access to education. One major policy has been to extend access to higher education (both technical and university education). According to Espinoza and González (Reference Espinoza Díaz and González Fiegehen2007), who analysed higher education access data from 1990, 1993 and 2003 by household occupation (non-manual work, manual work, agriculture) using CIUO 88 following Erikson and Goldthorpe (Reference Erikson and Goldthorpe1993), there has been progressively increased access to higher education for students from homes where the primary income is manual work: from 12.2% in 1990, to 31.1% in 1993 and 33.3% in 2003.
In 2016, an anthropometric survey with an ergonomic purpose and design was conducted among Chilean male workers. In light of Chile’s particular geographical characteristics, it was conducted in the two most populated regions. Subjects’ age, height, popliteal height and highest educational attained level were obtained. The objective of the present study was to investigate differences in total body height and popliteal height in a cohort of male workers born in Chile between 1966 and 1996 in relation to their attained educational levels.
Methods
Study area and sample selection
Data were taken from a 2016 anthropometric survey of Chilean male workers performed for ergonomic purposes. The target population comprised adult male workers assigned to the second-largest workers’ compensation company in Chile. The sample was selected from the two most populated regions of Chile – the Valparaíso and Metropolitan regions – mainly because of geographic constraints, since Chile is 4000 km long. The workers were employed in nine branches of economic activity (agriculture and fishing, mining, manufacturing, electricity, construction, commerce, transport and communications, financial services, and communal and personal services).
For each region, a stratified sampling plan using clustering was carried out by economic activity. For this investigation, each cluster corresponded to a group of 20 workers. To calculate the number of clusters in the sample significance was taken at p < 0.5, which corresponds to the proportion of workers with anthropometric measures outside the usual ranges, as this proportion gives the maximum sample size or number of clusters to be selected from the population in each region. The estimated error was set at 0.04. To determine the number of clusters in the sample for each region, data on the average monthly number of workers assigned to the workers’ compensation company and weighting by economic activity were used. Although the number of clusters per region was in accordance with the established sampling plan, for the Metropolitan Region it was decided to double the number of clusters in the sample due to the great number of workers in this region. For purposes of approximation, in all cases the number of clusters was rounded upward. Finally, data were collected on 1404 Chilean male workers aged between 21 and 50.
Data collection
Subjects were measured in the workers’ compensation company facility when they attended their annual health check-up. The data collection process was approved by the Committee of Ethics at the Chilean Construction Chamber (Camara Chilena de la Construcción). Written consent was obtained from the workers before starting the measurement procedures. Direct measurements from each subject were made of 29 anthropometric dimensions, including body height and popliteal height. Popliteal height was measured with the subject sitting with 90° knee flexion, and defined as the ‘vertical distance from the floor or footrest to the posterior surface of the knee’ (popliteal surface).
Great care was taken to use correct measurement techniques to obtain accurate anthropometric measurements, according to ISO 7250-1 standards (ISO, 2008). All subjects were measured from the right side while lightly clothed and without shoes. The measurement process was carried out by six physiotherapists divided into two teams. Before starting the survey, they went through training sessions (theory and practice) and spent a considerable amount of time practising the measurements to achieve high consistency between measurers. At the end of the training sessions, a pilot study was developed with a sample of 25 volunteers who were measured twice by the two teams, and both inter- and intra-measurer reliability were assessed using the Intraclass Correlation Coefficient (ICC) two-way mixed and absolute agreement models. Correlations were interpreted according to the ranges suggested by Portney and Watkins (Reference Portney and Watkins2008): ICC ≥0.50 was interpreted as moderate and ICC ≥0.75 was interpreted as strong. The results showed that the measures had strong inter- and intra-reliability values for body height and popliteal height.
Subjects’ age was confirmed by their personal identification documents and classified in three cohorts: 21–30 (born 1986–1995), 31–40 (born 1976–1985) and 41–50 (born 1966–1975).
The subjects were not classified by ethnicity, as a previous study by Chilegenomico (2015), the first and only genetic study conducted in Chile, found no ethnic differences among 3200 Chileans from eight cities across the north, centre and south of the country. Genetically, Chileans are 51% European, 44% Amerindian and 3% African. The sample only included workers born in Chile. Data collection, in 2016, occurred before Chile received a large number of migrants from Haiti, who are mainly of African ethnicity (Rojas & Silva, Reference Rojas and Silva2016). According to an El Mercurio Newspaper article dated 10th April 2018, during 2017 a migration peak occurred, specifically from Haiti, when 100,000 Haitian migrants entered the country with a tourist visa; however, 98% of them changed their visa status to a work visa or temporary visa.
The participants were also asked about their level of education, and this was classified into ‘primary’, ‘secondary’, ‘technical’ or ‘university’ education. A similar approach has been used in other studies to establish a socioeconomic proxy for educational level (Komlos & Lauderdale, Reference Komlos and Lauderdale2007). Details of the final sample composition are given in Table 1.
Table 1. Sample of Chilean male workers by age cohort and educational level

Statistical analysis
The statistical software R was used to perform descriptive statistics and hypothesis testing. Means and standard deviations for the age and education variables (and their established levels) were computed. After a homoscedasticity rejection with the Bartlett test (p > 0.05), robust ANOVAs and post-hoc analyses using one-step-modified M-estimation of location were conducted based on bootstrap resampling (n = 5000) (Mair & Wilcox, Reference Mair and Wilcox2019). Absolute and relative differences between the samples were calculated, with changes expressed in percentages and in absolute values (in mm).
Results
Table 2 shows the average (±SD) age, body height and popliteal height of the sample workers by educational level. Those in the 21–30 cohort were taller than those in the 31–40 cohort, who in turn were taller than those in the 41–50 cohort. However, when examined by each educational level, there was a height difference between cohorts only in those with primary and secondary education. In other words, the body height of workers with only primary and secondary education decreased by age group (older workers were shorter) but increased from primary to secondary education level; that is, workers with secondary education were taller than those with only primary education. This did not hold, however, for technical- and university-educated workers.
Table 2. Body height and popliteal height of Chilean male workers by age cohort and education level

Table 2 shows that the average body height of 21–30 technical-educated workers was less than that of both 31–40 and 41–50 technical-educated workers. Also, the average body height of 21–30 university-educated workers was less than that of 31–40 workers in the same category, but greater than in those aged 41–50. Conversely, popliteal height showed a stable increase in all categories independent of educational level.
Table 3 shows the absolute and relative body height and popliteal height differences between sample age cohorts by educational level. An overall increasing trend in both body height and popliteal height can be seen. This trend was more explicit and statistically significant when comparing body height and popliteal height for 21–30 and 41–50 workers. When including educational level, the differences were statistically significant only when comparing the heights of 21–30 and 41–50 workers with secondary education, and the popliteal height of 21–30 and 41–50 workers with primary and secondary education. Despite not being always statically significant, there was a continuous increase in the dimensions of the younger (21–30) and older workers (41–50) with primary and secondary education. This effect weakened when comparing younger workers with technical and university education, even reversing in some cases.
Table 3. Differences in mean body height (cm) and mean popliteal height (mm) of Chilean male workers by age cohort and educational level

*p < 0.1; **p < 0.05; ***p < 0.01.
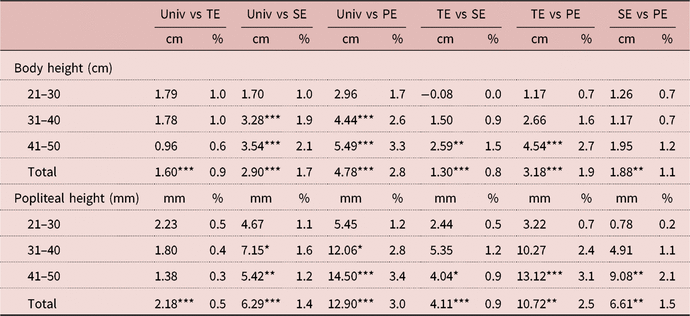
Table 4 shows comparisons of body height and popliteal height by age cohort and educational level. The analysis of total increase in heights by educational level showed statistically significant differences. The largest differences in total average body height were in workers who attended university versus those with only primary education (2.8%), followed by workers with technical education versus those with primary education only (1.9%), and workers with university education versus secondary education (1.7%). Popliteal height followed the same trends as in the previously mentioned categories, with differences of 3.0%, 2.5% and 1.4%, respectively.
Table 4. Differences in mean body height (cm) and mean popliteal height (mm) of Chilean workers by age cohort and educational level

*p < 0.1; **p < 0.05; ***p < 0.01.
TE, technical education; Univ, university education; SE, secondary education; PE, primary education.
Table 4 also shows that the younger and more highly educated the workers, the fewer significant differences there were in body height and popliteal height, similar to what was observed in Table 3. For example, one of the largest differences in the percentage of body height (3.3%) and popliteal height (3.4%) was observed in the 41–50 cohort, when comparing university-educated workers with those with only primary education. On the other hand, Table 4 shows that there were no statistically significant differences within the 21–30 cohort by educational level for either body height or popliteal height. There were fewer significant differences in the 31–40 cohort when comparing workers with technical education versus primary and secondary-educated workers or secondary versus primary-educated workers. As for university- versus technical-educated workers, there were no significant differences in any of the age cohorts.
When comparing the workers by age groups and educational level, the differences were significant for body height for the 21–30 versus 41–50 workers with secondary education. The same held true for popliteal height for 21–30 versus 41–50 workers with both primary and secondary education. The differences, however, were progressively smaller when comparing younger workers with higher education. For example, body height showed differences of 2.93 cm and 2.23 cm (p < 0.01) between 41–50 and 21–30 workers with primary and secondary education, respectively, while the same comparison between 41–50 and 31–40 workers yielded 2.03 cm and 1.24 cm, respectively. The same comparison of body height showed much greater discrete differences, and even negative results, when making comparisons between younger educated workers. Comparing the body heights of workers aged 31–40 and 21–30, the differences were 0.90 cm and 0.99 cm in those with primary and secondary education, respectively, and −0.6 cm and −0.58 cm for those with technical and university education levels, respectively. Popliteal height behaved similarly, but the differences appeared more clearly in the same comparisons, where 41–50 versus 21–30 workers with primary education showed differences of 14.58 cm (p < 0.01) and 6.28 cm (p < 0.01) in workers in the same age ranges with secondary education. In primary and secondary-educated workers, popliteal height differences between workers aged 41–50 and 31–40 were 7.07 cm and 2.91 cm, respectively, and the differences in the 31–40 versus 21–30 cohort were 7.51 cm and 3.38 cm, respectively.
Discussion
Effect of improvements in living conditions in Chile
The socioeconomic background of these Chilean workers seems to have influenced the observed secular trend in body and popliteal heights, particularly when comparing workers with primary and secondary education. Both body height and popliteal height increased from the older to the younger age cohort, but when considering educational level, in primary and secondary- educated workers, a significant increase in both variables was observed for each cohort. Despite showing an overall increase in body height and popliteal height, younger workers with the highest levels of education showed fewer differences between them than did older workers with less education People who experience less-favourable situations frequently achieve a greater increase in their quality of life, even with only small improvements (Hoddinott & Wiesmann, Reference Hoddinott, Wiesmann, Adato and Hoddinott2010), which could explain the fact that the secular trend was more evident with each successive cohort in workers with primary and secondary education, but not in more highly educated workers. Generally, disadvantaged people tend to have lower levels of education (Singh-Manoux et al., Reference Singh-Manoux, Gourmelen, Ferrie, Silventoinen, Guéguen and Stringhini2010; Huang et al., Reference Huang, Van Poppel and Lumey2015), which can serve as a proxy for socioeconomic status, explaining why the secular trend was evident only in workers with primary and secondary education. Chilean children and adolescents have shown a positive secular trend in growth over the last 30 years (Valenzuela & Avendaño, Reference Valenzuela and Avendaño1979; Argote & Portales, Reference Argote and Portales1992; Gutiérrez & Apud, Reference Gutiérrez and Apud1992; Burrows et al., Reference Burrows, Ceballos, Burgueño and Muzzo2010; Castellucci et al., Reference Castellucci, Arezes, Molenbroek and Viviani2015b; Núñez & Pérez, Reference Núñez and Pérez2015); thus, it is possible that these increases contributed to the overall (total) average body height increase. Since the 1960s, Chile has experienced almost constant improvements in its Gross Domestic Product (GDP) per capita (World Bank, 2018) and a constant decrease in child mortality, decreasing from 120 deaths per 1000 births/year in 1960 to 7.4 deaths per 1000 births/year in 2010 (Deis-Minsal, 2014) – both being indicators of the country’s improved living conditions. According to the Food and Agriculture Organization of the United Nations 1990–2016 (FAOSTAT, 2018), Chile has experienced a decrease in undernourishment, with a transition from health problems related to child undernutrition towards the chronic non-transmissible illnesses associated with obesity, similar to what has been happening in developed countries and economies (Muzzo et al., Reference Muzzo, Burrows and Cordero2004; Kagawa et al., Reference Kagawa, Fernald and Behrman2016).
The better living conditions experienced in Chile over recent decades have no doubt positively influenced the secular growth of the workers in this study, since they have increased well-being, health and overall growth (Tanner, Reference Tanner1992; Bogin, Reference Bogin2001; Cole, Reference Cole2003).
Effect of opening up of higher education in Chile
The second and most likely explanation for the observed changes in height and popliteal height of the studied cohorts, is the opening up of higher education to students of lower socioeconomic status in Chile over recent decades. Access to higher education in Chile has increased since 1990 (Espinoza Díaz & González Fiegehen, Reference Espinoza Díaz and González Fiegehen2007; Rolando et al., Reference Rolando, Salamanca and Rubilar2010; Arzola, Reference Arzola2011). An indicator used by the Chilean Government to assess higher education participation is the Net Assistance Rate, defined as the total population aged 18–24 years that entered higher education divided by the total population aged 18–24 years (Ministerio de Desarollo Social, 2016). When access to higher education is analysed by income quintile, historically since 1990 the fifth (richest) quintile has continued to have greater access to higher education, moving from a 33.2% Net Assistance Rate in 1990 to one of 59.0% in 2011 (MIDEPLAN, 2013), showing an increase of 77.7%. In 1990 only 4% of the population between the ages of 18 and 24 years from the first (poorest) income quintile accessed a higher education institution, and this increased to 22.1% by 2011, showing an increase of 452.5%. Therefore, the first and second income quintiles (two lowest) have experienced the most dramatic increase in participation in higher education over the period. Also, considering the data from Rolando et al. (Reference Rolando, Salamanca and Rubilar2010) and Arzola (Reference Arzola2011), Figure 1 shows that in 1990 only 5.3% of students between the ages of 18 and 24 years in the first (poorest) quintile were enrolled in higher education, while in 2011 this increased to 12.8%. Conversely, in 1990, 39.2% belonged to the fifth quintile, falling to 26.8% in 2011, clearly showing increased access to higher education for the lower economic segments of the population.

Figure 1. Percentage of students with higher education by income quintile (Q1–Q5, where QI is poorest and Q5 is richest) using data from Arzola (Reference Arzola2011) and Rolando et al. (Reference Rolando, Salamanca and Rubilar2010).
It is worth mentioning that, in accordance with the traditional Chilean school year, workers with higher education (technical and university) most likely attended higher education between the following intervals: the 21–30 cohort attended higher education between 2004 and 2013, the 31–40 cohort between 1994 and 2003, and the 41–50 cohort between 1984 and 1993. The increase in the participation of the lower income quintiles with time for the selected years is illustrated in Figure 1. This increased participation may explain the lack of significant differences observed in the more educated and younger workers of the current study, where the 21–30 workers with higher education showed a much more diluted distribution of height and popliteal height, which is likely to be associated with greater access to higher education for lower income quintiles. Public policies, such as higher education scholarships and state-endorsed student loans, have made a significant contribution since they are intended to provide greater access to higher education for students of lower socioeconomic levels (OECD, 2004, 2009; Benavente & Alvarez, Reference Benavente and Alvarez2012; MIDEPLAN, 2013). It is estimated that between 1991 and 2000, public spending in Chile on higher education increase by 74% in real terms (OECD, 2004). Also, since 1990, regulatory changes made possible a significant increase in the number of private higher education institutions, whose student enrolment has increased 10 times, many of them coming from lower socioeconomic backgrounds (Ministerio de Desarollo Social, 2016). According to the 2015 CASEN survey, 49.8% of the first quintile and 49.3% of the second quintile students between 18 and 24 years old had some type of direct scholarship that helped to pay for higher education tuition (Ministerio de Desarollo Social, 2016). The CASEN 2015 survey also showed that 44.9% and 39.6% students between 18 and 24 years old from the first and second quintiles, respectively, had student loan credits endorsed by the Chilean state or direct student loans from the Chilean state. The combination of state-endorsed loans and scholarships and access to more private universities is a very likely explanation for the increase in higher education access, especially for the lower income quintiles (OECD, 2009).
When analysing the differences in average height and popliteal height found in each cohort, popliteal height indicates more accurately than body height the social or environmental factors experienced by subjects, especially during early childhood or adolescence, as has been suggested by previous research (Vázquez-Vásquez et al., Reference Vázquez-Vázquez, Azcorra, Falfán and Dickinson2013). Further studies could perform an in-depth analysis of these anthropometric variables to complement height, to obtain an authentic anthropometric variable more sensitive to environmental/societal factors
Similar findings in other populations
The differences in body height found in the current study are very similar magnitude to those found by other studies. For example, Huang et al. (Reference Huang, Van Poppel and Lumey2015) found a positive relationship between height and educational level among Dutch male conscripts, with differences varying monotonically over a 5.1 cm range between the conscripts with the highest and lowest education, whereas in the current study the difference between workers with university education and primary education was 4.78 cm (p < 0.01). The study by Meyer and Selmer (Reference Meyer and Selmer1999) in Norwegian males and females born in 1926 and 1941 found more moderate differences in height than the current study, with a difference of 3.3 cm in males with the highest and lowest level of education. As in the current study, both of these studies found that the younger the birth cohort, the less notable the difference in height. This may be attributed to constant improvements in the welfare state and social policies impacting the subjects’ childhood during the period under study. Smaller differences in the height of younger cohorts have also been observed in male Polish conscripts born between 1957 and 1967 (Bielicki et al., Reference Bielicki, Malina and Waliszko1992) and in Swedish men (Magnusson et al., Reference Magnusson, Rasmussen and Gyllensten2006), even after controlling for other socioeconomic variables. These findings could point to a likely explanation of why in the current study the differences in the younger cohorts were less pronounced, especially in the case of Chile, with a mixture of improvements in living conditions and the opening up of higher education.
The current study suggests that body height changes might be associated with the opening up of higher education to lower income quintiles. According to Komlos and Lauderdale (Reference Komlos and Lauderdale2007), when there is greater social mobility, there is less of an association between adult income or education and body height, even when comparing data across generations. This might well be an explanation of the results of this study. Another study (Komlos & Baur, Reference Komlos and Baur2004) found that stature increased in US adults with each higher educational level reached, contrary to the findings of this study, which mainly reflects the nature of the US higher education system, where access requires a certain socioeconomic status or debt capacity, since it is one of the most expensive in the world. In fact, it would be interesting to analyse this trend with a larger sample a decade from now, as recently the Chilean government has established a programme to offer free higher education to all students in the lowest 60% income levels.
The Chilean school system reflects inequalities more clearly through body height and popliteal height
Contrary to body height in tertiary education, schools are one area in Chile where body height and other anthropometric dimensions such as popliteal height are more closely related to social inequalities. There are marked anthropometric differences among low-, middle- and upper-income school children, which are reflected in the three types of schools (public, endorsed, and private) (Castellucci et al., Reference Castellucci, Arezes, Molenbroek and Viviani2015b), mainly because of a clear quality gap among these educational levels, which makes for distinct social and anthropometric differentiation, where taller children attend private schools and shorter children attend public schools (Castellucci et al., Reference Castellucci, Arezes, Molenbroek and Viviani2015b, Reference Castellucci, Catalán, Arezes and Molenbroek2016).
Study strengths and limitations
The study has its limitations. First, neither the height nor the educational level of the subjects’ parents was documented, which could have more precisely defined their socioeconomic levels. Second, the sample size could have been larger and included more regions of Chile. Broadly speaking, more detailed anthropometric surveys require more resources and time; thus, in developing countries such as Chile, it presents an additional challenge, especially considering Chile’s particular geographical characteristics – its length of 4000 km, which is equal to nearly the entire expanse of Europe – where the costs of implementing a nationwide anthropometric survey would be very high. Despite that, the study sample was representative of the two most populated regions of Chile, Valparaíso and Metropolitana, where more than 50% of the population lives. Further studies should use a larger sample and account for parental height or education before generalizing to the entire Chilean male working population.
The strengths of this study were the directly measured anthropometric dimensions. It is well known that the bias of self-reported height and weight can affect the overall perception of a population’s health (Shiely et al., Reference Shiely, Hayes, Perry and Kelleher2013). Also, a standardized procedure was followed throughout data collection and, furthermore, the people performing the measurements were tested according to their intra- and inter-reliability, which additionally reduced the possibility for error. It would be interesting to account for any relationships between body height and popliteal height with educational level, especially 10 years from now, since a recently approved law stipulates that higher education should be free for the first six income deciles.
Conclusions
A clear secular increase in body height and popliteal height was observed among Chilean male workers across all age cohorts. The overall secular increase can be attributed to improvement of living conditions in Chilean society, especially in younger workers, who have experienced the more recent benefits of improvements in Chilean society. However, when analysing the sample by educational level and age, the trends were only well-defined for workers with primary and secondary education in all age groups. The trend was increasingly diluted when looking at each successive younger and more highly educated group of workers. This finding probably has to do with the opening up of access to higher education since 1990, contributing to the dilution effect in height and popliteal height in the more educated and younger workers. The findings of this study could indicate that in the case of Chile, educational level may no longer be associated with height or socioeconomic situation in adults with technical or university education, and thus other variables should be included to establish the socioeconomic background of subjects, not only educational level.
Acknowledgments
The authors wish to thank all the participating workers, as well as the seven physiotherapists for their collaboration in the measurements process (Gonzalo Bravo, Agustina Cárdenas, Felipe Llanca, Ítalo Mercurino, Soraya Sabaj, Álvaro Villanueva, Romina Zamorano).
Funding
This work was supported by the ‘Mutual de Seguridad C.Ch.C’ with funding from ‘Proyectos de Investigación e Innovación SUSESO’ in ‘Trabajo fue seleccionado en la Convocatoria de Proyectos de Investigación e Innovación de Prevención de Accidentes y Enfermedades Profesionales “2015” de la Superintendencia de Seguridad Social (Chile)’. It was also financed by ‘Mutual de la C.Ch.C with the resources of Seguro Social de la Ley No. 16.744 de Accidentes del Trabajo y Enfermedades Profesionales’.
Conflict of Interests
The authors have no conflicts of interest to declare.
Ethical Approval
The data collection process was approved by the 2015 Committee of Ethics at the Chilean Construction Chamber (Camara Chilena de la Construcción). The authors assert that all procedures contributing to this work comply with the ethical standards of the relevant national and institutional committees on human experimentation and with the Helsinki Declaration of 1975, as revised in 2008.