


Introduction
Migration has been a characteristic of humans since they emerged in Africa. Modernization and globalization ease migration through better information and transport facilities. The development of a global modern culture, including technological, political and cultural modernity and the weakening of formerly nearly impregnable boundaries between countries, make it easier for people to move from one country to another, crossing political systems, languages and cultures (Goldin et al., Reference Goldin, Cameron and Balarajan2012). The world's economic hot spots such as California, the Gulf region and Singapore depend on the immigration of well educated, highly skilled workers. Rich countries with high income levels also need cheap and motivated workers for everyday services in agriculture, factories, households and nursing. Additionally, there are push-factors: despotic systems, suppression, wars, famines and poverty provoke mass migrations of peoples. Plain wealth differentials will continue to stimulate migration. This has all led, and will lead in the future, to increasing emigration (International Organization for Migration, 2011).
‘Natives’ and ‘immigrants’, people without or with ‘migrant background’, and people who have lived in a country for many generations versus more recent arrivals, may differ in important aspects. Firstly, by definition, they differ by country of birth, of themselves or of their ancestors. Secondly, they frequently differ by citizenship. Thirdly, they usually differ by ethnic origin, but here a clear distinction is not always possible: do British, Canadian, Australian and New Zealand people belong to one or different peoples? At least there are gradual differences: German and Austrian, British and Australian, British and American, or Spanish and Mexican peoples are closer related than Japan and Thai, or French and British people. Fourthly, they usually differ by language. Fifthly, there are correlated distinctions, such as in appearance (biologically or culturally determined), evolutionary background (as marked by haplogroups or by sub-specific categorizations such as ‘races’, ‘ancestries’ or ‘genetic clusters’), eating habits, religion, culture, history, formal rights and legal status, reputation and wealth. Sixthly, they differ in accumulated experiences, connections and loyalties that come from settled habitation. Seventhly, and probably for the development of societies and economics most important, they frequently differ by the average level of education, cognitive ability and human capital (te Nijenhuis et al., Reference te Nijenhuis, de Jong, Evers and van der Flier2004). Because of this, ‘immigrants’ are a highly heterogeneous group with little in common beyond moving country.
Continuing immigration will lead to an ethnic and cultural transformation of nations (Coleman, Reference Coleman2006, Reference Coleman2010). This is especially true for countries with below-replacement fertility. The quantity of migration, the described differences, but also fears and real problems – of the burden on social security, of criminality, of cultural alienation and loss of identity – have provoked sometimes hidden, sometimes openly articulated concerns and sometimes even riots (e.g. in Germany since the nineties assaults on immigrants including homicides; Deutsche Bundesregierung, 2009). On the other hand, immigrants in the UK, Sweden, Denmark and France have participated in civil disturbances. Crime rates rise with increasing immigrant proportions (Ellis et al., Reference Ellis, Beaver and Wright2009, p. 29ff.), especially by immigrants of certain ability and cultural backgrounds (Kirkegaard, Reference Kirkegaard2014). Diversity could have a negative impact on social cohesion, trust and solidarity; all of these are not only indicators of a society's well-being, but also positive economic factors (Easterly & Levine, Reference Easterly and Levine1997; Putnam, Reference Putnam2007). Competence differentials lead to differences in educational qualifications, in success in the job market and in status, in place of residence and wealth, in health behaviour and longevity, in law-abidingness and criminality, and in political and cultural orientations.
Aside from causing or not causing tensions, in the long term competence levels of quantitatively significant subgroups will affect societies' average competence level. In countries with high cognitive human capital, replacement migration from countries with higher fertility and lower human capital may lead to a negative competence trend. However, modern economies increasingly depend on cognitive competence, the decisive characteristic of human capital (e.g. Rindermann & Thompson, Reference Rindermann and Thompson2011; Rindermann, Reference Rindermann2012). Cognitive competence comprises intelligence (the ability to think), knowledge (true and important knowledge) and its smart use. The term ‘competence’ is equivalent to ‘ability’. Student assessment tests measure this competence (e.g. Rindermann & Thompson, Reference Rindermann and Thompson2013).
Some countries benefit from an importation of highly skilled human capital, for instance Canada, Switzerland and the US (e.g. Müller-Jentsch, Reference Müller-Jentsch2008; Wadhwa, Reference Wadhwa2012). Direct effects include the output of immigrants, and indirect effects the stimulation of natives' own output (Moser et al., Reference Moser, Voena and Waldinger2014). Other countries profit less, especially if immigrants show lower human capital levels than natives. This has raised some doubts concerning the further mean cognitive competence development of such nations (Richwine, Reference Richwine2009; Nyborg, Reference Nyborg2012).
The international student assessment studies measure human capital in the form of students' cognitive competences. The PISA, TIMSS and PIRLS studies (acronyms are explained in the Methods section) measure proficiency in reading, mathematics and science. They also document the migration background of students.
At first sight there are small-to-large native–immigrant gaps and noteworthy differences between countries: e.g. in PISA 2009 (OECD, 2010, Table II.4.1, p. 170) in Finland natives achieved 538 student assessment scale (SAS) points in reading (international developed countries' mean M=500; standard deviation SD=100), but second-generation immigrants had an SAS of 493 and first-generation immigrants only 449, a difference of 89 SAS points and equivalent to around 2–3 school years of progress (Rindermann, Reference Rindermann2011). In contrast, in Dubai (UAE) natives achieved clearly lower results compared with immigrants (natives: SAS=395; first-generation immigrants: SAS=467; second-generation immigrants: SAS=503). These are more than 100 SAS or 16 IQ points or around 3–5 years schooling effects!
There seem to be rather unsystematic achievement differences between various scales (e.g. reading vs mathematics). However, there are systematic native–immigrant percentage differences according to the year of survey and the study approach. First, in the majority of countries there are, with time, increasing immigrant proportions. Second, studies organized by the IEA, TIMSS and PIRLS, use a wider definition of being a migrant: students with one immigrant parent and one native parent are categorized as having an immigrant background, whereas in the OECD-organized PISA they are categorized as native students. Consequently, in TIMSS and PIRLS more students are classified as immigrants and the gaps between natives and immigrants are smaller.
Research questions and own approach
How large are the native–immigrant differences?
To answer this the data from different studies have to be averaged. Because of systematic differences in immigrant definition, increasing numbers of immigrants and several anomalies in reported results, the data have to be re-scaled.
Could differences in national education policies explain immigrant–native differences in ability? Such knowledge could be used to improve educational policies. Before that, alternative hypotheses such as specific language problems (e.g. leading to problems in understanding instruction at school) and acculturation should be tested. It is assumed that the command of the language used for instruction, acculturation and educational quality have a narrowing impact on native–immigrant gaps.
This approach complements the study by Levels et al. (Reference Levels, Dronkers and Kraaykamp2008), who analysed students' results from the PISA 2003 survey from 35 origin countries in thirteen Western countries (around N=7500). The immigrant results roughly corresponded to the average results of their countries of origin (e.g. Turkish emigrants had mathematics scores of SAS=447, which corresponded to the SAS=423 of Turks in Turkey, whereas the Dutch emigrant result of SAS=521 corresponded to the SAS=538 of the Dutch in the Netherlands; see also Carabaña, Reference Carabaña, Pereyra, Kotthoff and Cowen2011; Kirkegaard, Reference Kirkegaard2013). On the other hand, there are remarkable differences within immigrants from one country of origin in different countries of destination. For example students with a Turkish background achieved much better results in the Netherlands (SAS=484) than in Germany (SAS=413) or Denmark (SAS=424). The pattern was roughly repeated in analyses of PISA 2006 reading results (Dronkers et al., Reference Dronkers, Velden and Dunne2012; see also Schnepf, Reference Schnepf2007).
Are there any educational factors responsible for different achievement levels of immigrants?
Factors like stratification of the educational system and discrimination or specific language problems (e.g. OECD, 2006) have been discussed. But empirical research has shown that the majority of the assumed factors are not relevant, e.g. stratification effects depend on immigrant characteristics (Dronkers et al., Reference Dronkers, Velden and Dunne2012). There are weak or no signs of negative discrimination within the educational system. For example, in German-speaking countries, after controlling for individual competences, immigrant students have the same chance of attending selective schools (Tiedemann & Billmann-Mahecha, Reference Tiedemann and Billmann-Mahecha2007); or taking grades into account, immigrants have an even higher chance of attending the selective Gymnasium than native students (89% vs 78%), an instance of positive discrimination (or discrimination against natives!) (Becker & Schubert, Reference Becker, Schubert and Becker2011). Language remains an important factor, but specific language proficiency is not independent from immigrant attributes such as parental education or general intelligence.
This paper adds the perspective of integrating ten data sets of different student assessment approaches from 1995 to 2012 with a focus on country differences across 93 nations. First, across different studies, the sum values of natives' and immigrants' competences, their current student population proportions and their past development of proportion of the student population in one decade are calculated. Second, hypotheses that try to explain native–immigrant differences are tested:
-
1. Specific language problems.
-
2. Acculturation.
-
3. Quality of educational system of a host country.
Finally, the student assessment results are compared with a single adult study (PIAAC) and long-term economic effects are estimated.
Methods
Publically available data documented in reports at the country level were used. All sources and transformations are described in detail in a supplementary online file. Here a brief summary is given.
Cognitive competence measures and percentages
Data
PISA (Programme for International Student Assessment) measures competences in reading, mathematics and science for 15-year-old students. The surveys are repeated every 3 years (2000ff.). The survey is organized by the OECD (Organisation for Economic Co-operation and Development). The results for natives (born in country of assessment with at least one parent born in the same country) and immigrants (first-generation or second-generation immigrant students, non-native students) are given from PISA 2000, 2003, 2006, 2009 and 2012.
TIMSS (Trends in International Mathematics and Science Study) measures competences in mathematics and science for fourth and eighth graders. The surveys are repeated every 4 years (1995ff.). The survey is organized by the IEA (International Association for the Evaluation of Educational Achievement). The results for natives (both parents born in country) and immigrants (one parent born in country, neither parent born in country) are given from TIMSS 1995 and 2007 (2007 fourth and eighth grade).
PIRLS (Progress in International Reading Literacy Study) measures competence in reading for fourth graders. The surveys, organized by the IEA, are repeated every 5 years (2001ff). TIMSS and PIRLS use the same system of categorization of natives and immigrants. The results are given from PIRLS 2001 and 2006.
PIAAC (Programme for the International Assessment of Adult Competencies) measures competences in reading, mathematics and problem solving for adults aged between 16 and 65 years. The results are given from the first study in 2012. Because PIAAC is a study on adults, data were not combined with student assessment data.
Corrections
Data from countries with obviously wrong or non-representative samples were corrected. This includes Kazakhstan TIMSS 2007, China PISA 2009 and 2012 (only Shanghai) and Peru PISA 2000.
Transformations and aggregation
The results of different scales within one study and survey year were arithmetically averaged (e.g. results of mathematics and science). Next, differences were calculated, a) between natives' and immigrants' means, b) between natives' and countries' means, and c) between immigrants' and countries' means. After that, within PISA, TIMSS or PIRLS the differences were aggregated across different survey years. Because general means and standard deviations vary with survey year, the three native–mean immigrant differences were standardized oriented on the newest and largest sample. Newer data were more strongly weighted. In the next step the two IEA approaches TIMSS and PIRLS with identical migration definitions were combined. Finally, the data from PISA (N C=70) and TIMSS–PIRLS (N C=66) were combined, using for standardization their general mean and standard deviation (r=0.87, Cronbach's α=0.93). The means for the three differences are given for N C=93 countries.
Anomalies in data and corrections
In all studies and for nearly all countries the competences of natives and immigrants multiplied with their percentages did not result in the exact country mean (for examples, see Supplement). There has to be, and there is, a missing value group: the group of students not giving information on their parents' origin. For this group results are not presented in the SAS reports. This makes the native, immigrant and country mean competence and percentage estimates mathematically contradictory. Therefore the differences were corrected, step-by-step, for (first) percentages and (second) means leading at the end to mathematically correct and (as assumed) empirically more veridical results (N C=93).
Estimations for countries without information on immigrants (but for natives)
For seven countries only competences (and percentages) of natives were presented: China (Shanghai), Japan, Korea (South), Malaysia, Rumania, Uruguay and Vietnam. For these countries the migrants' competence values were estimated by using the studies' country and natives mean and the natives' and reported (or indirectly calculated) migrants' percentage.
Final natives' and migrants' estimates
At the end the natives' and migrants' means were calculated by using the differences from the studies' calculated mean. As a quality indicator the numbers of studies giving information for migrants' competence levels (maximum 10) and giving information on migrant status' percentages (maximum 10) were counted. An immigration gain (gains or losses through immigration for the country competence mean) was calculated by subtracting the country competence mean from the native's mean. In countries with a longer history of immigration, immigration gains could be underestimated because ‘nativized migrants’ no longer count as migrants, but as natives (e.g. in the US third-generation Vietnamese). Results for N C=93 countries are presented in Tables 1 and 2. Results are presented in the SAS scale (Table 1, M=500, SD=100) and in the conventional IQ scale (Table 2, UK natives mean set at 100; SD=15).
Table 1. Proportions, means and differences in student assessment studies for 93 countries
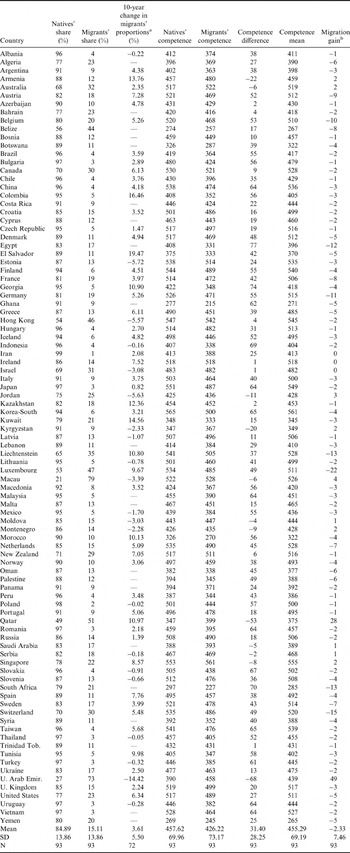
Percentages and student assessment means (in student assessment scale, SAS, with M=500 and SD=100; UK: 517); values averaged after transformations and corrections.
a Ten-year change in migrant proportions in % (e.g. 1.00 means an increase from 8 to 9% in 10 years).
b Migration gain: gains or losses through immigration for country competence mean. Values in IQ scale can be found in Table 2.
Table 2. Means and differences in IQ scale (UK natives' mean set at 100)

a Migration gain: gains or losses through immigration for country competence mean.
b Study-N mig. comp.: number of PISA, TIMSS and PIRLS samples (years and grades) with competence information about immigrants; study number ‘0.5’ only information about natives and country means, immigrant values estimated.
c Study-N nat. %: number of studies with information about proportions of natives (and indirect information about proportions of immigrants).
Ten-year development of natives' and migrants' proportions
The development of student proportions with native or immigrant background could be calculated by comparisons of different survey years within one study. If a more narrow native and a wider migrant definition would be preferred, the presented proportion development indicator would underestimate the proportions of migrants, because third-generation migrants (grandparents immigrated) are categorized as natives (see Nyborg, Reference Nyborg2012). The ‘10 years’ is the 10-year-average for the analysed period from 1995 to 2012.
Attributes of educational systems, schools and students
Data for the following variables were used in analyses: age of enrolment at school; repetition rates; attendance of high grades at a young age; discipline and regularity (school-appropriate behaviour of students); use of standardized achievement tests; use of central exams; school autonomy; school-education quality sum; identity of language spoken at home and used for test and instruction in school; educational level of adults. A detailed description can be found in an online supplement, and the data are documented in supplement Table S6.
Attributes of society
Three different indicators of general social development were used: democracy, human development index and wealth (Gross Domestic Product 2003).
Statistical analysis
Bivariate correlations were supplemented by multiple regressions including as second predictor the general competence level of a country. Regressions were done for the total sample of N C=93 nations and a selected sample of Western and European countries with an immigrant percentage of at least 5% (N C=38). Significance tests were not used for interpretation (see Online Supplement). Results at the level of countries do not necessarily correspond to results of analyses at the class or individual level (ecological fallacy). They need a careful comparison with results from within-country and multilevel analyses within single surveys. Depending on the research question differences favouring immigrants (immigrants achieved better results than natives) were also set to zero (language question, educational quality).
Native–migrant competences across counties
The proportions of natives and immigrants and the differences between them vary with approach (PISA of OECD vs TIMSS/PIRLS of IEA), year of survey and grade (indirectly standing for year). As the example of the United States demonstrates (documented in the Online Supplement, Table S1), the proportion of immigrants increases: from PISA 2000 to 2012 (from 14% to 21%); from TIMSS 4th grade 1995 to 2007 (22% to 30%); from TIMSS 8th grade 2007 to TIMSS 4th grade 2007, the estimated 2011 8th grade (26% to 30%); from PIRLS 4th grade 2001 to 2006 (32% to 34%).
The IEA studies report a larger immigrant proportion than the OECD studies (IEA studies count students with one parent born abroad and one in the host country as immigrants, whereas the OECD sees them as natives), e.g. for the US 2007/2009: 20% (PISA 2009) vs 26% (TIMSS 2007 grade 8). For all countries with results in both OECD and IEA studies (N C=51) this produces for OECD studies on average 11.24% immigrants among 2012 students and for IEA studies among 2007 students 22.28% immigrants (both averaged on a common scale results in 16.70%; N C=51). That is, there is no one definite and final number. If third-generation immigrants were to be included, the numbers in many receiving countries such as in Western Europe would be considerably higher. The different definitions of being a migrant and the increases in immigration make it essential to standardize the varying results of different studies before averaging across studies. The average presented here is for immigrants with two foreign-born parents or ‘one and a half’ foreign-born parents, meaning having not more than one native-born grandparent (the native country of the student itself is irrelevant). Some people would rate this as a narrow definition of being an immigrant and a wide definition of being native.
Because the OECD definition covers only ‘more migrant’ persons as immigrants, the native–migrant differences are larger in the OECD studies (PISA) than in the IEA studies (TIMSS/PIRLS): SASOECD=39.85 vs SASIEA=18.28 (in the same N C=43 countries). This means that a wider definition of being an immigrant (TIMSS/PIRLS) leads to larger immigrant numbers in the population (TIMSS/PIRLS) and to smaller gaps between natives and immigrants (TIMSS/PIRLS). Before calculating competence differences these definitional matters must be standardized.
Table 1 lists for all countries with data (N C=93) the proportions of immigrants, the competences and the differences. The countries with the smallest immigrant proportions are Iran and Poland with 1 to 2% immigrants among students. The largest proportions are found in Qatar (51%), The Emirates (73%) and Macau (79%). In Western Europe the average is 17% (Central Europe 30%; South 12%; West 16%; North 10%), in Eastern Europe 9%, in North America 26% and in Australia and New Zealand 31%. For East Asia, with the large differences between Macau (79%), Hong Kong (46%) and Singapore (22%) on the one hand, and China (4%), Taiwan (4%), Japan (3%) and South Korea (6%) on the other, the presentation of a mean would not be sensible. The regions with the lowest migrant proportions in the world are Eastern and Northern Europe and South-East Asia (with Pacific). The regional averaging was done across country means, such that different sized countries were equally weighted. Considering population sizes the results are somewhat different, e.g. for Western Europe instead of 17% now 15%, in Central Europe instead of 30% now 20% (Luxembourg with 47% has now less weight). In other regions the differences are smaller. Because in ‘Central Europe’ countries with very different population sizes and immigrant shares are combined (Germany vs Luxembourg) the population-size weighted averages are further reported.

Fig. 1. Map with natives' and immigrants' differences in cognitive competence means (N C=93). Black favours natives, grey small differences, white differences around ≤±2 and light blue to dark blue favours immigrants.
The countries with the largest past 10-year immigrant increase among students in school are El Salvador (+19%), Colombia (+16%), Kuwait (+15%) and Armenia (+14%), and among European and Western countries Liechtenstein (+11%) and Luxembourg (+10%). Little increase (+1 to −1%) is found for Eastern European, South-East Asian countries and Japan. A remarkable loss is observable in The Emirates (−14%), Estonia (−6%), Jordan (−6%) and Hong Kong (−6%). In Western Europe the average is +5% in the past 10 years (Central +8% [population weighted, +6%]; South +3%; West +5%; North +4%), in North America +6%, in Eastern Europe 0% and in Australia and New Zealand +5%. The regions with the lowest migrant increases in the world are Eastern and East Asia with around 0% (but East Asia is highly heterogeneous as regards migration).
The country with the smallest native–immigrant competence difference is Trinidad and Tobago with SASNMD=+1 (0.08 IQ points) favouring natives. Small differences (±2) at different levels could be found also in Serbia, Ireland, Israel, Azerbaijan and Kazakhstan. The largest differences favouring immigrants could be found in The Emirates (SASNMD=−68, −10.18 IQ) and Qatar (SASNMD=−53, −8 IQ). A remarkably small difference is also observable in Singapore with SASNMD=−8 (−1.14 IQ), remarkable first for the high competence level of both natives and immigrants (SASN=553 and SASM=561, in IQ 105 and 106) and second for the even better achievement of immigrants at such a high level (SASNMD=−8 or −1.14 IQ)! The largest differences favouring natives could be found in Egypt (SASNMD=77, 11.60 IQ), Georgia (SASNMD=74, 11.12 IQ) and South Africa (SASNMD=70, 10.50 IQ).
In Western Europe the average difference is SASNMD=38/5.71 IQ (Central 48/7.23 IQ [population weighted: 54/8.14 IQ]; South 25/3.68 IQ; West 32/4.84 IQ; North 47/7.10 IQ), in North America SASNMD=18/2.75 IQ, in Eastern Europe SASNMD= 32/4.75 IQ and in Australia and New Zealand SASNMD=0/0.39 IQ. The region with the lowest difference in the world is the formerly British South-West Pacific (Australia and New Zealand; SASNMD=0); the regions with the largest differences favouring natives are Northern Europe (SASNMD=47/7.10), Central Europe (SASNMD=48/7.23 IQ [population weighted: 54/8.14 IQ]), South-East Asia-Pacific (SASNMD=48/7.25 IQ) and sub-Sahara Africa (SASNMD=57/8.57 IQ); the region with the largest difference favouring immigrants is the Arab Gulf region (SASNMD=−21/−3.19 IQ). (In the Arabian Gulf countries ‘expats’ are attracted by the local governments with high salaries; one reason is the comparatively low level of local technological elites; Rindermann et al., Reference Rindermann, Baumeister and Gröper2014.)
Immigration gains (gains or losses from immigration for the country competence mean, depending on ability gaps and migrant proportions) are the largest for countries with oil-based economies such as The Emirates (SASIG=49, 7.42 IQ) and Qatar (SASIG=28, 4.21 IQ). The average ability level is markably lifted by immigrants. The largest losses are found for Luxembourg (SASIG=−22, −3.37 IQ), Switzerland (SASIG=−15, −2.19), Liechtenstein (SASIG=−13, −1.96 IQ), South Africa (SASIG= −12, −1.90 IQ), Egypt (SASIG=−12, −1.81 IQ), Germany (SASIG=−11, −1.59 IQ) and Belgium (SASIG=−10, −1.54 IQ). Regarding regions, the losses for Central Europe are on average SASIG=−14 (−2.10 IQ [population weighted: SASIG=−11, −1.63 IQ]), in West Europe SASIG=−6 (−0.84 IQ), in North America SASIG=−4 (−0.56 IQ) and for the West in general SASIG=−6 (−0.91 IQ). In these numbers emigration-based gains (emigration of lower ability groups) and losses (emigration of higher ability groups) are not considered.
Values of natives and migrants are highly correlated (r=0.92, N C=93; see scatter plot in Fig. 2). In countries with a high native competence level immigrants also achieve a high level and vice versa. Two hypotheses come to mind:
-
1. There are large differences between countries in their environmental quality relevant for the competence development of all, especially educational quality.
-
2. Natives and immigrants resemble each other due to cultural or genetic similarity. This similarity could be traced back to neighbour or similarity attraction effects in immigration and immigration policies or to immigration policies evaluating competence directly or indirectly (e.g. via educational degrees).
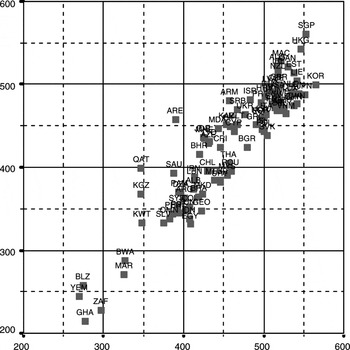
Fig. 2. Scatter plot with natives' and immigrants' cognitive competence means (r=0.92, N C=93). The ISO 3166 Alpha-3 codes for country are used.
The native's mean is (nearly) not correlated with the native–migrant difference (only r=0.09, N C=93), more the migrant's mean with the difference (r=−0.30, N C=93): the lower the migrant level, the larger the difference. This pattern suggests that the native–migrant gap (mean differences exist in spite of the high correlation) depends less on natives and their school system, but more on migrants and their attributes.
The following sections analyse the assumed causes of native–migrant gaps.
Analysis of causes of native–migrant competence gaps
Specific language problem?
Migrants are handicapped if they do not understand both the language of instruction and test. This is a highly plausible hypothesis explaining lower immigrant achievement. This hypothesis was tested in three ways:
Are native–immigrant gaps larger in literacy than in mathematics and science?
PISA allows the comparison of achievement in reading (verbal literacy) with achievement in mathematics and science (N C=32). If there is a specific problem in understanding the local language, the gap should be larger in (verbal) literacy than in mathematics and science. But it isn't (see also Table S2): the native–immigrant gap in reading is even smaller (SASNMD=34) than in mathematics (SASNMD=36) or science (SASNMD=46). Even if an immigrant advantage is set to zero (in other words: migrants being better than natives were set to no gaps) the pattern remains unchanged (reading: SASNMD=39; mathematics: SASNMD=42; science: SASNMD=45).
But there are large cross-country differences. Maybe the native–immigrant gaps depend on the universal familiarity of a language. Nearly every migrant may know English, but what about German, Finnish or Italian? Finally the task similarity of reading, mathematics and science scales within PISA has to be considered. Maths and science tasks also require verbal competence and measure it too.
Are native–immigrant gaps smaller in countries with universal languages?
It is assumed that the native–immigrant gap is smaller in a country with a universal language. What is ‘universal’ depends somewhat on region. For instance, in the Gulf countries the Arabic language could be universal, if a large proportion of immigrants come from other Arabian or Muslim countries with education in Koran schools teaching Arabic. English-speaking (and in school using English for instruction) host countries (N C=12, e.g. UK, USA and former colonies settled by Europeans or ‘older autochthonous natives’, e.g. Australia and Singapore) are compared with French-speaking (N C=2, Belgium was included here), Spanish-speaking (N C=10, Spain and the majority of Latin America), Arabic-speaking (N C=14, e.g. Emirates, Qatar, Tunisia) and ‘others-speaking’ countries (N C=55; e.g. Scandinavian, Eastern European, East Asian and South European countries).
Confirming our hypothesis, the native–immigrant difference is smaller in English-speaking host countries (SASNMD=15) than in ‘other’ countries (‘others’, SASNMD= 36; see Table S3; see also Schnepf, Reference Schnepf2007). But in French-speaking countries (SASNMD= 47) it is larger than in ‘others’, and also in Spanish-speaking countries (SASNMD=41); a small difference could be found in Arabic-speaking host countries (SASNMD=19). If immigrant advantage is set to zero this does not change the pattern except for Arabic (English: SASNMD=17; French: SASNMD=47; Spanish: SASNMD=42; Arabic: SASNMD=29; Others: SASNMD=37). English-speaking countries show no robust advantage in general educational quality (EQ UK=0, in 93 countries M EQ=−1.44, SDEQ=1.00; in English-speaking countries M EQ=−1.31, SDEQ=1.01; but ‘others-speaking’ countries even better: M EQ=−1.15, SDEQ=0.79). The UK has in our educational quality the best value.
If further factors are not relevant (immigrant policies or immigrant attributes), there is a 21 point advantage for English as language factor. But attributing this result to English as the universal language is not the only possible attribution and no language theory can explain why in certain countries immigrants show even higher competence levels than natives!
Identity of language at home and in tests or school
If students speak the same language at home as used in tests and/or explicitly in school for instruction the native–immigrant difference should be smaller and tend towards zero. For this analysis native–immigrant differences favouring immigrants were set to zero. Data are listed in Table S6 (Supplement, results of the analyses are shown in Table 3, variable ‘Language identity (family)’, N C=78). The correlation between language identity and gap is around zero (r=−0.02). There seems to be no effect of language.
Table 3. Bivariate correlations and β-coefficients from common regressions with general competence level as second predictor, for all nations with data and for European and Western nations separately, criterion native–immigrant differences

Criterion: native–immigrant differences (negative differences, standing for higher achievement of immigrants, were set to zero); ‘good’ results would be negative correlations and negative (standardized) β-coefficients meaning that native–immigrant differences (here negative native–immigrant differences were set to zero) were reduced.
Regressions included as second predictor the general competence level (SAS mean of a country, see Table 1, column 8, ‘Competence mean’; coefficient not shown).
European and Western nations with at least 5% immigrants among students.
Acculturation?
The better migrants know the host country, the habits of their hosts and the rules and processes in their educational system, the better their children should do at school. The hypothesis was tested in two ways:
Differences between immigrants of second and first generation
PISA offers competence results for immigrants of second generation (born in the country of assessment but whose parents were born in another country; N C=54) and first generation (born in another country and whose parents were born in another country). If students of the second generation show better achievement this would support the acculturation hypothesis. Generally, students of the second generation (see Table S4) show better results (SASM2-1=12, 1.84 IQ). The positive effect appears across the five PISA surveys (PISA 2000: SASM2-1=18; PISA 2003: SASM2-1=13; PISA 2006: SASM2-1=5; PISA 2009: SASM2-1=14; PISA 2012: SASM2-1=8). The gains are tending to become smaller with time, and in 10 years they became −7.33 points smaller. This is a hint that acculturation becomes weaker, e.g. due to creating own milieus leading to social and cultural separation, facilitated by increasing immigrant groups and certain world views such as Islamic religion. A set to zero of negative effects is here not necessary (no comparisons with natives).
However, there are countries with a negative first-to-second-generation migrant competence development: Qatar SASM2-1=−57, Emirates SASM2-1=−38, Chile SASM2-1=−34, Latvia SASM2-1=−25, Czech SASM2-1=−24, Azerbaijan SASM2-1=−22, New Zealand SASM2-1=−19, Costa Rica SASM2-1=−16, Trinidad SASM2-1=−14, Ireland SASM2-1=−3 and Jordan SASM2-1=−2. These negative results show that acculturation is not the whole story in second- vs first-generation differences, but probably also that there are differences in origin among immigrant groups. For example, in Germany (only SASM2-1=1) first-generation immigrants could be immigrants from Eastern Europe, whereas second-generation immigrants come from Turkey. Only if second- and first-generation immigrants did not differ in such aspects can the difference unambiguously be interpreted as acculturation gains. However, the presented difference is contaminated with other differences and therefore it is not consistent across countries.
Differences between one- and two-immigrant-parent families
The IEA studies (TIMSS and PIRLS) present data for students from families with one and two immigrant parents (N C=64). It is assumed that due to a knowledge headstart native parents can better support their children in dealing with educational challenges than immigrant parents. Additionally, language acquisition is made easier. Within the IEA studies, a difference between one- and two-immigrant-parent families was calculated (see Table S5). There is a small general lead for one- compared with two-immigrant-parent families (SASM1i-2i=7, 1.05 IQ).
However, in 31% of all countries there was a negative impact of intermarriages: Emirates SASM1i-2i=−70, Botswana SASM1i-2i=−54, Qatar SASM1i-2i=−53, Saudi Arabia SASM1i-2i=−40, Kuwait SASM1i-2i=−31, Bahrain SASM1i-2i=−27, Iran SASM1i-2i=−24, Jordan SASM1i-2i=−21, Algeria SASM1i-2i=−20, El Salvador SASM1i-2i=−17, Oman SASM1i-2i=−15 and further countries with smaller leads of between −14 and 0. Across 64 countries gains through intermarriages vary between SASM1i-2i=−70 and +49 and they are positively correlated with natives' competence levels (r=0.52).
The intermarriage effect goes in both directions, up and down. Apart from an acculturation gain two possible interpretations stemming from two competing paradigms are conceivable:
-
1. There is general effect of family transmission passing on from parents to children a culture of education, meritocracy and general burgher (middle-class) values, e.g. the appreciation of learning, acquiring knowledge, diligence, perseverance, thinking and rationality (e.g. Rindermann et al., Reference Rindermann, Flores-Mendoza and Woodley2012a).
-
2. Parents do not only transmit competence via creation of a stimulating environment, but also via genes (e.g. Scarr & McCartney, Reference Scarr and McCartney1983). Based on international distributions of marker genes, there is some evidence that not only environmental, but also genetic factors contribute to international cognitive competence differences (e.g. Piffer, Reference Piffer2013a, Reference Piffer2013b; Rindermann et al., Reference Rindermann, Woodley and Stratford2012b).
Negative effects of intermarriage between migrants and natives arise, especially in countries where the natives have low competence levels. If countries showing negative intermarriage effects are compared with those showing positive effects, the difference between native competence levels is remarkably high: SASneg=405 (N C=20) vs SASpos=467 (N C=44). The higher the natives' competence level, the more benefits the child of one migrant parent gets from being also the child of one native parent (r=0.51, N C=64). A closer look at regions reveals a similar pattern. In Western countries (Europe, North America and Australia–New Zealand) there is a remarkable increase for migrant children through an intermarriage of their migrant parent with a native (SASM1i-2i=25), but in Arabian countries (SASM1i-2i=−14), Africa (SASM1i-2i=−11) and Latin America (SASM1i-2i=−5) decreases are observed. This supports an assumption that more general nurture and nature factors are relevant.
Unfortunately, there is no information on marriage patterns: who marries whom? Within migrants and within natives ‘the cross-marrying persons’ could differ from the persons marrying within migrants and natives.
Educational quality?
The high correlation between natives' and immigrants' competence levels (r=0.92) suggests that general environmental factors in host countries may also influence competence development (e.g. Hunt, Reference Hunt2012). Among these educational policy can have a high impact (Rindermann & Ceci, Reference Rindermann and Ceci2009). Environmental factors are listed for 93 countries in Table S6. They are correlated with native–immigrant differences (negative differences, standing for higher achievement of immigrants, were set to zero). Additionally, in regression analyses their possible impact was controlled by adding as a further predictor the general competence level of a society. Finally, the same analysis was done for a sample of N C=38 European (including Eastern Europe) and Western countries with an immigrant proportion of at least 5%.
Enrolment at a young age (increases learning time in a sensible age period) shows a gap-reducing effect. This effect remains stable if the general competence level is included or the 38 Western European country subsample is analysed (see Table 3). One year earlier school enrolment reduces the average 34 point difference between natives and immigrants (SASNMD=29 in the 38 Western country sample, for both negative differences set at zero) by 10 or 8 points (from SASNMD=34 to 24 in N C=93 all, or from SASNMD=29 to 21 N C=38 Western countries). Some backward effects – average cognitive development lowers enrolment age – cannot be excluded.
A high repetition rate is not a characteristic of a school system with well achieving students (e.g. Rindermann & Ceci, Reference Rindermann and Ceci2009). Repetition rates are also robustly related to larger native–immigrant gaps – they increase the gaps. A 10% decrease in repetition rates would reduce the gap by 3 to 5 SAS points (in the total and selected country sample). Backward effects (repetition rates as a hardly effective remedy against low competence) could exaggerate the negative repetition relationship.
Educational headway (attendance of high grades at a young age; increases learning time in sensible age periods, an indicator of an efficient educational system) is stably associated with decreasing native–immigrant gaps. The variable has an artificial scale.
Discipline (increased time on task) does not reduce gaps; in the selected Western sample it seems to enlarge them. The pattern is not plausible.
The effects of the two test and exam variables go in the same direction: The regular application of achievement tests and central exams and using them for admission to high schools, colleges and universities reduces native–immigrant gaps. A 10% increase roughly corresponds to 3 points. The size of effects (correlations and standardized regression coefficients on average: r/β=−0.27), their general positive effect on competences (Rindermann & Ceci, Reference Rindermann and Ceci2009) and the compelling theoretical argument (an objective measure stimulates effort, learning and instructional quality, meritoric effect; Rindermann & Ceci, Reference Rindermann and Ceci2009) suggest that here is an important measure to reduce native–immigrant gaps. However, some backward effects may increase the relationship: in ethnically heterogeneous societies objective competence measures tend to be avoided and substituted by easier to manipulate or more affirmative action biased ‘holistic’ decision rules (Sowell, Reference Sowell1993, Reference Sowell2004; Lott, Reference Lott2000; Farron, Reference Farron2010; Wax, Reference Wax2012). Rent-seeking behaviour (the search for not-on-achievement and productivity-based income) boosted by ethnic diversity (Easterly & Levine, Reference Easterly and Levine1997), opposes objective measures and affects achievement motivation and competence development (e.g. McWhorter, Reference McWhorter2000, pp. 232f). In the long run imperfect information on ability leads to underinvestment in ability development, the use of low-quality proxy variables (such as the reputation of schools) and misallocation of human capital.
In education economics school autonomy is seen as a more effective form of management than management by supervisory school authorities (e.g. Hanushek & Woessmann, Reference Hanushek, Woessmann, Hanushek, Machin and Woessmann2011). Information is given at the place where decisions are made. Additionally, schools are motivated to improve instruction if they have the possibility to make improvements. School autonomy shows a robust native–immigrant gap reducing effect (on average: r/β=−0.19). A 10% increase reduces the gap by 3 SAS points. Backward effects (centralization as the answer to ethnic heterogeneity) has been implemented for the general distribution of educational means in the US, but not for dealing with teachers, curriculum, assessment and spending of given money measured here.
A school quality sum robustly reduces the native–immigrant gaps (on average: r/β=−0.19, a 1 SD corresponds to 6 SAS points; see Fig. 3). If there are only negligible backward effects, the concept of school quality, as developed here, is important for reducing native–immigrant gaps.

Fig. 3. Scatter plot with school quality indicator and competence gap in SAS points (r=−0.21, N C=38 Western and European countries with at least 5% immigrants The ISO 3166 Alpha-3 codes for country are used.
Aspects of students and society
A higher immigrant proportion is not associated with larger native–immigrant gaps, but with smaller ones (Table 3). High competence and prosperous countries probably attract immigrants, and some of these countries also apply an effective Brain Gain policy. In the long run, across generations, through the transformation of migrants into natives, larger immigrant proportions could also contribute to decreasing native–immigrant gaps.
Specific language identity shows only small reducing effects for native–immigrant gaps in Western countries (see above). A 10% increase corresponds to a reducing gap of only 1 SAS point in Western countries.
The general educational level of a society (mean educational level of adults) is, in cross-country analyses, the educational variable that most highly correlates with student competences (Rindermann & Ceci, Reference Rindermann and Ceci2009). It is probably a strong determinant of cross-country differences by raising the general competence level, working especially through parental education in families and through teachers' ability, and the quality of the political and administrative structures. It also has a reducing effect on native–immigrant competence gaps (on average: r/β=−0.18, variable has no interpretable scale).
Democracy, general developmental level (HDI) and wealth generally have on average less of a decreasing, and more of an increasing effect (r/β=0.19). This is especially true for Western and European countries. Most probably countries with a high level of national well-being also attract poorly educated immigrants with lower competence levels. It would be important, as for other variables, to have a closer look at single countries, their immigration histories and policies. For example, non-democratic countries such as the Arabian Gulf monarchies have established a pure ‘own-benefit’ immigration policy. Liberal democracies may have problems in establishing competence-based and competence-demanding immigration and education policies (Hoppe, Reference Hoppe2001).
Adult literacy study PIAAC
Complete data were only available for 21 to 24 countries (full information on all variables for 21 countries, selective information for 24 countries). Thus the results should be treated tentatively. The difference between natives and immigrants is 34 SAS points (5.03 IQ) and nearly identical to the difference for student assessment studies (31 SAS, 4.71 IQ). A higher proportion of immigrants slightly correlates with the native–immigrant gap (r=0.15, N C=21). It seems that higher immigrant proportions somewhat increase the gap, e.g. by the development of separate milieus.
A higher proportion of immigrants negatively correlates with the age difference between the youngest and oldest adults (r=−0.27, N C=23), and a higher proportion of natives positively correlates with the age difference (r=+0.44, N C=23). The correlations are not symmetrical (e.g. r=−0.27 and r=+0.27), because the percentages of natives and immigrants do not add up to 100% (both are correlated with only r=−0.89). The age difference can be used as an indicator of the Flynn effect. Generally, if younger generations are smarter than older generations, this difference can be explained by ageing and by generational differences. However, in cross-country comparisons, the ageing factor could be treated as a constant (there are only small and unsystematic correlations of the age difference with HDI and GDP, r=−0.10 and −0.04) while the generational factor standing for the Flynn effect varies. The correlations with the native and immigrant proportions indicate that immigrants lower the competence levels among younger cohorts.
This result is corroborated by two additional analyses: (1) The proportion of immigrants negatively correlates with the country's average (r=−0.18, N C=23); it seems to have a small decreasing effect. (2) The proportion of immigrants more strongly and negatively correlates with the country's low 5% level (r=−0.44, N C=23), but not with the high 95% level (r=0.15, N C=23). In conclusion, immigrants immigrate in the cognitive lower classes and lower their ability level – at least in this OECD country sample.
Economic immigration gains or losses
Immigration gains (gains or losses through immigration for the country competence mean) are largest for countries with oil-based economies (around SAS=28 to 49, 4 to 7 IQ), and the losses are the largest in Central Europe (around SAS=−14, −2 IQ [population weighted: SAS=−11, −2 IQ]). These values, taking the well corroborated cognitive human capital theory that cognitive ability matters for wealth (e.g. Jones, Reference Jones2011; Meisenberg, Reference Meisenberg2012; Rindermann, Reference Rindermann2012; Hanushek et al., Reference Hanushek, Peterson and Woessmann2013) and based on present student values used as estimates for the coming workforce, could be used to calculate expected wealth gains and losses. Cross-sectionally, one IQ point corresponds to 738 US$ (Gross National Income, GNI, per capita and per year, adapted for ‘purchasing power parity’ (ppp), 2008 ]; source, UNDP, 2010). Transformed to the SAS scale, 1 SAS point corresponds to 111 US$. The largest immigrant-based gains, assuming a) no changing population, b) disregarding other factors such as economic freedom and mineral resources, and c) assuming that the future productivity of economies is largely based on cognitive capital, are estimated for the Emirates (5439 $, per capita and per year, ppp, 2008 $) and Qatar (3108 $). But the largest losses will be seen in Central European countries (on average −1554 $; population weighted: −1202 $), e.g. in Germany −1221 $ and France −888 $, and for the US the loss is −555 $ (see also Rector & Richwine, Reference Rector and Richwine2013).
In this first tentative projection, factors with an immigrant cognitive impact boosting effect (increasing proportions of immigrants, increasing cognitive complexity of future technological and organizational tasks, further factors such as economic freedom depending on competence), factors with a neutral effect (within immigrant proportions' differences), factors with a decreasing effect (narrowing of gaps in Western countries through lifting migrants' competences) and the dependence of the cognitive ability effect on cognitive level are not considered. Immigration policy and educational policy can considerably change this predicted development.
Discussion
This study attempts to integrate the results on natives' and immigrants' proportions and their competence levels from PISA, TIMSS, PIRLS and PIAAC competence studies done from 1995 to 2012. Differences in study approaches and historical development in these 17 years were considered before calculating a sum value for the student studies. In contrast to some widespread convictions, immigrants do not necessarily have lower cognitive competence levels than natives. It is true that the general mean difference across 93 countries favours natives (students: SAS=31 point difference, equivalent to 4.71 IQ points). However, across countries a large heterogeneity is observable, from gaps favouring migrants at around SAS=−60 points (≅9.00 IQ points) in Gulf countries to around 0 in Singapore or Hong Kong to around +60 favouring natives in European and developing countries (≅9.00 IQ points). Because there are significant proportions of immigrants in many countries, increasing immigrant populations (in a 10-year perspective the international trend is +4%), and because some countries even today have a majority of immigrants in their student populations (Gulf countries, Macau), immigrants' human capital is important for the development of societies. Additionally, large gaps between natives and immigrants in competences could create lifestyle and economic gaps leading to strained relations.
According to Thomas Sowell (Reference Sowell2004), within-country gaps between different ethnic, religious or language groups frequently give rise to the attempted ‘cures of affirmative action’, which can lead to a misallocation of human capital and further increase social tensions. An important example was discrimination against Jews in admission as students and professors to US Ivy League universities in the first half of the 20th century (Karabel, Reference Karabel2005). But to obtain efficiency, productivity and quality in an economic system, the fit between the demands of workplaces and the abilities of those appointed to do the job must be good (Hunt, Reference Hunt1995, pp. 108ff.). In future, the mentioned ‘cures’ could be even more widespread (e.g. beginning with preferential admission for immigrants in the police force; Land Berlin, 2010). For these reasons it is important to understand the development of native–immigrant gaps. This knowledge could be used for establishing means to reduce them.
The increasing share of immigrants in Western countries, including the United Kingdom (from PISA 2000 to 2012 from 9 to 12%, generally in 10 years +4%, in UK: from 10 to 13%, in 10 years +2%), and the gaps (in UK: 20 SAS, 3.06 IQ) make it reasonable to modify the ‘traditional’ Greenwich IQ benchmark based on national means to a Greenwich IQ benchmark based on UK natives' mean. This UK natives' mean is set at IQ 100. Because immigrants on average have a lower cognitive competence level and their proportion is larger than 0% the logical conclusion is that the UK mean is below 100 (currently 99.60 IQ points). The second consequence of a UK natives' mean-based Greenwich IQ is that this benchmark is somewhat more demanding than the former UK mean (currently 0.40 IQ points), leading to decreasing results for other countries. But the new natives' Greenwich IQ has a higher validity – it stands for a less volatile cognitive ability level of a certain people and culture at a certain place.
Possible explanations for the native–immigrant gaps
Language problems seem not to be responsible for the native–immigrant gaps and their differences across countries. Within PISA there is no difference between verbal vs mathematics and science scales. Identity of used language in family and test or instruction has no or only a minor positive impact. This conclusion is corroborated by a different methodological approach chosen by the OECD researchers in analysing the PISA 2012 results. After parallelization of natives and immigrants in reading literacy, in OECD countries on average only 45% of immigrants outperform natives in problem solving (OECD, 2014, p. 213, Table V.4.21, fourth column). That means 55% of immigrants with similar performance in reading are worse in problem solving than natives, on average 9 SAS points (equivalent 1.35 IQ points). The true score seems to be lower. There is no evidence for a special language problem, but more of a general intelligence problem.
However, English-speaking countries show an advantage (SAS=21 points, ≅3.15 IQ points). Most probably, differences in immigration policies and histories are responsible for this advantage. Time, acculturation within one generation and intermarriages can reduce native–immigrant gaps (SAS=12 and 7 points, 2 and 1 IQ points). This gives hope for a future narrowing of native–immigrant gaps. Nevertheless, such a narrowing is not observable in all countries. And narrowing is only one important aspect, with the level itself being another: if narrowing happens through ‘nativization’ of immigrants, meaning that former immigrants now count as natives and through their on average lower competence reduce the gap between ‘natives’ and immigrants, this loss of ability would have a negative impact for society.
Educational quality reduces native–immigrant gaps. Especially, more time for learning in a sensible age period (school enrolment at young age), the use of achievement tests, school autonomy and the general educational level can reduce native–immigrant gaps. The effect of the improvement of one standard deviation in school quality represents a decrease of 6 SAS points (1 IQ point) in the native–immigrant gap.
Limitations and recommendations
The limits of the given data and of a cross-country approach should not be ignored. First of all, and most importantly, the competence studies do not report means related to the countries of origin of immigrants. Apart from PISA 2009 for only 26 selected host countries and their main immigrant groups differing from country to country, there are no results at the country level (OECD, 2010, Table II.4.5, p. 182). Only analyses at the individual data level using single surveys (as done by Levels et al., Reference Levels, Dronkers and Kraaykamp2008, and Schnepf, Reference Schnepf2007; Carabaña, Reference Carabaña, Pereyra, Kotthoff and Cowen2011; Dronkers et al., Reference Dronkers, Velden and Dunne2012) can do this. In such analyses the average competence level of the origin country can be compared with those of the emigrants from that particular country in different host countries. But if immigrants' competences differ from their origin country, this does not necessarily mean that educational policies are responsible for this difference. Selective emigration (for example Iran in the US: Bozorgmehr & Sabagh, Reference Bozorgmehr and Sabagh1988) and immigration policies could be also relevant. Finally, this could be done only in a restricted set of countries with selected immigrant groups providing enough data.
The ideal study would also measure and compare parents' competencies. This would allow a control for parental ability, and give for students an unbiased estimate of the host country's education system and its effects.
Further important information is missing on immigrants and natives, e.g. on religion, ethnicity and evolutionary background. Such studies should also control the effect of parents' socioeconomic status (Rindermann et al., Reference Rindermann, Flores-Mendoza and Mansur-Alves2010). Socioeconomic status is not independent of parents' educational and competence level and more general factors such as culture. Neglecting their influence will lead to biased results. Dronkers et al. (Reference Dronkers, Velden and Dunne2012) mentioned the important role of religion (a SAS gap of 35 for immigrants from Muslim countries, around 5 IQ points). Christian Arabs in Israel show an educational level corresponding to Oriental Jews and around d=0.71 higher than Muslim Arabs (16 months, depending on estimation method representing between 4 and 11 IQ points; Shavit, Reference Shavit1990).
Many countries are heterogeneous in religion or ethnicity and averaging at the level of countries could bias conclusions (e.g. Christian minorities in Arabian countries; in the Balkan ‘Roma minority natives’ and ‘ethnic majority natives’; in South-East Asia people of Chinese origin vs ‘natives’; in South Africa people of European vs African descent emigrating to New Zealand). Among immigrants within one country there are large differences in legal status and treatment by authorities, e.g. adults denied refugee status in Germany do not receive language instruction. Language instruction should be established as a human right and, of course, it is serving a host country's own interests!
There is only a smaller country sample on the cognitive competence level of adult populations (21 to 24 countries from PIAAC). Due to fertility differentials and different immigration policies there can be large differences between adult and student immigrant populations (e.g. Switzerland attracts well educated adult academics from European countries, but they have few children; on the other hand groups from the Balkan and the Middle East have many children). Migrant groups are not homogenous in their ability distributions, and usually the distributions are bimodal (Kahn, Reference Kahn2004). The PIAAC study reveals negative competence effects of larger immigrant proportions, especially at the lower levels. They slow down positive Flynn effects.
Finally, the political issues of brain gain and brain drain were not discussed. Attracting highly educated and competent people from other countries saves the host country money otherwise spent in education. But it also withdraws from emigration countries human capital, especially in poorer developing countries, where it is necessary for development (Kapur & McHale, Reference Kapur and McHale2005). If such ‘institution-builders’ are lost, crucial sectors of development suffer, such as the health system, education and research, public administration and private entrepreneurship. The best policy, which does not impede other nations, is local improvement in education. This includes school enrolment at a young age, increasing learning time in childhood; the use of tests and central exams, stimulating learning through objective measures and thresholds; more school autonomy, improving decisions and school quality; and a higher general educational level, increasing a society's mean competence and working indirectly through improving institutions and the environment relevant for all students' development.
Supplement
An Online Supplement (Supplementary material, Method and further result Tables, S1 to S6) is put on the homepage of the first author (www.tu-chemnitz.de/~hrin). It can be also obtained by email.
Acknowledgment
The authors would like to express their gratitude to Anna Eva Giammarco, who helped with the collection of data.


