


Introduction
Durum wheat [Triticum turgidum (L.) Tell. convar. durum (Desf.) Mackey] is the main modern tetraploid wheat with genome formula AABB and seven homeologous groups (2n = 4x = 28). It is mainly grown in relatively dry regions in the Mediterranean basin, in India, the former USSR and low rainfall areas of the great plains of the United States and Canada (Feldman et al., Reference Feldman, Lupton, Miller, Smartt and Simmonds1995). Triticum durum Desf. is the second widespread Triticum species containing 10–11% of the world wheat crop and covering about 8% of the total wheat production (Ganeva et al., Reference Ganeva, Korzun, Landjeva, Popova and Christov2010). It has large and very hard grains, produce low gluten flour, which is appropriate for macaroni and semolina products (Feldman et al., Reference Feldman, Lupton, Miller, Smartt and Simmonds1995). It is less well suited for bread production than hexaploid bread wheat (Triticum aestivum L., AABBDD). Wheat gluten proteins predominantly determine the rheological properties of dough and thus confer the unique viscoelastic properties on the dough (Li et al., Reference Li, Wang, Li, Xiao, Sun, Wang, Hu, Feng, Chang, Chen, Wang, Li, Yang and He2012).
Although, durum wheat is grown in many areas of the world, a major production area is located in West Asia and North Africa (WANA) (about 9 million ha) where the climate is characterized with low to moderate rainfall (less than 350 mm annual rainfall) and moderate cold to cold temperature in winter. In the WANA zone, including Turkey, low temperature (cold) causes considerable damages to durum wheat at various plant development stages, especially at the seedling and tillering stages. In this zone, the temperature can drop as low as −25 °C during the winter months of the year, causing considerable yield loss.
Low temperature is one of the critical factors for determining agricultural production. When environmental temperature, at which maximum growth and development occur in plants, is low, physiological, biochemical, metabolic and molecular changes are observed within plants. The reduced temperature induces stress tolerance in plants, and this process is called chilling and/or cold acclimation (CA). Chilling tolerance is the capability of a plant to tolerate low temperatures (0–15 °C) with having no injury or damage (Yadav, Reference Yadav2010). CA is the process that hardy plants develop advanced essential tolerance for cold stress survival through which the plants have several changes at different levels of biochemical and cellular biology in plants (Heidarvand and Amiri, Reference Heidarvand and Amiri2010).
In plant physiology, chlorophyll fluorescence is one of the efficient techniques for measuring the activity of photosystem II (PSII) (Murchie and Lawson, Reference Murchie and Lawson2013). The ratio of the variable fluorescence to maximum fluorescence (Fv/Fm) is a common parameter to measure some physiological stress such as light intensity, water deficit, etc. in plants. The value of the Fv/Fm ratio is optimal ~0.83 under unstressed conditions for plant leaves and refers to the maximum quantum yield of photosynthesis (Demmig and Björkman, Reference Demmig and Björkman1987; Murchie and Lawson, Reference Murchie and Lawson2013). If the value of the Fv/Fm ratio tends to decrease, that is attributed to the presence of any type of ‘stress’ that causes inactivation damage of PSII (Long et al., Reference Long, Humphries and Falkowski1994; Murchie and Lawson, Reference Murchie and Lawson2013).
The studies of the inheritance of frost resistance and winter hardiness started in the last century. Nilsson-Ehle (Reference Nilsson-Ehle1912) was the first, who crossed two winter varieties to investigate winter hardiness and he came to the conclusion that winter hardiness is controlled by polygenes as well as other quantitative characters. Similar findings were also reported by several scientists (Hayes and Aamodt, Reference Hayes and Aamodt1927; Worzella, Reference Worzella1935: cited in Sutka, Reference Sutka2001). A gene for frost tolerance located on the chromosome 5A of wheat and the locus assigned as Fr1 was completely linked to locus Vrn1 controlling vernalization requirement, which might have a pleiotropic action or a close genetic linkage with Fr1 (Sutka and Snape, Reference Sutka and Snape1989). The winter hardiness of winter wheat positively correlated with plant height and grain yield (Ruzgas and Liutkevičius, Reference Ruzgas and Liutkevičius2001). Mekhlouf et al. (Reference Mekhlouf, Dehbi, Bouzerzour, Hannchi, Benmahammed and Adjabi2006) assessed genetic variability for resistance to low temperatures using a programmable freezer to test their influence and examined the relationships between the results of cold tests and the agronomic performance and stability of a field grown set of durum wheat genotypes showed significant genetic variability and differential responses to the growth conditions experienced. A more accurate estimation of frost resistance in wheat varieties should be performed under natural and artificial conditions, and several years of testing is needed (Chipilski and Uhr, Reference Chipilski and Uhr2014).
The winter hardiness and frost tolerance are complex traits that can be improved not only by phenotypic selection, but also by the genotypic selection, which is based on quantitative trait locus (QTL) mapping and other genomic studies such as marker-assisted selection. However, genomic approaches hold potential for a knowledge-based improvement of those important traits in elite Triticale germplasm and three major QTLs on chromosomes 5A, 1B and 5R identified (Liu et al., Reference Liu, Maurer, Li, Tucker, Gowda, Weissmann, Hahn and Würschum2014a). It was suggested that the frost tolerance in winter durum wheat was mainly controlled by copy number variation of CBF-A14 at the Fr-A2 locus and it could almost be considered as monogenic with the major QTL Fr-A2 explaining about 90% of the genotypic variance while the second identified locus Fr-B2 explained a comparable negligible proportion of around 4% (Sieber et al., Reference Sieber, Longin, Leiser and Würschum2016).
The economy depends mostly on agriculture in Turkey, and most of the farmers are not big and rich. The harvested cereal crops are partitioned by small farmers as a seedling for next crop season, for home use and for selling to merchants to cover their living expenses and for farming expenses such as fertilizers, gas oil, etc., and similar expenses in large scale necessary as well for big and rich farmers. The yield loss due to low temperatures leads to some problems in the economy and society. Therefore, the identification and development of germplasm sources of cold tolerance in durum wheat are very important in the success of future durum wheat-breeding programmes in this region.
This study is a part of the project ‘WANADDIN (The West Asia and North Africa Dryland Durum Improvement Network), funded by International Fund for Agricultural Development (IFAD), was implemented in the period 1996–1998 with the objective of achieving sustainable improvement in the productivity and production of durum wheat in the dryland environments of the WANA (West Asia and North Africa) region through the establishment of a formal network involving the joint ICARDA/CIMMYT durum wheat research program and the National Agricultural Research Systems (NARS) of Algeria, Morocco, Syria, Tunisia and Turkey. It aimed to continue the development of improved germplasm by incorporating new sources of tolerance and/or resistance against the major abiotic and biotic stresses…’ (ICARDA, 2005). The recombinant inbred lines (RILs), which are the F6 progeny of Kunduru-1149 (female parent) and Cham-1 (male parent) crosses, were developed in line with the objectives of the WANADDIN project. The crosses were made to develop the RILs, which have tolerance to cold, boron toxicity and yellow rust.
The objectives of the current study are (i) to characterize 141 F6 progeny of RILs in terms of their cold tolerance both in the field and under controlled (in growth chamber) conditions; (ii) to determine the correlations between cold tolerance and some quality parameters and (iii) to determine the correlations between cold tolerance and biochemical (gliadins and high molecular weight (HMW)-glutenins) as well as DNA (random amplified polymorphic DNA (RAPD)) markers in Central Research Institute for Field Crops (CRIFC) as one of the group member in Turkey, which is one of the partnerships of WNADDIN project.
Materials and methods
Plant material
F6 progeny of Kunduru-1149 × Cham-1 cross, 141 RILs, developed by the International Centre for Agricultural Research in the Dry Areas (ICARDA) durum wheat-breeding programme in Aleppo, Syria, was analysed. Kunduru-1149 as the female parent had cold tolerance, high quality, low yield and disease susceptible genetic characters, while Cham-1 as the male parent had cold sensitive, low quality, high yield and disease resistance genetic characters.
Screening for cold tolerance in the field
Twenty-five seeds for each one of the 141 RILs from F6 progeny were sown as three replications in three different locations, Sivas-Ulaş Directorate of Agricultural Management Research Field (COLDU), concrete bed in the research field of CRIFC in Ankara-Haymana (COLDH) and research field of CRIFC in Ankara-Yenimahalle (COLDY) (Fig. 1). The locations with their abbreviations used throughout the text, the coordinates and altitudes of these three locations, and the minimum temperatures recorded during growing seasons at these locations are indicated in Table S1.

Fig. 1. A map of Turkey showing the locations, where the cold tests carried out (Ankara-Haymana (COLDH), Sivas-Ulaş (COLDU) and Ankara-Yenimahalle (COLDY) test locations).
The lines, which had uneven and inadequate emergences, were omitted from the study in all test locations. The evaluation of cold damage (CD %) was performed according to the 0–9 evaluation scale, which was adopted from Rizza et al. (Reference Rizza, Crosatt, Stanca and Cattivelli1994) and routinely used in the cold-breeding studies of CRIFC. This scale depends on the visual evaluation of the percent of individual leaf area showing cold damage symptoms (0: <5, 1: 5–15, 2: 15–25, 3: 25–35, 4: 35–45, 5: 45–55, 6: 55–65, 7: 65–75, 8: 75–85 and 9: >85%; 0 = the most tolerant to cold; 9 = the least tolerant to cold).
Soil analysis
Soil samples from the locations, where the tests were carried out were analysed for soil pH, EC (mmhos/cm), CaCO3, organic material, sand, clay, silt and important microelements (Table 1). Although the soil characteristics of these three test sites were different from each other, they were all accepted as useable in the analysis.
Table 1. Constituents of soil from three different test locations

Sivas-Ulaş Directorate of Agricultural Management Research Field (COLDU), concrete bed in the research field of Central Research Institute for Field Crops (CRIFC) in Ankara-Haymana (COLDH) and research field of CRIFC in Ankara-Yenimahalle (COLDY).
Meteorological data
The information related to main climate parameters (maximum and minimum temperatures, % humidity daily) was taken for the period of sowing and evaluating dates from the meteorology centres nearest to the locations where the tests performed (Göçmen, Reference Göçmen2001). Only the minimum temperatures detected in these test locations are given in Table S1.
Screening for cold tolerance under controlled conditions
These tests were carried out in two SANYO-MIR 552 type incubators (SANYO Electric Co., Ltd., Japan) which operate within the range of −15 and +52 °C. The 56 cm × 36 cm × 14 cm boxes were filled with an equal amount of soil, and each box was fertilized with 3.6 g (=18 kg/da) diammonium phosphate. Soil from the research field of the Central Research Institute for Field Crops (CRIFC) in Ankara-Yenimahalle was utilized (Table 1). Seeds of 141 RILs were sown in a box, and the test was performed as three replications. The seeds of all lines were sown in the same depth of 3.0 cm in each replication. The number of sown seeds per line was initially 14, but after germination, each line was arranged as ten plants. The time schedule of activities in this procedure is described in Table S2.
Test materials were evaluated at +10, −5, −10 and −15 °C with an Opti-sciences OS1-FL Modulated Chlorofluorometer to determine the cold tolerance of lines. The parameter Fv/Fm, which is the quantitative measure of photochemical efficiency (Fisker et al., Reference Fisker, Rose and Haase1995), was recorded on randomly selected four plants out of ten plants present for each line. The average of four plants’ data was used for statistical analyses.
Screening for quality parameters
Each of 141 RILs was tested in terms of their thousand kernel weight (dry-TKW and wet-TKW = g/1000 kernels), moisture contents (MC as percentage of wet TKW), vitreous kernel count (VKC) to determine the percentages of vitreous kernels (VK), opaque kernels (OK) and partly opaque kernels (POK), protein content (PC), hardness (particle size index = PSI), colour (yellow pigment = YP) and SDS sedimentation as quality parameters. These tests were carried out in the Quality Laboratory of CRIFC in Ankara by using standardized protocols. Details of each protocol are given in Göçmen (Reference Göçmen2001).
Analysis of gliadins
Analysis of gliadins was performed using an A-PAGE method previously described by Bushuk and Zillman (Reference Bushuk and Zillman1978) with some modifications done by Cereal Quality Laboratory in ICARDA (Göçmen, Reference Göçmen2001).
Analysis of HMW-glutenin subunits
Analysis of glutenins was performed using an SDS-PAGE method previously described by Ng and Bushuk (Reference Ng and Bushuk1987) with some modifications done by Cereal Quality Laboratory in ICARDA (Göçmen, Reference Göçmen2001).
Analysis of RAPD loci
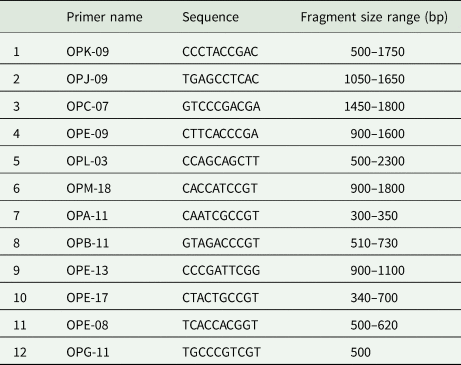
Genomic DNA was extracted from a whole seed using the extraction protocol of Plaschke et al. (Reference Plaschke, Ganal and Röder1995). Thirteen ten-base oligonucleotide primers from Operon Technologies (Alameda, California) were used to screen the DNAs of each 141 RILs by using polymerase chain reaction (PCR) conditions described in Göçmen (Reference Göçmen2001) and Göçmen et al. (Reference Göçmen, Keskin, Kaya and Taşkın2003). The primer names, sequences and fragment sizes observed in the study are given in Table 2.
Table 2. Operon random ten-mer primers, which were the most polymorphic and produced scorable bands, their sequence information and the fragment size range observed in the study
Statistical analysis
Analysis of variance
Analysis of variance (ANOVA) was carried out for determining differences among 141 RILs in terms of their response to low temperatures both in the field tests and the tests performed in controlled environments. ANOVA was calculated based on RILs' means and analysis was carried out using the generalized least squares procedure of SAS (SAS, Statistical User's Guide, 1988) because this program gives unbiased estimates of all mean squares when a data set has missing value. The following statistical model was used in the data analysis:

where Zik is the mean performance of the ith RIL in the kth replication, μ is the experimental mean, Rk is the effects of replication, Gi is the effects of genetic types and eik is the experimental error (Kaya et al., Reference Kaya, Campbell and Adams1989).
Heritabilities
Heritability (h 2) was estimated from the components of variance as described by Kaya and Temerit (Reference Kaya and Temerit1994) and standard errors for heritability estimates were computed according to Becker (Reference Becker1992).
Correlations between cold scores and quality parameters
The phenotypic correlation between traits x and y was calculated from RILs mean squares and mean cross products for the traits according to Kaya et al. (Reference Kaya, Campbell and Adams1989), while the genotypic correlation between two traits was calculated according to Falconer (Reference Falconer1989).
Correlations between cold scores and genetic markers
Gliadin and HMW-glutenin protein fragments and 33 segregating RAPD loci obtained in the analysis were correlated with the cold responses of RILs according to Spearman correlation rho (r) by using IBM SPSS version 22.
Results
Cold tolerance evaluation in field and under controlled conditions
Genetic variation
The differences among RILs in terms of their cold tolerance were statistically significant in the tests carried out in Haymana (COLDH) and Yenimahalle (COLDY) (at P < 0.01 level) and in Sivas-Ulaş (COLDU) (at P < 0.05 level) according to ANOVA. The component of variance due to RILs was moderately high for all tested sites; however, when the component of total variance between three tested sites compared, COLDY (CV = 47.2%) had a higher percentage than in COLDH and COLDU (CV = 31.3% and CV = 19.1% respectively) (Table 3, panel A).
Table 3. Mean squares, component of variance as a % of total variance (CV) and heritabilities

Panel A is for the cold tests carried out in three locations: COLDH, COLDU and COLDY. Panel B is for the Fv/Fm ratio determined at four different temperatures (+10, −5, −10 and −15 °C) in the controlled environment.
Fv/Fm, ratio of the variable fluorescence to maximum fluorescence; COLDU, Sivas-Ulaş Directorate of Agricultural Management Research Field; COLDH, concrete bed in the research field of Central Research Institute for Field Crops (CRIFC) in Ankara-Haymana; COLDY, research field of CRIFC in Ankara-Yenimahalle; ns: not significant.
*Significant at P < 0.05 level; **significant at P < 0.01 level.
Because of the differences in the lowest temperatures recorded in the three test locations, response ranges of the RILs in the 0–9 scale have also shown differences among the locations. According to the mean values of three replications in the test fields, RILs responded within the ranges of 1.00–4.33, 2.00–6.00 and 4.33–8.00 scores in COLDH, COLDU and COLDY, respectively (Fig. 2).
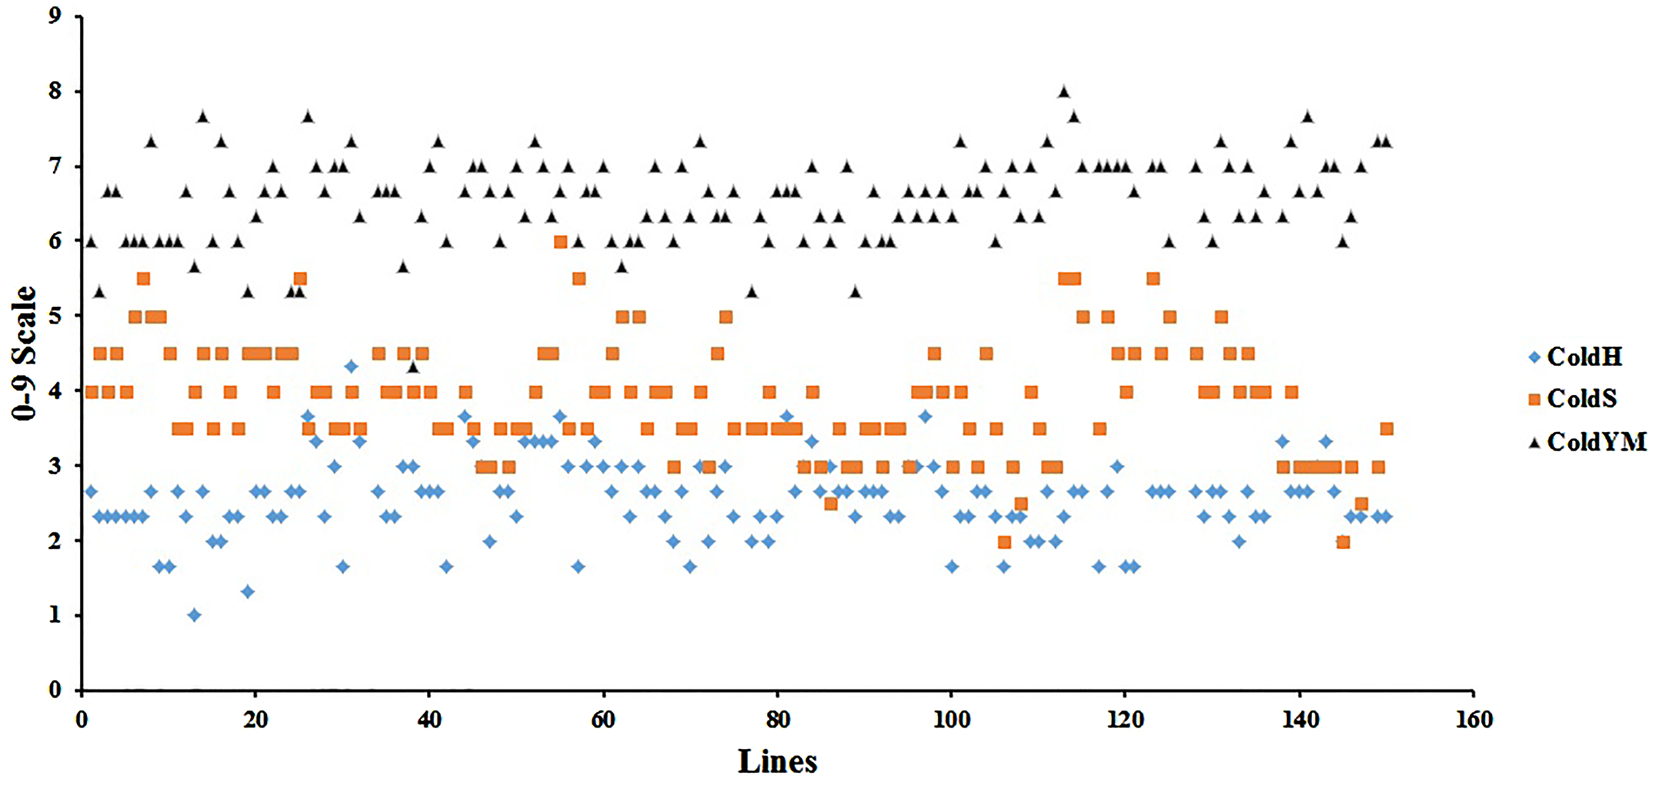
Fig. 2. (Colour online) Scattered diagram of 141 RILs derived from Kunduru-1149 × Cham-1 cross in 0–9 scale evaluation of cold tolerance; in Ankara-Haymana (COLDH), Sivas-Ulaş (COLDU) and Ankara-Yenimahalle (COLDY) test locations.
The RILs displayed higher resistant scores in COLDH, where 124 lines (87.94%) responded to the cold with the scores between 1 and 3, while the rest of the lines (17) (12.06%) responded with the scores higher than 3. In COLDU, 29 lines (20.57%) scattered between the scores 2 and 3, while the rest of the lines (112) (79.43%) showed the scores higher than 3. In COLDY, 36 lines (25.53%) responded to the cold with the scores between 4.33 and 6, and the rest of the lines (105) (74.47%) responded with the scores higher than 6 (Fig. 2).
The estimated mean values of Fv/Fm ratio were in the ranges of 0.62–0.76, 0.25–0.53 and 0.16–0.37 for −5, −10 and −15 °C, respectively (data not given). The Fv/Fm ratio values of all the RILs at +10 °C varied within the range of only 0.72 and 0.78 (Fig. 3). For Fv/Fm ratio values, 70.92% of the RILs (100) scattered between 0.62 and 0.69, while 29.08% of the RILs (41) scattered between 0.70 and 0.76 at −5 °C; 87.94% of the RILs (124) responded within the range of 0.25 and 0.49 at −10 °C, while 12.06% of the RILs (17) responded within the range of 0.50 and 0.55; 81.94% of the RILs (132) have taken values between 0.16 and 0.29, whereas 6.38% of the RILs (9) have taken between 0.30 and 0.37 at −15 °C (Fig. 3).

Fig. 3. (Colour online) Scattered diagram of 141 RILs derived from Kunduru-1149 × Cham-1 cross in cold tolerance evaluation by using Fv/Fm ratio at +10, −5, −10 and −15 °C.
The component of total variance for the Fv/Fm ratio attributable to RILs was calculated as 6.8, 7.5 and 12.7% at −5, −10 and −15 °C, respectively, while for +10 °C, which was the good temperature for growing all the RILs, was not significant (Table 3, panel B).
Heritabilities
Heritabilities (h 2) for cold tolerance in durum wheat lines ranged from moderate (0.32) in the COLDU test site to high (0.76) in COLDY (Table 3, panel A). On the other hand, the heritabilities estimated for the Fv/Fm ratio at low temperatures (−5, −10 °C and −15 °C) were low ranging from 0.20 in the Fv/Fm ratio (−10 °C) to 0.30 in the Fv/Fm ratio (−15 °C) (Table 3, panel B).
Correlations between cold scores and quality parameters
The results of analyses indicated that meaningful genetic correlations were observed between cold scores in COLDH, COLDU and COLDY and some quality parameters. The quality parameter MC, and OK% had negative correlation values with cold scores in COLDH as r S = −0.203, P = 0.016 at P < 0.05 and r S = −0.200, P = 0.018 at P < 0.01, while cold scores in COLDH had positive correlations with YP as r S = 0.248, P = 0.003 at P < 0.01, respectively (Table 4). The quality traits wet-TKW and dry-TKW had negative and same correlation values (r S = −0.245, P = 0.003 at P < 0.01) for cold scores in COLDU, while they had negative and same correlation values (r S = −0.225, P = 0.007 at P < 0.01) for cold scores in COLDY. In addition, cold scores in COLDU had positive correlation value with the quality parameter POK% (r S = 0.221, P = 0.008 at P < 0.01) (Table 4). The cold scores in COLDH had positive correlation with YP as r S = 0.235, P = 0.005 at P < 0.01.
Table 4. The Spearman (S) correlation values between cold tolerance scores obtained by 0–9 evaluation scale and quality parameters' scores
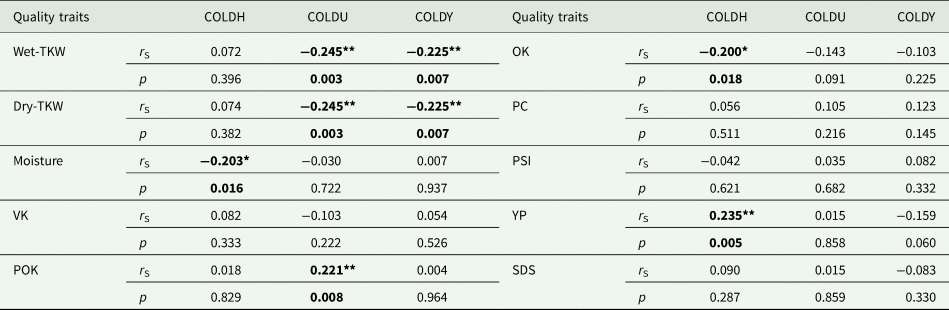
COLDU, Sivas-Ulaş Directorate of Agricultural Management Research Field; COLDH, concrete bed in the research field of Central Research Institute for Field Crops (CRIFC) in Ankara-Haymana; COLDY, research field of CRIFC in Ankara-Yenimahalle; TKW, thousand kernel weight; VK, vitreous kernel; OK, opaque kernel; POK, partly opaque kernel; PC, protein content; PSI, particle size index; YP, yellow pigment; SDS: sodium dodecyl sulphate sedimentation.
*significant at P < 0.05 level; **significant at P < 0.01 level.
The correlation values between Fv/Fm ratios and quality parameters indicated some interesting results (Table 5). Wet-TKW and dry-TKW parameters had negative correlations with Fv/Fm +10 °C (B-) and the correlation values are same as r S = −0.231, P = 0.006 at P < 0.01. The highest correlation value was observed as r g = 0.305, P = 0.000 at P < 0.01 between Fv/Fm −5 °C and YP. Fv/Fm −5 °C had negative correlation with protein content as r S = −0.296, P = 0.000 at P < 0.01. Fv/Fm −10 °C and Fv/Fm −15 °C had positive correlation values with moisture content as r S = 0.169, P = 0.045 at P < 0.05 and r S = 0.177, P = 0.035 at P < 0.05, respectively.
Table 5. The Spearman (S) correlation values between Fv/Fm ratios obtained at different temperatures and quality parameters' scores
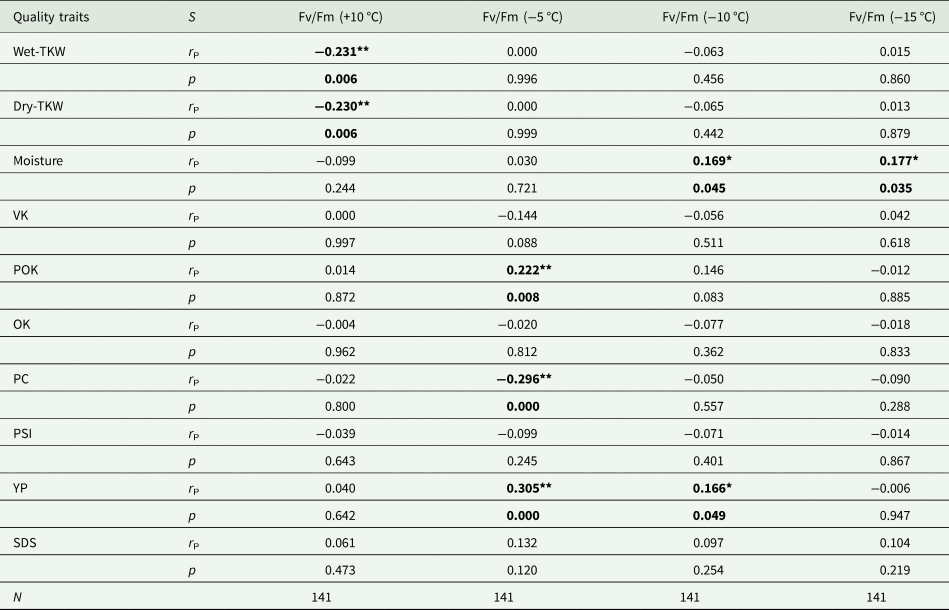
Fv/Fm, ratio of the variable fluorescence to maximum fluorescence; TKW, thousand kernel weight; VK, vitreous kernel; OK, opaque kernel; POK, partly opaque kernel; PC, protein content; PSI, particle size index; YP, yellow pigment; SDS, sodium dodecyl sulphate sedimentation.
*Significant at P < 0.05 level; **significant at P < 0.01 level.
Correlations between cold scores and gluten proteins
Correlations between gliadin and HMW-glutenin subunits (data not given), and cold scores of 141 RILs indicated that ω-gliadin fragment 5 had negative correlation (r S = −0.294, P = 0.00 at P < 0.01) with cold scores in COLDH, while one of the γ-gliadin triplet (fragment 12) had negative correlation (r S = −0.167, P = 0.048 at P < 0.05) with cold scores in COLDU (Table S3). In α-gliadin region, five gliadin fragments (25–29) had negative correlations with cold scores in COLDU as (r S = −0.203, P = 0.016 at P < 0.05, r S = −0.203, P = 0.016 at P < 0.05, r S = −0.199, P = 0.018 at P < 0.05, r S = −0.199, P = 0.018 at P < 0.05, r S = −0.199, P = 0.018 at P < 0.05), respectively. HMW-glutenin subunits did not have any correlation with cold scores in three test locations. ω-Gliadin fragments 6 and 12 had negative correlations with the Fv/Fw ratio at −5 °C as r S = −0.167, P = 0.048 at P < 0.05 and r S = −0.219, P = 0.009 at P < 0.05, respectively. In α-gliadin region five fragments (25–29) displayed negative correlations (r S = −0.166, P = 0.048 at P < 0.05, r S = −0.166, P = 0.048 at P < 0.05, r S = −0.168, P = 0.047 at P < 0.05, r S = −0.168, P = 0.047 at P < 0.05, and r S = −0.168, P = 0.047 at P < 0.05, respectively) with the Fv/Fm ratio (−5 °C). HMW-glutenin proteins did not have any correlation with Fv/Fw ratios in three test locations.
Correlations between cold scores and RAPD loci
The RAPD locus E-13/1100 had positive correlations with cold scores in COLDH, COLDU and COLDY (r S = 0.167, P = 0.047 at P < 0.05, r S = 0.207, P = 0.014 at P < 0.05, r S = 0.249, P = 0.003 at P < 0.01, respectively) (Table S4). The RAPD locus E-13/900 showed positive correlations with cold scores in COLDH and COLDY (r S = 0.205, P = 0.015 at P < 0.05, r S = 0.259, P = 0.001 at P < 0.01, respectively), while the RAPD locus K-9/500 displayed positive correlation with cold scores in COLDU (r S = 0.193, P = 0.022 at P < 0.05).
The RAPD loci B-11/730, B11/510, C-7/1800, C-7/1600, C-7/1450 and L-3/500 had positive correlations (r S = 0.176, P = 0.037 at P < 0.05, r S = 0.240, P = 0.004 at P < 0.01, r S = 0.244, P = 0.004 at P < 0.01, r S = 0.193, P = 0.022 at P < 0.05, r S = 0.185, P = 0.028 at P < 0.05, r S = 0.284, P = 0.001 at P < 0.01 and r S = 0.187, P = 0.026 at P < 0.05, respectively) with cold scores in COLDY.
The correlations between RAPD loci and Fv/Fw ratios indicated that C-7/1600, C-7/1450 and L-3/500 had negative correlations (r S = −0.237, P = 0.005 at P < 0.01, r S = −0.188, P = 0.025 at P < 0.05, r S = −0.228, P = 0.007 at P < 0.01, respectively) with Fv/Fw ratios at −15 °C.
Discussion
The results indicated that a considerable amount of genetic variation observed was consistent with the results of Mekhlouf et al. (Reference Mekhlouf, Dehbi, Bouzerzour, Hannchi, Benmahammed and Adjabi2006). In addition, considerably higher components of variance due to genotypes and heritability estimates were determined for the tests carried out in three test locations. When the heritability results compared, it seemed that cold tolerance observations in the field indicated that the effect of genotype on the expression of phenotype was considerably high in COLDH and COLDU, whereas in COLDY, the effect of environment on the expression of phenotype was higher than genotype. Heritability results of cold tolerance in a controlled environment displayed that the effect of environment on the expression of phenotype was higher than genotypes. Therefore, studies for cold tolerance might be performed both in the field and in the controlled environment.
Many drawbacks of field tests were encountered as discussed in Sutka (Reference Sutka1981), since survival is determined not only by cold damage to the tillering node of the plant, but also by other factors such as diseases, pushing out, water deficit, etc., or by interactions between these factors, it is very difficult to be certain on the cold tests carried out in the field. The use of a 0–9 scale as a qualitative evaluation, which is commonly used in cold-breeding programmes of many institutes is the other drawback of field tests performed as well in the current study. The drawbacks of the cold tests performed under the field conditions using a 0–9 scale were compensated by the tests carried out under controlled environmental conditions.
According to the 0–9 scale, score 4 represents 35–45% cold damage and the values up to score 4 can be considered as cold tolerant for RILs in the current study. In COLDH, lines 9, 10, 13, 19, 30, 42, 57, 70, 100, 117, 120 and 121 displayed the scores between 1 and 1.7, thus they can be considered as the most tolerant lines to cold. In COLDU, lines 106, 145, 86, 108 and 147 showed cold response scores between 2 and 2.5, while in COLDY, all the lines showed cold response scores higher than the score 4. These results are consistent with the lowest temperatures, −9.1, −12.8 and −15.2 °C observed in COLDH, COLDU and COLDY, respectively. In total, the 17 most tolerant RILs to cold are determined and these RILs could be managed as breeding material for further studies of crop improvement programmes.
The severe effects of cold damage upon a decrease in temperature could be seen clearly in the scattered diagram of Fv/Fm ratios at +10, −5, −10 and −15 °C in Fig. 3. The Fv/Fm ratio values displayed at −5 °C by some of the RILs might be considered as in the range of 0.79–0.84, which is the approximate optimal value for many plant species, with lowered values indicating plant stress (Kitajima and Butler, Reference Kitajima and Butler1975; Demmig and Björkman, Reference Demmig and Björkman1987; Maxwell and Johnson, Reference Maxwell and Johnson2000; Murchie and Lawson, Reference Murchie and Lawson2013). If the RILs with equal or higher than the score 0.70 are considered as cold resistant, 41 RILs might have the potential for further durum wheat-breeding studies to develop new cold-resistant durum varieties.
According to the 0–9 scale cold damage and the evaluation values of Fv/Fm ratio, three test locations varied from each other at a considerably high level. Thus, the cold tolerance trait expressed differently in different test sites indicates that the test carried out in one site may not be adequate to select the cold-tolerant RILs. Therefore, besides the low temperature, other types of stress factors might also be considered and for trials, at least two locations might be recommended for the reliability of the results. Moreover, quantitative evaluation of chlorophyll damage due to low temperature created in the controlled environment of growth chamber by a chlorofluorometer was experienced as the quicker and more reliable method in cold studies (Clement and Van Hasselt, Reference Clement and Van Hasselt1996).
The temperatures close to the lowest temperatures recorded in the field trials (−9.1 °C in COLDH and −15.2 °C in COLDY) were −10 and −15 °C, which were selected as test temperatures, and the damage at these temperatures in the growth chamber occurred more severely. This can be explained by the impossibility of mimicking the exact field conditions in the growth chamber in test boxes. However, −5 °C can be recommended as the best test temperature to determine the response of the material to cold in the growth chamber. In contrast, Rizza et al. (Reference Rizza, Pagani, Stanca and Cattivelli2001) reported that −12 °C was the most appropriate stress temperature to measure the differences among the genotypes in oat cultivars.
It was reported that some gliadin genes of wheat had linkage with frost tolerance genes (Šašek et al., Reference Šašek, Černý and Hanišová1984, Reference Šašek, Prášilová, Černý, Prášil and Skupinová2000; Sozinov, Reference Sozinov1985; Černý et al., Reference Černý, Prášil and Šašek1990: cited in Prášil et al., Reference Prášil, Prášilová, Šašek and Černý2002). Gli-1D5 and Gli-6A3 were described as primary markers for frost tolerance, while Gli-6D2, Gli-1B1 and Gli-6A1 were described as secondary markers of frost tolerance. It was also confirmed that they had additive effects on frost tolerance and low frost tolerance linkage was reported with some gliadin alleles (Gli-6A2, Gli-1B4 and Gli-1B5) (Šašek et al., Reference Šašek, Prášilová, Černý, Prášil and Skupinová2000: cited in Prášil et al., Reference Prášil, Prášilová, Šašek and Černý2002). Some correlations between cold tolerance and some gliadin fragments might be an indication of potential cold tolerance but, further detailed investigations needed to be performed. However, it was not observed any correlation between HMW-glutenin subunits and cold tolerance, while Witkowski et al. (Reference Witkowski, Waga, Witkowska, Rapacz, Gut, Bielawska, Luber and Lukaszewski2008) found that the SDS sedimentation value, resistance leaf blotch and frost tolerance (Naghavi et al., Reference Naghavi, Sofalian, Asghari and Sedghi2010) had statistically significant association with the status of the Glu-A1 locus, at which particularly null allele closely linked to the locus responsible for frost tolerance.
Molecular markers were used to determine their associations with traits such as cold resistance, drought tolerance, agronomic traits (grain yield, TKW and biomass yield, plant height, spike length, number of seeds per spike, etc.). The association between RAPDs and some traits was investigated in different plant species; such as drought tolerance in 20 bread wheat cultivars by Pakniyat and Tavakol (Reference Pakniyat and Tavakol2007); the frost tolerance in winter faba bean (Vicia faba L.) by Sallam and Martsch (Reference Sallam and Martsch2016); some agronomic traits in barley by Cheghamirza et al. (Reference Cheghamirza, Zarei, Zebarjadi and Honarmand2017). Some RAPD loci had positive correlations with cold evaluation values and variation fluorescence (Fv/Fm ratio) in three test locations as reported in previous studies, such as significant associations between freezing tolerance evaluation with field-laboratory method markers located on chromosome 5H in the region of gene Fr-H2 (bin9–10: Xbmag812, Xmwg2230) and the region of gene Fr-H1 (bin11: Xmwg514, HvBM5, Xmwg644) in barley reported by Rapacz et al. (Reference Rapacz, Tyrka, Gut and Mikulski2010). In addition, Rapacz et al. (Reference Rapacz, Tyrka, Gut and Mikulski2010) reported other significant associations with photochemical quenching of chlorophyll a fluorescence (qP) and PCR markers (Xpsr115 and Xmwg2062) and displayed the connection directly with the variation in the promoter region of Vrn-H1 (HvBM5) (cited in Akar et al., Reference Akar, Francia, Tondelli, Rizza, Stanca and Pecchioni2009) and freezing tolerance of plants partially de-acclimated in the field. Ganeva et al. (Reference Ganeva, Petrova, Landjeva, Todorovska, Kolev, Galiba, Szira and Bálint2013) used microsatellite loci to investigate their associations with frost tolerance and they found that the 176 bp allele at locus wmc327 tightly linked to Fr-A2 in cvs Milena, Pobeda, Sadovo-1, Mironovskaya-808 and Bezostaya-1.
Investigation of tolerance, to abiotic stresses, is one of the main goals for the crop improvement studies, many genes are concerned with tolerance to stress. Revealing the molecular and genetic basis of stress tolerance will help to identify the functional marker and then increase the efficiency of selection for improved abiotic stress tolerance (Mishra and Varghese, Reference Mishra, Varghese, Singh, Hanchinal, Singh, Sharma, Tyagi, Saharan and Sharma2012). Therefore, the RAPD loci, which had a positive correlation with cold evaluation values, might be used as candidate markers of cold tolerance for pre-selection of potential candidates for the development of new durum wheat varieties.
The low temperature negatively influences the traits OK, YP, wet-TKW and dry-TKW in the current study as in previous studies, a significant positive correlation between winter resistance and grain yield (Ruzgas and Liutkevičius, Reference Ruzgas and Liutkevičius2001) and influence of low temperature on starch damage and gliadin : glutenin ratios (Craven et al., Reference Craven, Barnard and Labuschagne2007) reported. Mohammadi et al. (Reference Mohammadi, Sadeghzadeh, Ahmadi, Bahrami and Amri2015) investigated the resistance to biotic and abiotic stress factors among 380 durum wheat collection. They identified that the landraces showed percentage reduction due to the stresses varied from 11.4% (yellow rust) to 21.6% (cold stress) for 1000-kernel weight and from 19.9% (yellow rust) to 91.9% (cold stress) for grain yield. It was also found that 0–9 scale cold evaluation values indicated that cold had a negative influence on some quality traits such as OK, moisture, wet-TKW and dry-TKW, while it had a positive effect on some traits such as POK and YP.
DNA markers such as a KASPar SNP assay is used for routine to screen Rht-B1b (Rht-1) or Rht-D1b (Rht-2), which control the semi-dwarf plant height in wheat in USDA Genotyping Labs (G. Brown-Guedria, 2013, unpublished: in Liu et al., Reference Liu, Maurer, Li, Tucker, Gowda, Weissmann, Hahn and Würschum2014a, Reference Liu, Rudd, Bai, Haley, Ibrahim, Xue, Hays, Graybosch, Devkota and Amand2014b); markers for photoperiod insensitive allele (Ppd-D1a) and the sensitive allele (Ppd-D1b) (Yang et al., Reference Yang, Zhang, Xia, Laurie, Yang and He2009: in Liu et al., Reference Liu, Maurer, Li, Tucker, Gowda, Weissmann, Hahn and Würschum2014a, Reference Liu, Rudd, Bai, Haley, Ibrahim, Xue, Hays, Graybosch, Devkota and Amand2014b); markers CDO708 and Vrn-D3F6/R8 were used to study Vrn-A1 and Vrn-D3 alleles for vernalization (Wang et al., Reference Wang, Carver and Yan2009; Chen et al., Reference Chen, Carver, Wang, Cao and Yan2010: in Liu et al., Reference Liu, Maurer, Li, Tucker, Gowda, Weissmann, Hahn and Würschum2014a, Reference Liu, Rudd, Bai, Haley, Ibrahim, Xue, Hays, Graybosch, Devkota and Amand2014b). Biochemical markers might have a close association with quantitative traits such as major quality traits of grain and flour protein and ash concentration, dough strength and extensibility, starch composition, grain hardness and end-use product colour are controlled by different genes, such as Glu and Gli loci, and some other genes (Liu et al., Reference Liu, Maurer, Li, Tucker, Gowda, Weissmann, Hahn and Würschum2014a, Reference Liu, Rudd, Bai, Haley, Ibrahim, Xue, Hays, Graybosch, Devkota and Amand2014b). Gluten proteins have large influence over both dough strength and extensibility (Payne, Reference Payne1987; Luo et al., Reference Luo, Griffin, Branlard and McNeil2001). Some of the gliadin and glutenin subunits proved to be good markers related to good bread-making and pasta quality (Payne et al., Reference Payne, Law and Mudd1980; Gupta and Shepherd, Reference Gupta, Shepherd, Miller and Koebner1988; Pogna et al., Reference Pogna, Autran, Mellini, Lafiandra and Feillet1990). Gliadin γ-42 was found to be related to poor quality, and gliadin γ-45 to good quality. Both biotic and abiotic stresses can affect wheat end-use quality (Graybosch et al., Reference Graybosch, Peterson, Baenziger and Shelton1995). Therefore, DNA and biochemical markers, which have close association with quantitative traits could be used efficiently for preliminary research studies.
The current comparative results could be used efficiently in durum wheat-breeding programmes, which aim to develop cold tolerant varieties for the durum production areas suffering from severe cold damages. Especially the RILs, which were considered as cold tolerant, which selected at −5 °C in the growth chamber, could very confidently be used in cold tolerance improvement of durum wheat-breeding programmes.
Conclusion
It was concluded that the temperature at −5 °C in the growth chamber is the good temperature for pre-selection of cold-resistant lines. The RILs displayed great variation in expression of cold resistance in three different test locations at the same temperatures, thus not only temperature but also other associated factors also should be taken account to determine the cold responses of plants. DNA and biochemical markers might have a close association with quantitative traits could be used efficiently for preliminary research studies. For evaluation of cold tolerance, 0–9 scale and Fv/Fm ratios are reliable, practical and cost effective methods, which could be used efficiently.
Supplementary material
The supplementary material for this article can be found at https://doi.org/10.1017/S0021859620000155.
Financial support
This study was supported by WANADDIN Project and the Scientific Research Projects Coordination Unit of Middle East Technical University (Project No. AFP-98-06-02-00-10 and partially funded by Project No. AFP-01-11-98-08-05).
Conflict of interest
The authors declare that they have no competing interests.
Ethical standards
This paper does not contain any studies involving animals or human participants performed by any of the authors.


