


Introduction
Water limitation is the most serious constraint threatening China's food security (Wallace and Gregory, Reference Wallace and Gregory2002). With the progress of society, water shortages and unbalanced spatial distribution of water resources are aggravating ecological degradation in China (Ge et al., Reference Ge, Xie, Zhang, Li, Qi, Cao and He2011). Sustainable water supply in agriculture will face challenges and tests with increasing water demand in industrial and domestic production (Ito and Ni, Reference Ito and Ni2013; Cao et al., Reference Cao, Wu, Guo, Zheng, Gong, Wu and Wang2017). Improving efficiency in the use of agricultural water resources is regarded as a fundamental measure for ensuring food and water security (Nhan et al., Reference Nhan, Hoa, Qui, Huy, Huu, Macdonald and Tuong2016).
A growing body of parameters related to water utilization performance in agricultural production, such as water use (WU), blue and green water, irrigation efficiency (E i), water productivity (WP), crop water footprint (CWF) and virtual water content (VWC), has been expounded and studied (Molden, Reference Molden2007; Sun et al., Reference Sun, Wu, Wang and Zhao2013b; Wang et al., Reference Wang, Wu, Engel and Sun2014, Reference Wang, Wu, Engel and Sun2015; Cao et al., Reference Cao, Wang, Wu, Zhao and Wang2015a). Blue water refers to liquid water in rivers, lakes, wetlands and aquifers, which can be withdrawn for irrigation and other human uses, while green water is soil water held in the unsaturated zone, formed by precipitation and available to plants (Cao et al., Reference Cao, Wu, Wang and Zhao2014a). Irrigation efficiency is a complex and useful measure for irrigation performance and can be expressed by various indicators, such as classical, net or effective irrigation efficiency (Jensen, Reference Jensen2007; Scott et al., Reference Scott, Vicuña, Blanco-Gutiérrez, Meza and Varela-Ortega2014). Of all the concepts and indicators associated with agricultural water management, WP lies in the centre (Molden, Reference Molden1997; Bouman, Reference Bouman2007; Cao et al., Reference Cao, Wang, Wu and Zhao2015b). In general, agricultural WP is used to evaluate the relationship between the amount of crop produced and the amount of water invested in crop production, which is generally expressed as the amount of marketable product in relation to the amount of water input (Molden, Reference Molden1997). WP could be assessed from multiple perspectives resulting from different water input options (Rodrigues and Pereira, Reference Rodrigues and Pereira2009). Crop WP (CWP) is the ratio of regional yield to field evapotranspiration (ET), also known as consumptive WU (CWU) and also regarded as WU efficiency (WUE). CWF (sometimes called VWC) and CWP are reciprocal, and the advantage of the former is to distinguish between blue and green water in WU evaluation (Sun et al., Reference Sun, Wu, Wang and Zhao2013b; Cao et al., Reference Cao, Wu, Wang and Zhao2014a). Taking irrigation and rainfall into account, CWP at the national and global scale has been studied widely (Zwart and Bastiaanssen, Reference Zwart and Bastiaanssen2004; Zwart et al., Reference Zwart, Bastiaanssen, Fraiture and Molden2010), including in China. Furthermore, the effects of irrigation on crop yield, WU and WP in macro-scale areas have also been examined (Wang et al., Reference Wang, Wu, Engel and Sun2014; Cao et al., Reference Cao, Ren, Wu, Guo, Wang and Wang2018). Liu et al. (Reference Liu, Wiberg, Zehnder and Yang2007) simulated the role of irrigation in winter wheat yield and CWP in China using a geographic information system (GIS)-based crop model. Based on a crop model coupled statistics approach, Cao et al. (Reference Cao, Wu, Wang and Zhao2014b, Reference Cao, Wang, Wu, Zhao and Wang2015a) evaluated the CWP of main grain crops for irrigated and rain-fed farmland in China. However, as the loss of irrigation water was not included during the transfer process from the original sources to target field, this affected the efficiency of irrigation water greatly. Another disadvantage of CWP in water resource management is caused by the complex components of water consumption such as irrigation, blue water and green water. Blue and green water are difficult to distinguish from CWP because its method of calculation is based on ET, which combines precipitation with irrigation water (Wang et al., Reference Wang, Wu, Engel and Sun2014).
Maize is one of the three major cereal crops in China and accounts for about 0.36 of national total grain production. Maize production and water resources appropriation play an important role in national food, water and even ecological security strategies in China. Crop water consumption and WP of maize can be accurately measured and calculated according to plot experiments and based on water balance principles (Irmak, Reference Irmak2015; Mao et al., Reference Mao, Zhong, Wang and Zhou2017). For an irrigation district, observation data and statistics are often combined in WP evaluation (Berger et al., Reference Berger, McDonald and Riha2010; Wang et al., Reference Wang, Zhou and Chen2016). Climatic conditions and agricultural production are associated closely with spatial and temporal distribution of WP, so the impact of temporal climate and agricultural input changes on crop yield and WP of maize from a regional to global level have been reported widely (Sun et al., Reference Sun, Wu, Wang, Zhao, Liu and Zhang2013a; Xiao et al., Reference Xiao, Zheng, Qiu and Yao2013; Yin et al., Reference Yin, Jabloun, Olesen, Ozturk, Wang and Chen2016). In contrast, spatial correlations between WP and agricultural inputs have seldom been investigated. Therefore, the present study bridges the gap by calculating green and blue WU (BWU) and WP of maize at the level of provinces, autonomous regions and municipalities (PAMs) in China.
The objectives of the present study were to investigate temporal variation and spatial distribution of crop–water relationship and to determine how the specific agricultural input is related to WP using partial least squares regression (PLSR). On this basis, the role of maize in China's sustainable utilization of agricultural water resources approach is discussed.
Materials and methods
Data resources
The present study used statistics from 1998 to 2010. Irrigation water capacity, crop yield, E i and irrigated area from the administration bureaus of 459 irrigation districts in 31 PAMs were collected (Fig. 1). Climate data for 31 PAMs in China were acquired from the China Meteorological Data Sharing Service System (http://data.cma.cn), which included daily maximum temperature (T max), daily minimum temperature (T min), average temperature (T), daily precipitation (P), solar radiation (R), relative humidity (H), wind speed (S w) and sunshine hours (H s). The provincial crop yield, sown area, irrigation area as well as the agricultural input fertilizer rate (F), dosage of pesticide (PES) and agricultural machinery power per sown area (GAMP) were referenced from the National Bureau of Statistics of China (1999–2011). The crop coefficient (K c) of maize during the growth period for both irrigated and rain-fed croplands was referenced from Chen et al. (Reference Chen, Guo, Wang, Kang, Luo and Zhang1995) and Duan et al. (Reference Duan, Sun, Liu, Xiao, Liu and Qi2004). Regional K c was the average of all sites investigated. The growth periods of maize from 180 agricultural observation stations were supplied by the Farmland Irrigation Research Institute, Chinese Academy of Agricultural Sciences.
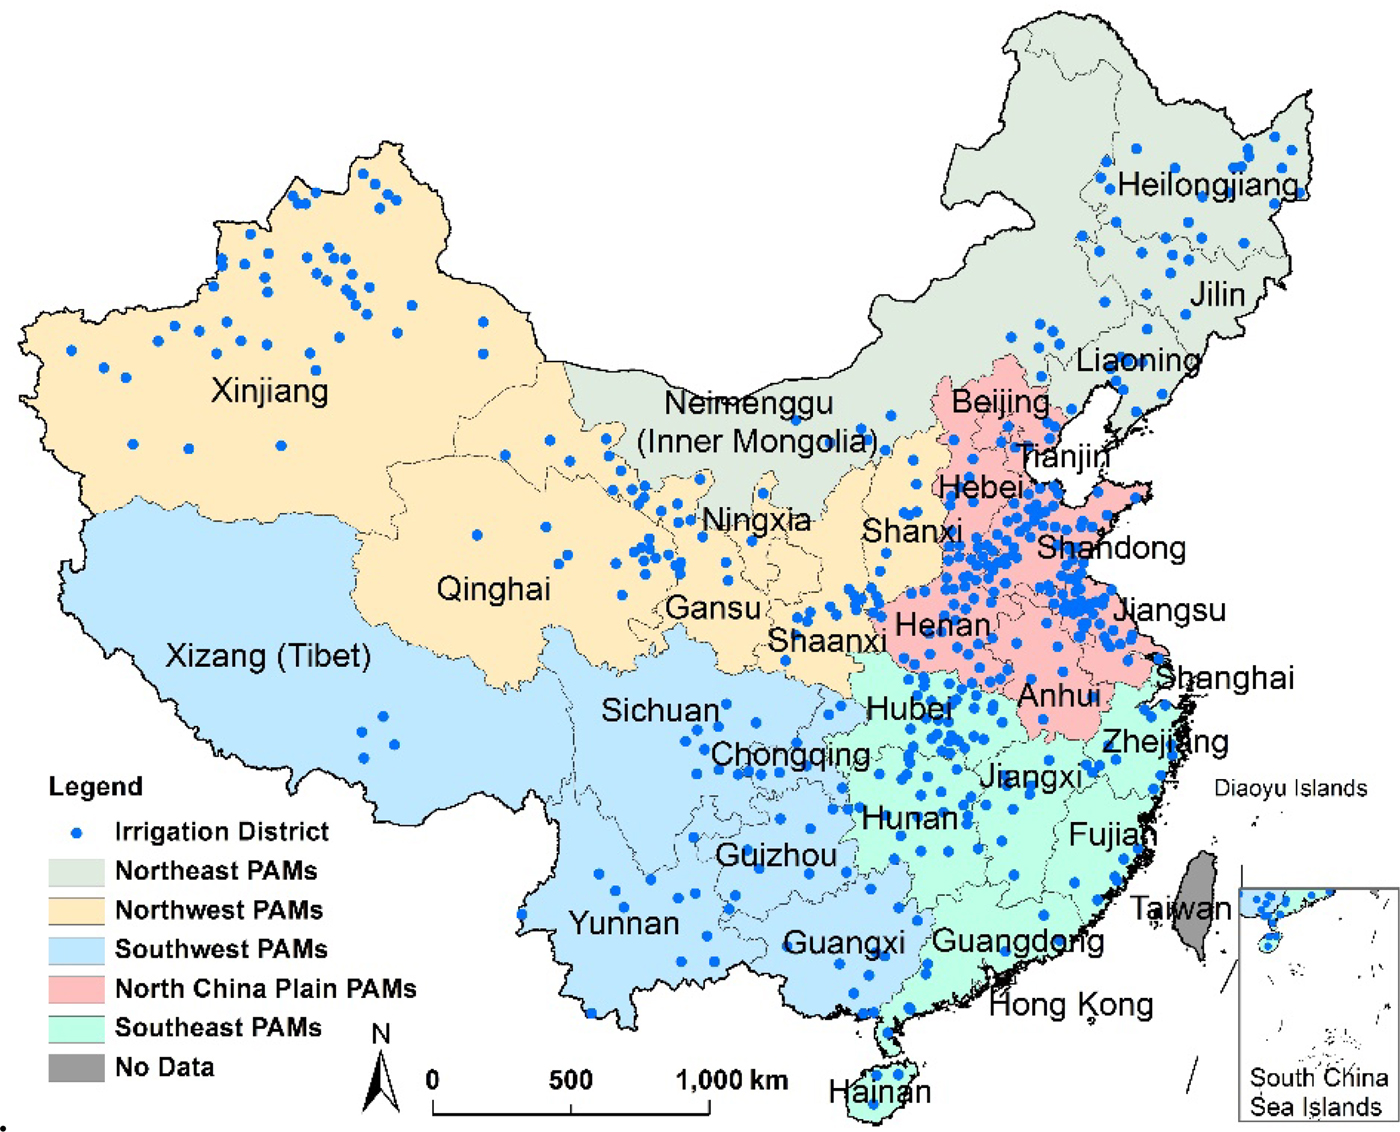
Fig. 1. Distribution of 459 irrigation districts and regional delimitation. Colour online.
Water use and productivity calculation
WP is defined as:
 $$WP = O/WU$$
where WP is the generalized WP for crop productivity (kg/m3), O is the regional total output of maize product (kg) and WU is the blue and green water use (m3) in the process of crop production. Only effective precipitation (P e) was consumed in the rain-fed cropland and the amount of rain-fed WU (WU R) was estimated as:
 $$WU_{\rm R} = {\rm10} \times A \times {\rm Min(}ET_{\rm c}{\rm,} P_{\rm e}{\rm )}$$
where ‘10’ is used for unit conversion; A is the area sown in ha; ET c is the crop water requirement in mm and P e is the effective precipitation during the crop growth period in mm. The actual ET c, which was also called CWU, was calculated using Eqn (3):
 $$ET_{\rm c}= K_{\rm c} \times ET_{\rm 0}$$
where ET 0 is the reference crop ET (mm), which was calculated according to the FAO Penman–Monteith equation (Allen et al., Reference Allen, Pereira, Raes and Smith1998):
 $$ET_0 = \displaystyle{{0{\cdot}408\Delta (R_n - G) + \gamma \times \displaystyle{{900} \over {T + 273}} \times u_2 \times (e_{\rm s} - e_{\rm a})} \over {\Delta + \gamma (1 + 0.34u_2)}}$$
where Δ is the slope of the vapour pressure curve (kPa/°C); R n is the net radiation (MJ/m2 d); G is the soil heat flux density (MJ/m2 d); γ is the psychrometric constant (kPa/°C); T is the average air temperature (°C); u 2 is the wind speed measured at 2 m above the ground level (m/s); e s is the saturation vapour pressure (kPa) and e a is the actual vapour pressure (kPa).
The simple approximation recommended by the FAO has been cited by numerous studies and crop models (Cao et al., Reference Cao, Wang, Wu, Zhao and Wang2015a) and has also been used for P e estimation, for both rain-fed and irrigated crops:
 $$P_{\rm e} = \left\{ {\matrix{{P \times (4.17 - 0.02P)/4.17,} & {P \lt 83} \cr {41.7 + 0.1P,} & {P \gt 83} \cr } } \right.$$
where P is the precipitation during the crop growth period (mm). Green water used in irrigated (GWC I) and rain-fed (GWC R) croplands was estimated with Eqns (6) and (7), without considering the changes of soil moisture content during the growth period:
 $$GWC_{\rm I} = P_{\rm e} \times A_{\rm I}$$
 $$GWC_{\rm R} = P_{\rm e} \times A_{\rm R}$$
where A I and A R are the areas of irrigated and rain-fed croplands (ha). The WU in irrigation system (WU I) was calculated as follows:
 $$WU_{\rm I}= GWC_{\rm I}+ BWU$$
BWU was obtained by balancing the crop irrigation water requirement (IWR), with E i collected from irrigation districts:
 $$BWU = {\rm} IWR/E_{\rm i}$$
 $$IWR{\rm} = ET_{\rm c} - {\rm} P_{\rm e}$$
BWU here contained field ET and transfer loss of irrigation water and could reflect WU efficiency in fields and irrigation efficiency simultaneously. So, regional WU was the sum of WU R and WU I:
 $$WU = WU_{\rm R}+ WU_{\rm I}$$
Transfer loss of irrigation water was included in WP calculations and this was the difference between CWP and this indicator. The composition of WU in agricultural production had important implications for regional water resource management. WU composition in the present study was assessed from the blue-green and consumptive-transfer loss perspectives:
 $$GP = \left( {GWC_{\rm I} + GWC_{\rm R}} \right)/WU$$
 $$CP = \left( {GWC_{\rm I} + IWR + WU_{\rm R}} \right)/WU$$
where GP and CP are green water proportion and CWU proportion of total WU, respectively. Blue–green composition revealed the source constitution and consumptive-transfer loss explained the utilization approach of agricultural water resources.
Partial least squares regression
PLSR is an alternative to ordinary regression for problems with partly or highly co-linear predictor variables and is also particularly suitable for multivariate problems when the number of observations is less than the number of possible predictors (Carrascal et al., Reference Carrascal, Galvan and Gordo2009; Huang et al., Reference Huang, Shi, Zhu, Zhang, Ai and Yin2016). Considering co-varying environmental factors, a PLSR model was constructed to identify the main variables that are highly co-related to WP. The variables (factors) designated for PLSR assessment here are H, T, P, R, F, PES, GAMP, E i and irrigation rate (R i). To overcome the problem of over-fitting and to achieve an optimal balance between the explained variation in the response (R 2) and the predictive ability of the model (goodness of prediction: Q 2), an appropriate number of components in the PLSR model was determined by cross-validation (Carrascal et al., Reference Carrascal, Galvan and Gordo2009). When Q 2 was >0.5, the model was considered to have good predictive ability. In a PLSR model, the importance of a predictor for independent and dependent variables is given by the variable importance for the projection (VIP), which is calculated by the projection regression principle (Huang et al., Reference Huang, Shi, Zhu, Zhang, Ai and Yin2016). Terms with large VIP values are most relevant for explaining the dependent variable. The regression coefficients (RC) reveal the direction and strength of the impact of each variable in the PLSR model. The Agostino–Pearson K 2 test was chosen to test whether all of the variables were normally distributed. Whenever necessary, the predictors were log-transformed to achieve a normal distribution. In the present study, PLSR was performed using SIMCA-P+13.0 (Umetrics, Reference Umetrics2012).
Results
Water resources use in maize production
China produced 149.91 Mt of maize annually in 1998 to 2010 and used 138.56 Gm3 water resources (34.06 Gm3 irrigation water and 104.50 Gm3 rainfall). Green water dominated the water resources in maize production in China. About 0.580 of crop production and 0.619 of water resources come from farmland equipped with irrigation. The parameters on maize production and water resources utilization for 31 PAMs during 1998–2010 were calculated (Table 1).
Table 1. Provincial WU for maize production during 1998–2010

PAMs, provinces, autonomous regions and municipalities; WU I, water use in irrigated cropland; WU R, water use in rain-fed cropland.
With large spatial differences, maize production was concentrated in North China Plain and Northeast and Southwest China. Five PAMs (Heilongjiang, Shandong, Hebei, Jilin and Henan) together took up almost half (0.495) of the national maize sown area and produced 0.521 of the total maize in China. Inner Mongolia, Liaoning, Sichuan, Yunnan, Shanxi and Shaanxi also played an important role (Table 1) in China's maize production (proportion of production >0.030). Both sown area and production (output) proportions in 12 PAMs, including Hunan, Ningxia, Beijing, Tianjin, Guangdong, Zhejiang, Fujian, Qinghai, Jiangxi, Hainan, Shanghai and Tibet, were <0.010. Crop yield ranged from 3.31 t/ha in Fujian to 7.07 t/ha in Ningxia and crop yields were above the national value (5.33 t/ha) in only nine PAMs. WU in Jilin for maize production was estimated to be 17.49 Gm3, ranking the highest of the 31 PAMs, while WU in five other PAMs (Shandong, Heilongjiang, Henan, Hebei and Liaoning) exceeded 10.00 Gm3. In contrast, WU in Hainan, Jiangxi, Shanghai and Tibet did not exceed 0.10 Gm3 WU. However, WU in the rain-fed cropland (WU R) in Heilongjiang and Jilin were estimated as >7 Gm3, higher than in those in the other regions. Also, a large amount of WU in the irrigated system (WU I) was found in Liaoning (7.64 Gm3), Henan (8.94 Gm3), Jilin (9.81 Gm3), Hebei (9.85 Gm3) and Shandong (11.69 Gm3). BWU in Xinjiang, Liaoning, Heilongjiang, Henan, Inner Mongolia and Jilin was 2.00–5.00 Gm3, and the WU was <1.00 Gm3 in the remaining PAMs except Shanxi.
Composition of water use
National GP in 1998, 2005 and 2010 was estimated as 0.764, 0.753 and 0.747, respectively. At the same time, CP was calculated to be 0.863, 0.862 and 0.872 in the selected years. Precipitation played a dominant role in total WU for maize production in China, which was mainly consumed in the form of field ET. Similar to the national value, provincial GP and CP varied very little among these 13 years.
The spatial distribution pattern of GP and CP was similar (Fig. 2): PAMs located in the northeast and middle–lower part of Yellow River and Yangtze River had high green water and consumptive water proportions, while blue water input and irrigation water loss in the delivery process took a large proportion in northwest PAMs. From 1998–2010, the largest GPs for maize production were found in the regions along the Yangtze River such as Sichuan (0.894), Guizhou (0.893), Hainan (0.867), Chongqing (0.864) and Jiangxi (0.856). Other PAMs above 0.800 were Yunnan, Heilongjiang, Beijing, Zhejiang, Guangxi, Liaoning, Shaanxi, Hubei, Shanxi and Jilin. The two provinces Henan and Hunan also exceeded the national value (0.755). The ratio ranged from 0.600 to 0.700 in eight PAMs located in the North China Plain and eastern coastal areas and below 0.500 in the arid areas of Ningxia and Xinjiang. Sichuan's proportion of CWU in WU for the total cropland in maize production reached up to 0.943 and ranked the highest of all in the whole country. CWP accounted for >0.900 of the WU in other 11 PAMs, including Guizhou, Beijing, Hainan, Yunnan, Chongqing, Heilongjiang, Jiangxi, Liaoning, Shaanxi, Zhejiang and Jilin. Hubei, Guangxi and Shanxi also held a CP higher than the national value of 0.866, while CP was lowest in Neimenggu, Qinghai, Ningxia and Xinjiang due to a large amount of irrigation water withdrawal and transfer loss. Irrigation systems remained dominant in crop production and WU, so the compositions of water resources used in the irrigated farmland is significant for maize–water relationship assessment.
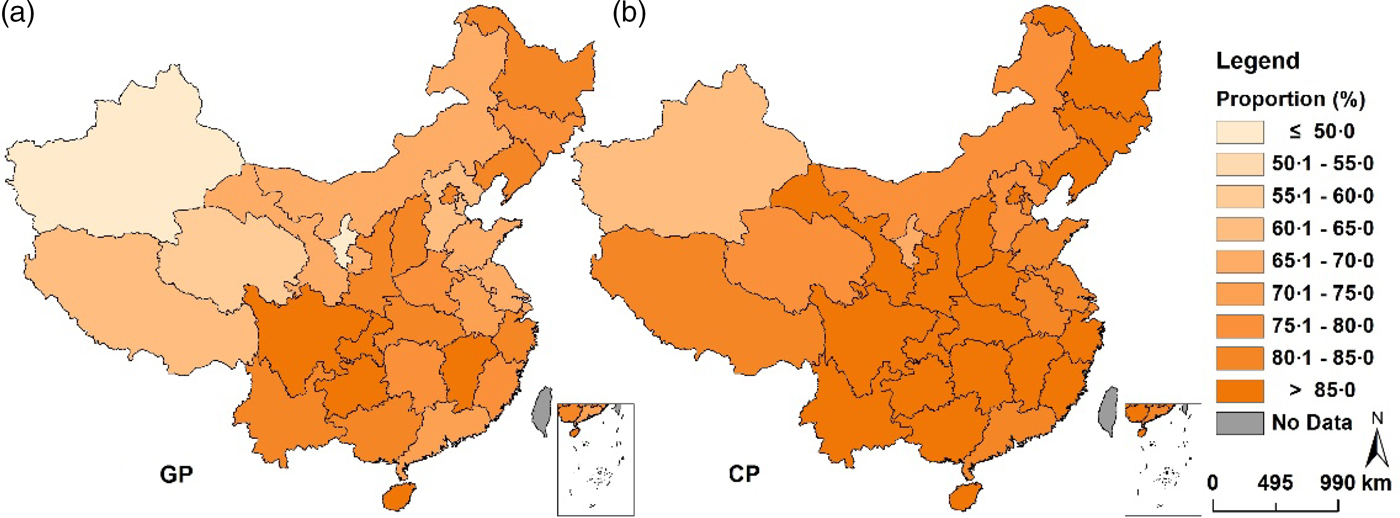
Fig. 2. Spatial distribution of (a) green water proportion and (b) CWU proportion in total cropland (GP is green water proportion in total WU and CP is CWU proportion in total WU). Colour online.
Green WU and CWU proportion in total water input as a whole, in both irrigated and total cropland, were high nationwide. This was closely related to the spatial and temporal distribution pattern of China's precipitation and the growth period of maize. Maize was planted in the rainy season (May–October) in all of the PAMs. About 0.600 of the precipitation in China occurred between June and September. Precipitation supplied most of the water requirement for maize growth and irrigation was supplementary. Precipitation and effective precipitation in PAMs located in north China were generally less than those in the southern PAMs, so the proportions of green water and consumptive water were lower than those in south China. Rainfall resources in northwest PAMs were relatively scarce and annual precipitation was ⩽400 mm in most areas. Effective precipitation could not meet the water demand for field ET during the growth period of maize. A large number of irrigation water diversions were needed for crop production. Meanwhile, irrigation efficiency was low (E i in most irrigation districts was ⩽0.450): large amounts of irrigation water were diverted and wasted. This explains why the proportions of green and consumptive water in the northwest PAMs were significantly lower than those of other PAMs, especially in southern China.
Spatial distribution of water productivity
National values of WP for total (WP), irrigated (WP I) and rain-fed (WP R) croplands from 1998 to 2010 were calculated as 1.079, 1.011 and 1.184 kg/m3, respectively. The spatial distribution of China's maize production WP changed slightly over the years. The average provincial WP values in 1998, 2005 and 2010 (Fig. 3), were used for WP spatial distribution analyses.

Fig. 3. Provincial WP for maize in (a) total (WP), (b) irrigated (WP I) and (c) rain-fed (WP R) croplands. Colour online.
The spatial distribution patterns of WP indices were quite different from those of the green water proportions and CWU proportions (Fig. 3). The spatial WP index patterns for total croplands were similar to those of irrigated lands. High values were estimated in the middle and lower reaches of the Yellow River, as well as in northwest provinces and south China. The remaining PAMs were estimated to have low WP and WP I values. WP for the rain-fed cropland in southeast and southwest PAMs was lower than that in northwest and northeast PAMs. WP values in Xinjiang (1.370 kg/m3), Gansu (1.253 kg/m3) and Inner Mongolia (1.233 kg/m3) were all over 1.200 kg/m3, while in Zhejiang, Hainan and Fujian the numbers were under 0.800 kg/m3. Only 11 PAMs (Xinjiang, Gansu, Inner Mongolia, Ningxia, Heilongjiang, Shaanxi, Shandong, Shanxi, Hubei, Jilin and Beijing) had a WP above the national mean value of 1.079 kg/m3. The highest WP I was observed in Xinjiang. In Shandong, Henan, Gansu, Shaanxi, Hebei, Beijing, Inner Mongolia, Hubei, Shanxi, Sichuan, Jiangxi and Heilongjiang WP I exceeded the national value of 1.011 kg/m3, while the values in Guangdong, Fujian, Guangxi and Hainan were below 0.600 kg/m3. The provincial WP R ranged from 0.546 kg/m3 in Fujian to 1.659 kg/m3 in Ningxia. PAMs with WP R below 1.000 kg/m3 were Hunan, Jiangsu, Hainan, Henan, Jiangxi and Zhejiang. Rain-fed WP was above the national value and more than 1.200 kg/m3 in the northeast and northwest PAMs.
The spatial pattern of WP was similar to that of WP I because WU I dominated total WU in maize production of China (Table 1). Therefore, the spatial distribution of maize WP was driven by crop yield, water resources, irrigation efficiency and irrigation rate of arable land, directly. The effective precipitation and irrigation diverted were about 320 and 260 mm during the crop growth period for northeast provinces (Heilongjiang, Jilin and Liaoning). Crop yield was about 8100 and 4300 kg/ha in the irrigated and rain-fed arable lands, respectively, and sensitive to irrigation in these PAMs. This, coupled with low irrigation efficiency, caused poor water efficiency in the irrigated and total croplands and relatively high WP R. Due to the flat topography, PAMs in North China possess well irrigation (with an irrigation rate of about 0.700) and the main agricultural planting structure is wheat–maize crop rotation. The effective precipitation, estimated at about 280 mm, was respectable during the growth of maize and average irrigation water supplied about 2000 m3/ha. Y and Y I were about 5100 and 6800 kg/ha, and the crop yield could also up to 3500 kg/ha without irrigation. Therefore, WP indices in these PAMs were greater than those in south China. Crop yield in most of humid southeast and southwest China was no more than 4500 kg/ha. This was the main reason for the low WP in these PAMs.
Potential factors that control water productivity
A summary of the PLSR model constructed for WP is presented in Table 2.
Table 2. Summary of the PLSR models

PLSR, partial least squares regression; RMSECV, root mean square error of cross validation.
a RMSECV, Q cum2 (cross-validated goodness of prediction) per component, R 2 (goodness of fit), and Q 2 (cross-validated goodness of prediction) were calculated for the PLSR models.
It was shown that the prediction error decreases as the number of components increases and reaches a root mean square error of cross validation (RMSECV) minimum with three components, suggesting that the subsequent components were not significantly correlated with the residuals of the predicted variable (Carrascal et al., Reference Carrascal, Galvan and Gordo2009). The first component explained 0.615 of the variation in WP in the data set. Addition of the second component increased the variation in WP explained by the model to 0.777. Adding more components to the PLSR models did not improve the amount of variation explained substantially (Table 2). A weight plot highlights the variables with the highest weights in each optimal model (Fig. 4). The first component was dominated by solar radiation on the positive side and PES per sown area, average temperature and precipitation during the crop growth period on the negative side, whereas the second component was dominated by E i on the positive side and by PES per sown area on the negative side (Fig. 4).

Fig. 4. Weight plots of the first and second PLSR components for WP. (Variables with the highest weights for the first components with orange circles and the second components with blue circles. H, relative humidity; T, average temperature; P, precipitation; R, solar radiation; F, agricultural input fertilizer rate; PES, dosage of pesticide per sown area; GAMP, agricultural machinery power per sown area; R i, irrigation rate; E i, irrigation efficiency). Colour online.
Although the weight plots (Fig. 4) indicate how important environmental variables were to WP, the VIP values were more convenient and express more comprehensively the relative importance of the predictors. Figure 5 illustrates the VIP values for WP, with RCs plotted against the predictors. In separate models constructed for the multiple depths, the highest VIP values were obtained for PES (VIP = 1.53; b = −0.55), followed by H (VIP = 1.34; b = −0.38), T (VIP = 1.16; b = 0.02) and P (VIP = 1.06; b = 0.03). The WP appeared to decrease with a higher PES. Similarly, a higher H led to a lower WP (as indicated by the negative RC). As expected, higher T and P are correlated with higher WP (as indicated by a positive RC). Note that all of the factors considered were, to some extent, related to WP; however, only some of them had a VIP > 1. Predictors with VIP values <1 were considered to be of minor importance for prediction purposes (Onderka et al., Reference Onderka, Wrede, Rodny, Pfister, Hoffmann and Krein2012); thus, further discussion is restricted only to variables with VIP values above 1. Another factor in WP was fertilizers which promote crop yield and WP in agricultural production. However, fertilizer usage in many regions exceeded the required amount, so factor F did not correlate spatially with WP. Because green water had the absolute dominance of WU in maize production, the dependency of crops on irrigation was small (less than other major crops such as wheat and rice), even if China's irrigation efficiency was low. The natural climatic conditions had an unavoidable impact on WP. At the same time, WP had a more pronounced effect due to agronomic measures that affect crop yield. Over-application of pesticides and fertilizers is likely to have a negative impact on the environment, so a balance between WU efficiency improvement and environmental protection should be established in agricultural production and water resource management.
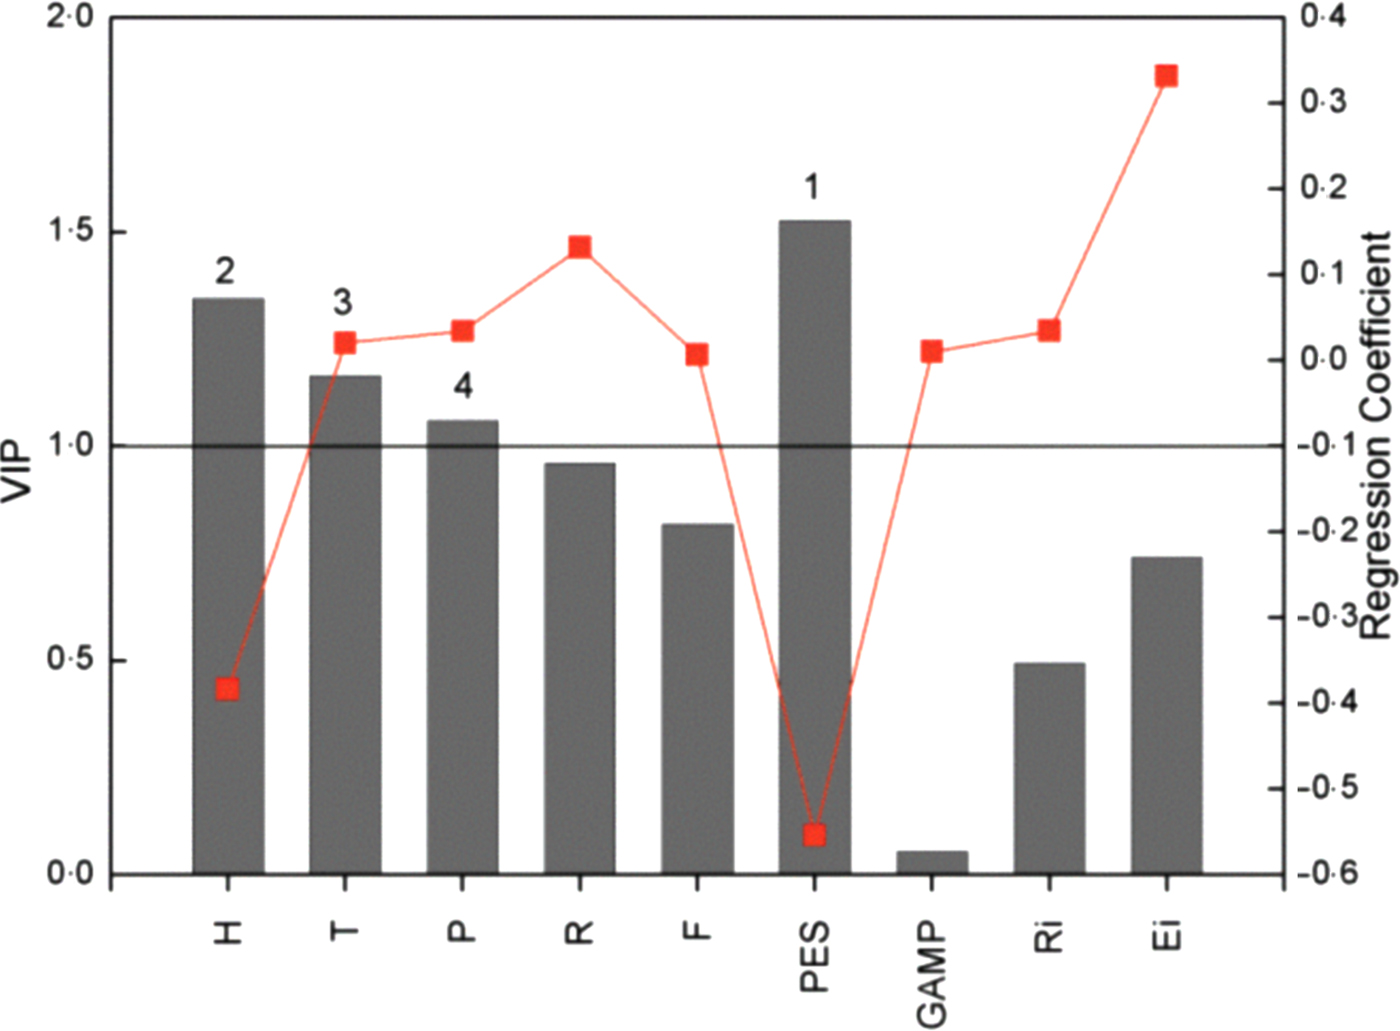
Fig. 5. VIP in bars and RCs in lines of each predictor (watershed variable). (H, relative humidity; T, average temperature; P, precipitation; R, solar radiation; F, agricultural input fertilizer rate; PES, dosage of pesticide per sown area; GAMP, agricultural machinery power per sown area; R i, irrigation rate; E i, irrigation efficiency). Colour online.
Discussion
Many studies for grain crop WP evaluation have been conducted at both national and regional levels in China (Mekonnen and Hoekstra, Reference Mekonnen and Hoekstra2011; Cao et al., Reference Cao, Wu, Wang and Zhao2014b, Reference Cao, Wang, Wu, Zhao and Wang2015a; Wang et al., Reference Wang, Wu, Engel and Sun2015).
The WP s for given crops were not the same in different reports due to differences in basic data sources and calculation methods. Wang et al. (Reference Wang, Wu, Engel and Sun2015) assumed that crops can be adequately irrigated in the growth period while in the present study the actual amount of irrigation was calculated. This is why maize WP in the present work is higher than that in Wang et al. (Reference Wang, Wu, Engel and Sun2015). It is illustrated in Table 3 that both WP and WU compositions varied among the crop species: WP and green water proportion is higher for maize than for wheat, rice and integrated grain. These two indicators for wheat are close to those of integrated grain and slightly greater than those for rice. For comparison, arithmetic mean values of WP and green water proportion for each crop are calculated in Table 3. WP for maize, wheat, rice and integrated grain are about 1.108, 0.780, 0.743 and 0.783 kg/m3, respectively. About 0.380, 0.443 and 0.375 m3 less water resources were invested for maize compared to those for wheat, rice and integrated grain, respectively, to obtain 1 kg of product. Green water proportion was about 0.775, 0.450, 0.368 and 0.577 to produce maize, wheat, rice and integrated grain in the present study. The amount and proportion of blue water in the process of maize growth was obviously less than that of other grain crops. Maize is cultivated during the rainy season across the country. Plenty of rainfall resources infiltrate into the crop root zone and are then converted into green water and consumed in the field in the form of ET during the maize planting season, so the irrigation frequency and IWR are less than those of other crops. The E i of China is only about 0.500 and a mass of irrigation water is lost in the process of water diversion. Hence, less irrigation water means less water transfer and diversion loss. This immediately increases WP and green water proportion for maize. The national total area sown to grain crops in 1998 was 113.8 Mha; rice, wheat, maize and other crops (legumes and tubers) accounted for 0.243, 0.221, 0.262 and 0.274 respectively. Grain-sown area in 2010 was 109.9 Mha, 0.034 lower than that in 1998. Plantation structure also changed greatly. The proportion of wheat and other crops (legumes and tubers) decreased by 0.041 and 0.032, respectively, and planting area ratio of maize rose to 0.296. Maize is the crop with the largest planting area in China at present. On the one hand, with a rate of 0.067, China's grain output rose from 512.3 Mt in 1998 to 546.5 Mt in 2010. Maize product increased from 133.0 Mt to 177.3 Mt over the same period. The national output of rice (198.7 and 195.8 Mt), wheat (109.7 and 115.2 Mt) and legumes and tubers (70.9 and 58.3 Mt) varied little, comparing the yields from 2010 to those of 1998 (NBSC, 1999–2011). On the other hand, the agricultural water withdrawal of the country was 376.6 and 369.1 Gm3 in 1998 and 2010, respectively; meaning a 0.020 reduction emerged 13 years later (MWR, 1998–2010). The change of planting structure was the most important factor in maintaining the stability of China's agricultural WU: water-efficient maize plays a significant and positive role in China's food safety and water resource security.
The process of agricultural production is very complex and influenced by many factors. On the one hand, crop growth needs suitable climatic conditions, water resources and adequate agricultural input; on the other hand, agricultural production may have environmental impact. The PLSR revealed that variables tied closely to maize WP are T, P, H, and PES. In contrast, GAMP, R i, E i, R and F did not influence the distribution of WP. High T and P promoted WP while it was limited in the regions with high H and PES. The correlation between WP and P (or green water) was observed to be more significant than that between WP and irrigation. Therefore, more attention should be paid to green water resource utilization compared to water conservancy facilities construction (improve E i and R i). WP relates most closely to PES and the two showed a negative correlation. Pesticides are one of the main sources of agricultural non-point source pollution. Reducing the use of pesticides can not only improve the efficiency of water resource utilization but can also maintain the sustainability of the water environment. Reductions in pesticide input should be seen as one of the important actions to improve CWP of maize in China.
Conclusion
The present work presents the temporal–spatial distribution of water use (WU) and productivity (WP) for maize by distinguishing the features between the irrigated and rain-fed croplands of China. The calculated WU and WP for the crop–water relationship can produce more accurate and comprehensive results for evaluating the role of precipitation and irrigation in food production and water resources. This will help to identify opportunities for agricultural water management. Adjusting plantation structure, expanding the sown area of crops with high WP and reducing that of low WP crops can reduce agricultural WU at a national scale. The present study also found some key factors connected with WP, which promote useful approaches for efficient WU. The dosage of pesticides per sown area has the greatest impact on WP and restricted WU efficiency. Therefore, improving WP and decreasing irrigation WU are not contradictory to ensure food security and reducing environmental pollution. The present study expands and enhances the calculation methods and evaluation objects of WP. At the same time, the results can provide an important reference for WU efficiency assessment and improvement in the agriculture industry.
Financial support
This work is jointly funded by the National Natural Science Foundation of China (51609065), the Social Science Fund of Jiangsu Province (17GLC013), the Fundamental Research Funds for the Central Universities (2018B12314; 2018B10614), the China Postdoctoral Science Foundation (2017M611681; 2018T110436), and the Jiangsu Planned Projects for Postdoctoral Research Funds (1701087B).
Conflicts of interest
None.
Ethical standards
Not applicable.


