INTRODUCTION
In winter wheat (Triticum aestivum L.), starch is an important part of wheat endosperm. It accounts for 0·65–0·75 of the final dry weight of the grain and serves as a multifunctional ingredient for the food industry. Starch is composed of two types of glucose polymers, amylose and amylopectin. Amylose is an almost linear α-1, 4 glucan molecule that comprises 0·25–0·30 of wheat grain starch. Amylopectin is a much larger glucan polymer which is highly branched and comprises 0·70–0·75 of wheat grain starch (Hurkman et al. Reference Hurkman, McCue, Altenbach, Korn, Tanaka, Kothari, Johnson, Bechtel, Wilson, Anderson and Du Pont2003). Amylose and amylopectin normally occur in a ratio of c. 1:3, by weight (Soh et al. Reference Soh, Sissons and Turner2006).
Starch is present as granules in the endosperm of wheat grain. Granule size distribution of wheat starch is an important factor that may affect the quality of many wheat products (Park et al. Reference Park, Wilson and Seabourn2009). It is widely acknowledged that the starch is deposited in two types of granules, B-type granules (diameter <9·9 μm equivalent diameter (e.d.)) and A-type granules (diameter >9·9 μm e.d.) in mature wheat grains (Soulaka & Morrison Reference Soulaka and Morrison1985; Vermeylen et al. Reference Vermeylen, Goderis, Reynaers and Delcour2005; Kim & Huber Reference Kim and Huber2008). The large A-granules are formed first in developing endosperm, while the small B-granules are formed late in kernel development (Dengate & Meredith Reference Dengate and Meredith1984). The A-type granules start to form in the amyloplast at about 4–5 days after flowering and continue to form until the end of the endosperm cell division phase. The formation of B-starch granules begins about 12–14 days after anthesis and continues to enlarge until 21 days post-anthesis (Bechtel et al. Reference Bechtel, Zayas, Kaleikau and Pomeranz1990). A-granules contain 0·30–0·36 amylose while B-granules contain 0·24–0·27 amylose (Peng et al. Reference Peng, Hucl and Chibbar2001). Different size starch granules have different physical, chemical and functional properties (Peng et al. Reference Peng, Gao, Abdel-Aal, Hucl and Chibbar1999; Chiotelli & Meste Reference Chiotelli and Meste2002; Park et al. Reference Park, Wilson, Chung and Seib2004). These differences result in the two starch granule types being used differently in industrial food and non-food applications. Starch has several roles in the breadmaking process, and starch granule size affects a range of properties (Sahlström et al. Reference Sahlström, Brathen, Lea and Autio1998, Reference Sahlström, Baevre and Brathen2003). Using 98 hard red winter wheat cultivars and 99 hard red spring wheat cultivars as materials, Park et al. (Reference Park, Wilson and Seabourn2009) reported that parameters of B-granules showed many significant correlations with wheat and flour properties.
Environment is an important factor that affects grain development and starch accumulation, and numerous studies have been conducted on size distribution and properties of starch granules in wheat grains. Water stress has been shown to cause a marked reduction in the sucrose and starch content of the grains (Ahmadi & Baker Reference Ahmadi and Baker2001). The starch from wheat exposed to water stress at 15 days post-anthesis showed lower amylose content (Singh et al. Reference Singh, Singh, Singh and Singh2008). Hurkman et al. (Reference Hurkman, McCue, Altenbach, Korn, Tanaka, Kothari, Johnson, Bechtel, Wilson, Anderson and Du Pont2003) and Zhao et al. (Reference Zhao, Dai, Jiang and Cao2008) reported that high temperature from anthesis to maturity reduced the duration of starch accumulation. With increased developmental temperature, starch granule size decreased and gelatinization temperature increased (Peterson & Fulcher Reference Peterson and Fulcher2001). Li et al. (Reference Li, Yin, Yan, Dai, Li, Liang, Geng and Wang2008) showed that shading caused a marked drop in both grain yield and starch yield and led to a significant reduction in the proportion (both by volume and by surface area) of B-type starch granules (⩽9·9 μm e.d.), with an increase in those of A-type starch granules (>9·9 μm e.d.). Dai et al. (Reference Dai, Yin, Zhang, Li, Yan, Cai and Wang2008) found that both irrigated and rainfed conditions had a significant effect on the starch granule size distribution of the wheat. Rainfed treatments affected the size distribution of starch granule in grains through increasing the volume proportion and surface area proportion of starch granules in size categories 2–9·8 and <9·8 μm e.d. and decreasing those of >9·8 μm e.d. starch granules. The soil water deficit also decreased the contents of amylose and starch in grains. Lazaro et al. (Reference Lazaro, Abbate, Cogliatti and Andrade2010) reported that phosphorus (P) deficiency resulted in a reduction in intercepted radiation during the spike growth period, thus causing a reduction in grain number and crop yield. There is limited information available on the size distribution of the winter wheat under P fertilization. The present study was conducted to investigate the effect of P fertilization on starch granule size distribution and starch component content in wheat grain at maturity. Information obtained will help to provide a theoretical basis for obtaining higher grain yield and superior grain quality in wheat.
MATERIALS AND METHODS
Experimental design
The field experiments were carried out in growing seasons from October 2008 to June 2009 and from October 2009 to June 2010 at Tai'an Experimental Station of Shandong Agricultural University, Tai'an, China (36°09′N, 117°09′E, 128 m asl). Two high-yield winter wheat (T. aestivum L.) cultivars currently used in local wheat production, Jimai20 and Shannong12 were used. The soil was a sandy loam and the previous crop was maize (Zea mays L.). During the wheat-growing season of 2008/09, there were four P fertilization treatments: 0 kg P2O5/ha (P0), 40 kg P2O5/ha (P1), 100 kg P2O5/ha (P2) and 160 kg P2O5/ha (P3). During the wheat-growing season of 2009/10, there were three P fertilization treatments: 0 kg P2O5/ha (P0′), 135 kg P2O5/ha (P1′) and 225 kg P2O5/ha (P2′). In addition, in both seasons, basal fertilizer was applied at the rate of 112·5 kg N/ha, 120 kg K2O/ha before planting. In the spring, 112·5 kg N/ha was applied at the stem elongation stage of wheat. The experiments were designed in a split-plot design with three replications for each cultivar. The plot size was 3×3 m with 10 rows (0·25 m between rows). Seeds were sown on 10 October in both 2008 and 2009 with a density of 180 plants/m2. The plants were harvested on 7 June 2009 and 10 June 2010. Other cultural practices followed were according to the precise high-yielding cultivation system of Yu (Reference Yu1990). At maturity, wheat kernels were harvested, starch content and starch granules size were determined.
Starch isolation and purification
Starch was extracted from the wheat cultivars according to the methods of Malouf & Hoseney (Reference Malouf and Hoseney1992) and Peng et al. (Reference Peng, Gao, Abdel-Aal, Hucl and Chibbar1999), with some modifications as follows: wheat kernels (2 g) were covered with 30 ml double-distilled water at 4°C for 24 h. The softened seeds were degermed and ground with a pestle and mortar in double-distilled water until essentially all starch granules had been released. The slurry was filtered through a 74 μm e.d. screen and centrifuged at 1700 g for 10 min to sediment the crude starch. The crude starch was purified three times using 5 ml of 2 mol NaCl/l, 2 mg NaOH/g, 20 mg sodium dodecyl sulphate/g and double-distilled water. To remove water, the starch was washed once with acetone, air-dried at room temperature and stored at −20°C.
Particle size analysis
The particle size characteristics of the starch were determined using a LS13320 laser diffraction particle size analyser (Beckman Coulter, USA). About 50 mg of starch was weighed into 10 ml (Eppendorf) tubes and suspended with 5 ml of double-distilled water. The tubes were vortexed and kept at 4°C for 1 h, during which time the tubes were vortexed every 15 min. Then 1 ml of the starch suspension was transferred into the dispersion tank of a laser diffraction particle size analyser containing double-distilled water for size measurements. The assessments of equivalent volume, equivalent surface area and number proportions of starch granule were made automatically by the laser diffraction particle size analyser and represented the diameter of a sphere with the same volume as the starch grain and the diameter of a circle with the same projected area as the real starch grain.
Amylose and amylopectin determination
Amylose and amylopectin contents in wheat grain were determined with a coupled spectrophotometer assay (He Reference He1985). 100 mg of milled grain was stirred with 10 ml of 0·5 M KOH for 15 min at 100°C and then diluted to a volume of 50 ml with distilled water. Of this solution, 2·5 ml were diluted with 30 ml distilled water and adjusted to pH 3·5 with 0·1 mol HCl/l, and then 0·5 ml of I2–KI reagent was added to the solution, which was diluted with distilled water to a final volume of 50 ml. After blending for 20 min, the mixture was monitored with a UV-2450 Shimadzu spectrophotometer at 471, 553, 632 and 740·3 nm. Standard amylose and amylopectin were purified from wheat. The absorption peaks of purified amylose which reacted with the I2–KI reagent were 632 and 471 nm, whereas those of amylopectin were 740·3 and 553 nm.
Statistical analysis
Analysis-of-variance procedures for randomized complete designs were used to test for differences in granule distribution and starch content between P fertilization treatment and control and calculated their standard errors of differences. All determinations were replicated three times, and data were analysed by means of SPSS.
RESULTS
Granule size distribution
The starch granule distribution of the two wheat cultivars in both seasons showed a similar trend in different P fertilization conditions. Volume distribution (Fig. 1(a)) of starch granules shows the typical two populations of granules with peak values in the range of 4·8–6·1 μm e.d. and 21·7–23·9 μm e.d., respectively. The limit between the two populations occurred at c. 9·9 μm e.d. Surface area distribution of granules was bimodal with peak values in the ranges of 3·1–3·4 μm e.d. and 21·7–23·6 μm e.d., respectively (Fig. 1(b)). Figure 1(c) shows a typical population of number distribution of granules with peak values in the range of 0·51–0·7 μm e.d. The limit between the two populations occurred at c. 9·9 μm e.d.
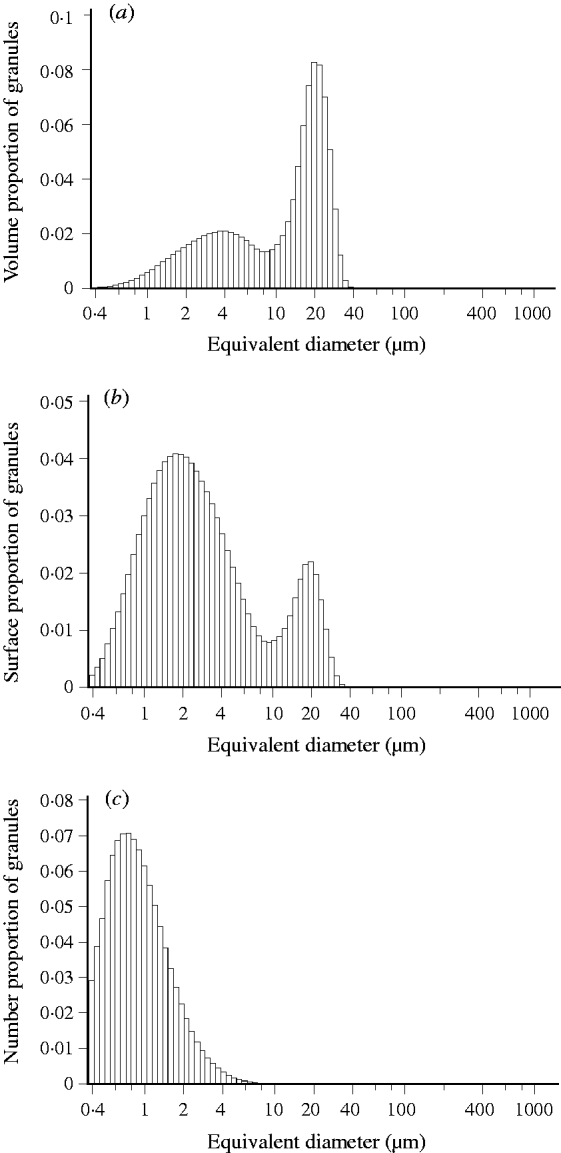
Fig. 1. Typical (a) volume, (b) surface area and (c) number distribution of starch granules in wheat grain. Data are from Shannong12 under P1′ treatment in the 2009/10 growing season.
Granule volume distribution
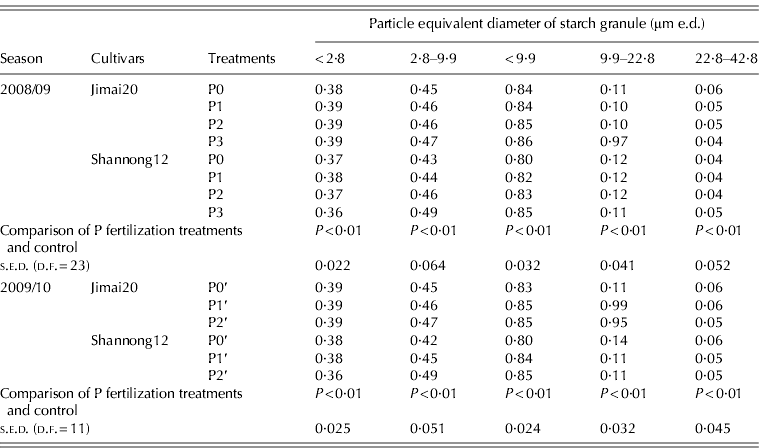
The volume distribution of starch granules is given in Table 1; 0·99 of the volume comprised granules of <42·8 μm e.d. The P fertilization conditions had a marked influence on the volume proportions of A-type and B-type starch granule. Under P fertilizer conditions, the volume proportions of starch granule at 2·8–9·9 μm e.d. and <9·9 μm e.d. in Jimai20 were significantly increased by 0·02–0·15 and 0·02–0·13; for Shannong12, the volume proportions of starch granule at 2·8–9·9 μm e.d. and <9·9 μm e.d. were significantly increased by 3–14 and 8–19%, respectively. In contrast, volume proportions of starch granule of 22·8–42·8 μm e.d. under P fertilization conditions decreased markedly when compared with no P fertilization. The results indicated that the P fertilization conditions significantly increased that of B-type (<9·9 μm e.d.) starch granules and reduced volume proportions of A-type (>9·9 μm e.d.) starch granules.
Table 1. Effect of phosphorus (P) fertilization on the proportion by volume of starch granules in different size classes

Granule surface area distribution
The proportion surface area distribution of starch granules in the two cultivars are given in Table 2. Under P fertilization conditions, the surface area proportions of starch granules at 2·8–9·9 μm e.d. and <9·9 μm e.d. in Jimai20 were increased significantly (by 1–4 and 7–17%, respectively, in Jimai20 and by 2–16 and 1–52%, respectively, in Shannong12). However, surface area proportions of starch granules of >9·9 μm e.d. under P fertilization conditions decreased markedly when compared with the non-P fertilization condition. The results indicated that P fertilization was responsible for the increase in surface area proportions of B-type starch granules and decrease in that A-type starch granules, respectively.
Table 2. Effect of phosphorus (P) fertilization on the proportion by surface area of starch granules in different size classes
Granule number distribution
Proportions of starch granules <2·8 and <9·9 μm e.d. were in the ranges of 0·95–0·967 and 0·996–0·997 of the total number, respectively (Table 3), which showed that most of the granules in the wheat grain analysed were B-starch granules. P fertilization had little influence on the proportions by number of B-type granules in wheat grains but had some effect on that of starch granules with different diameter ranges: it increased the proportion by number of <0·8 μm e.d. and decreased that of 0·8–9·9 μm e.d. These results imply that small starch granules are the main numerical component although they contribute less to the total volume.
Table 3. Effect of phosphorus (P) fertilization on the proportion by number of starch granules in different size classes
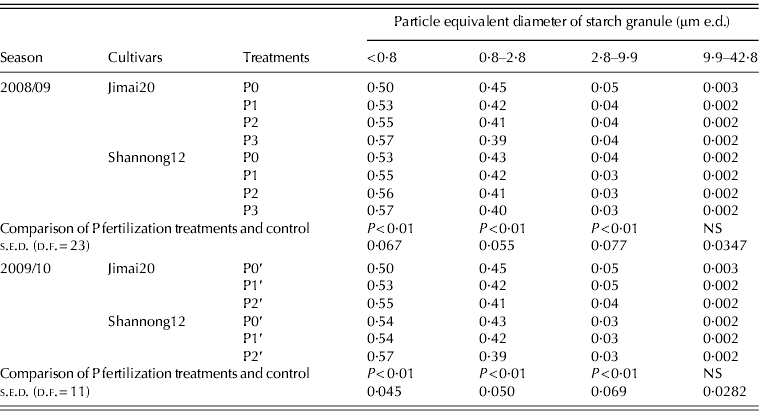
NS, not significant (P<0·05).
Starch content
P fertilization conditions significantly increased starch content and amylopectin content at maturity (Table 4). However, P fertilization conditions significantly reduced the ratio of amylose to amylopectin.
Table 4. Effect of phosphorus (P) fertilization on the proportion of starch and its components in wheat grain
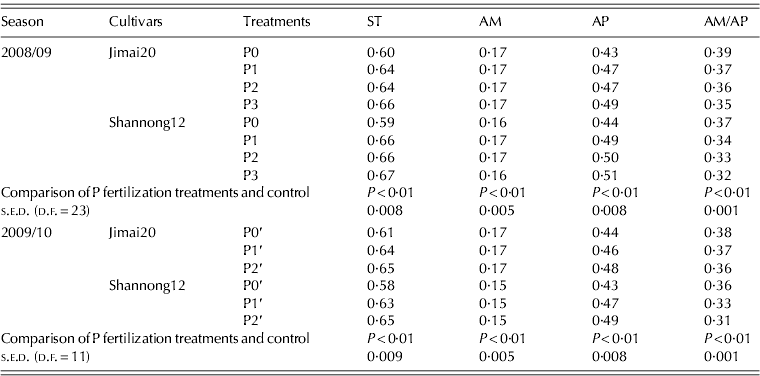
ST, starch; AM, amylase; AP, amylopectin; AM/AP, amylose/amylopectin.
The proportion of granules by volume (volume proportion) of starch granules 2·8–9·9 μm e.d. was negatively correlated with the ratio of amylose to amylopectin (r=−0·54, P<0·05; Fig. 2(b)). A positive correlation (r=0·89, P<0·01; Fig. 2(d)) was found between volume proportions of starch granules 22·8–42·8 μm e.d. and the ratio of amylose to amylopectin. Volume proportions of starch granules <2·8 μm e.d. and 9·9–22·8 μm e.d. were not significantly correlated with the ratio of amylose to amylopectin (r=−0·37; r=−0·36; respectively; Fig. 2(a) and (c)).
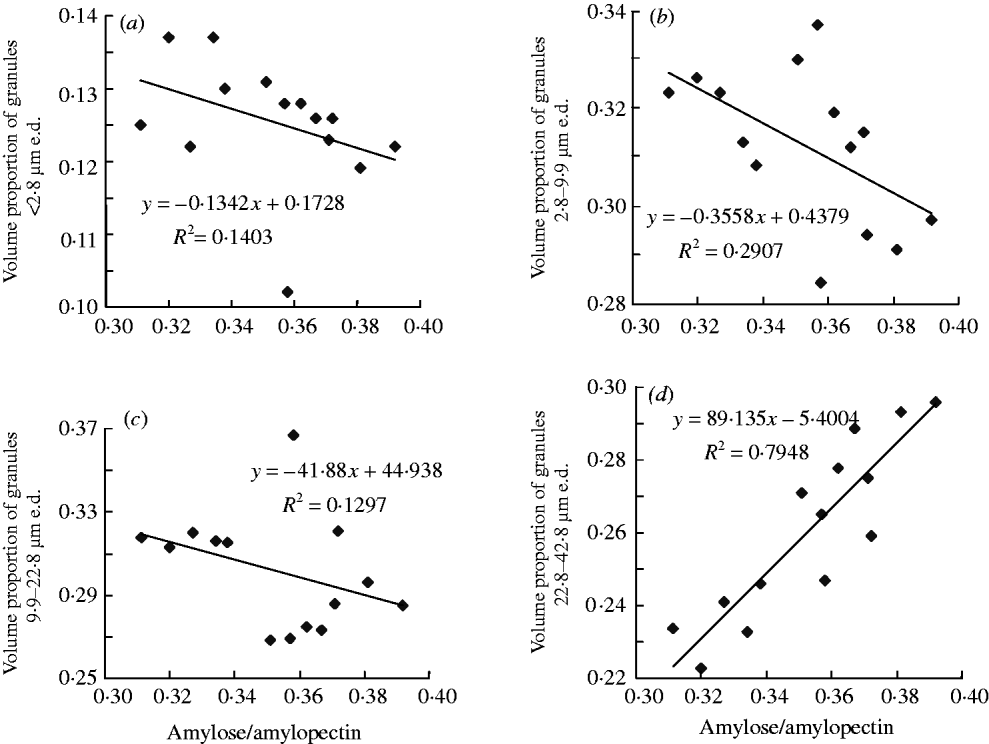
Fig. 2. The relationship between distribution by volume of starch granules and the ratio of amylose to amylopectin in grain.
DISCUSSION
It was found that the contents of amylose, amylopectin and starch were increased under P fertilization in both seasons. Although the amylose content increases were small, Zeng et al. (Reference Zeng, Morris, Batey and Wrigley1997) reported that as little as a 1% change in total amylose content significantly affects starch gelatinization, pasting and gelation properties. Wang et al. (Reference Wang, Ma, Zhu, Guo, Feng and Zhou2004) reported that the ratio of amylose to amylopectin played an important role in the physical and chemical properties of starch, and starch properties of flour have significant effects on noodle quality parameters. In the present study, P fertilization conditions significantly increased starch content and amylopectin content at maturity. However, P fertilization conditions significantly reduced the ratio of amylose to amylopectin.
Most investigators have found that the starch granules have a bimodal size distribution: the large A-granules (>9·9 μm e.d.) and the small B-granules (<9·9 μm e.d.) (Peng et al. Reference Peng, Gao, Abdel-Aal, Hucl and Chibbar1999; Topin et al. Reference Topin, Radjai, Delenne, Sadoudi and Mabille2008; Li et al. Reference Li, Yin, Yan, Dai, Li, Liang, Geng and Wang2008). But some studies (Bechtel et al. Reference Bechtel, Zayas, Kaleikau and Pomeranz1990; Wilson Reference Wilson2003; Lindeboom et al. Reference Lindeboom, Chang and Tyler2004; Wilson et al. Reference Wilson, Bechtel, Todd and Seib2006) reported a trimodal distribution in wheat granules; C-granules (<5 μm e.d.) were initiated very late in grain filling. In the present study, both for cultivars and P fertilization treatments, a typical bimodal curve was found in the volume distribution, in which the valley particle diameter is the cut-off of A- and B-granules, 9·9 μm e.d.
In different growing conditions, the mean volume of A-type starch granules within a cultivar varied 1·0–1·5 times and that of B-type starch granules 1·0–2·0 times (Morrison & Scott Reference Morrison and Scott1986). Hurkman et al. (Reference Hurkman, McCue, Altenbach, Korn, Tanaka, Kothari, Johnson, Bechtel, Wilson, Anderson and Du Pont2003) showed that high temperature after anthesis markedly affected the components of starch granules in wheat grain. Based on relative volume, B-type starch granules were the predominant class in mature grain produced under the day/night regimens of 37/17°C and 24/17 °C, whereas the A-type starch granules were predominant in grain produced under the 37/28°C regimens. Li et al. (Reference Li, Yan, Yin and Wang2010) reported that shading caused a marked drop in both grain yield and starch yield and led to a significant reduction in the proportion (both by volume and by surface area) of B-type starch granules (<9·9 μm e.d.), with an increase in those of A-type starch granules (>9·9 μm e.d.). B-type granules in wheat tended to be more susceptible to environmental stresses (Blumenthal et al. Reference Blumenthal, Bekes, Gras, Barlow and Wrigley1995; Dai et al. Reference Dai, Yin and Wang2009). The present results have shown that the volume and surface area proportions of A- and B-starch granules can be influenced significantly by P fertilization. P fertilization led to a significant increase in the volume proportion and surface area proportion of B-starch granules. It is suggested that B-starch granules are more sensitive to P fertilization than A-starch granules in wheat grain.
P fertilization had little influence on the proportions by number of B-type granules in wheat grains, but the proportions by volume of B-type granules increased with P fertilization. Based on the present results, it is suggested that, under P fertilization conditions, the limited substrate for starch accumulation was mainly partitioned to grow starch granules, not for producing more starch granules.
The ratio of amylose to amylopectin was negatively correlated with the volume proportion of granules 2·8–9·9 μm e.d. and positively correlated to volume proportion of granules 22·8–42·8 μm e.d. in the present study. This indicates that an increase in proportion by volume of granules 22·8–42·8 μm e.d. enhanced the ratio of amylose to amylopectin in wheat grain induced by P fertilizer.
The research was supported by the National Natural Science Foundation of China (30871477), the National Basic Research Program of China (973 Program 2009CB118602), and the Public Service Sector (Agriculture) Research Program of China (200803037).


