Introduction
The predominance of wheat, rice and maize in global cereal production has contributed to a decline in the biological diversity of cereals. Wheat, rice and maize account for 0.91–0.94 of cereals produced around the world. The remaining cereal species, including rye, barley, triticale and oats, are of less importance in the global food security system, and their global production decreased by 0.6 million t/y in 2004–2014 (FAO, 2017). Wheat is a staple crop and a strategic food reserve in the world. Common wheat (Triticum aestivum L.) is most popular among the numerous species of wheat, and its global harvests in 2016 were estimated at 735 million t. In 2016, European Countries (EU) countries produced 161 million t of wheat, which accounted for around 0.47–0.51 of total cereal production in the EU (FAO, 2017). The structure of the Polish cereal market differs considerably from that of the EU market. In Poland, wheat has a lower share of the cereal market (0.30–0.40) and the share of maize is low (0.10–0.13), whereas the market share of oats and cereal mixtures is very high (0.05 and 0.08–0.11, respectively), when compared with the EU (Łopaciuk, Reference Łopaciuk2017).
Numerous attempts are being made worldwide to counteract the decline in the biological diversity of food crops, including field crops, vegetables and herbs. One of the recommended solutions is the reinstatement of ancient species, which have been preserved in local agronomic practices (Vašák and Budzyński, Reference Vašák and Budzyński2009). Spelt wheat (T. spelta L.), the ancient form (sub-species) of T. aestivum (L.) and a staple cereal in Europe in the 19th century, has already been reintroduced to several EU countries. Spelt was gradually ousted by T. aestivum (L.) in the 20th century on account of its lower yield and grain that needs to be de-husked before milling (Hösel, Reference Hösel1989). Today, spelt is grown on around 60 000 ha of land in Europe, mainly in Germany, Austria and Switzerland and, to a smaller extent, in Poland and the Czech Republic (Budzyński, Reference Budzyński2012).
Durum wheat (T. durum Desf.) is also an economically important species of the genus Triticum with a global annual output of around 37 million tons and an estimated 0.05 share of the global wheat market. Durum wheat is regarded as the best source of semolina for the production of high-quality pasta and couscous (Ranieri, Reference Ranieri2015). Durum wheat was originally farmed in the Middle East, Ethiopia, North Africa and China. Today, it is grown locally and on a small scale in eastern and south-eastern Europe (Hungary, Slovakia, Czech Republic, Poland) (Budzyński, Reference Budzyński2012). Triticum spelta (L.) and T. durum (Desf.) are characterized by high flour strength, milling quality and nutritional value, and they constitute a worthwhile addition to a varied diet (Adeyeye and Aye, Reference Adeyeye and Aye2005; Ruibal-Mendieta et al., Reference Ruibal-Mendieta, Delacroix, Mignolet, Pycke, Marques, Rozenberg, Petitjean, Habib-Jiwan, Meurens, Quetin-Leclercq, Delzenne and Larondelle2005).
The breeding of new and more productive cultivars of T. spelta (L.) and T. durum (Desf.) that are well-adapted to modern agricultural practices designed for the high-performing cultivars of T. aestivum (L.) is a more laborious method of increasing biodiversity. The limited number of experimental factors in classical field experiments prevents detailed evaluation of interaction effects that can significantly influence specific traits in experiments with a multifactorial design. Multiple production factors can be analysed in experiments with the sk factorial design, where k factors are evaluated at s levels, usually two or three. A significant limitation of factorial designs is that the number of treatment combinations that must be tested increases dramatically with a rise in the number of experimental factors (three factors at three levels produce 27 combinations per replicate, whereas four factors produce 81 combinations and five factors produce 243 combinations). For this reason, the number of treatment combinations should be reduced while maintaining the system's ability to detect significant treatment effects. According to Załuski and Gołaszewski (Reference Załuski and Gołaszewski2006), the above goal can be achieved with the use of 3k−p fractional factorial designs where k factors at s = three levels are tested based on 1/3p (where p is fraction size) of the set of 3k experimental units. The separation of 1/31 experimental units from the 35 factorial design reduces the number of combinations from 243 to 81 and produces a 35–1 factorial design. In experiments with a 35–1 factorial design, mathematical generators are used to evaluate the main effects of five factors at three levels and the effects of all two-factor interactions (Załuski et al., Reference Załuski, Dubis, Budzyński and Jankowski2016).
The aim of the current study was to determine the influence of selected yield-forming and yield-protecting agronomic factors, including sowing date, seed rate, nitrogen (N) fertilization and chemical disease control, and their interactions on the grain yield of selected winter cultivars of common wheat, spelt and durum wheat in an experiment with the 35–1 fractional factorial design. The research hypothesis postulated that the responses of genetically distant species and cultivars of common wheat (cv. Oliwin), spelt (cv. Schwabenkorn) and durum wheat (cv. Komnata) to different agronomic factors can provide valuable inputs for developing production technologies that effectively harness the potential of various Triticum species.
Materials and methods
Field experiment
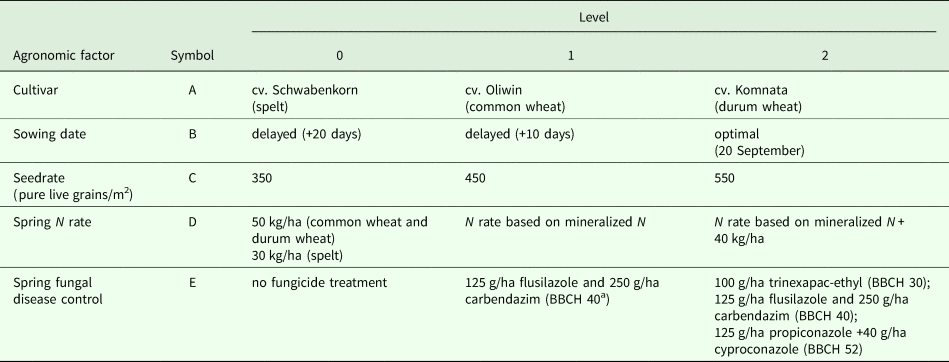
The experiment was carried out in 2007–2010 at the Agricultural Experiment Station in Bałcyny (53°35′46.4″ N, 19°51′19.5″ E, 137 m asl), in north-eastern (NE) Poland. The station is part of the University of Warmia and Mazury in Olsztyn. The experiment had the 35–1 fractional factorial design where five factors (A, B, C, D and E) were tested simultaneously at three levels (0, 1 and 2) (Table 1). A total of 81 combinations (experimental treatments) were assigned randomly to nine incomplete blocks per replication. This fractional factorial design was based on the defining generator E = A + B + C + D mod(3).
Table 1. Agronomic factors and levels in the experiment with the 35–1 fractional factorial design
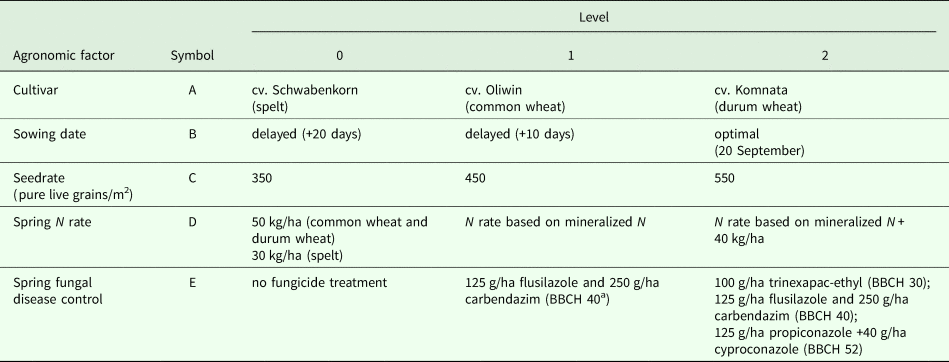
a BBCH identification key for growth stages (Weber and Bleiholder, Reference Weber and Bleiholder1990; Lancashire et al., Reference Lancashire, Bleiholder, Langeluddecke, Stauss, van den Boom, Weber and Witzen-Berger1991).
Plot size was 15 m2 (1.5 × 10 m2). Each year, the experiment was established on Haplic Luvisol originating from boulder clay (IUSS Working Group WRB, 2006). Winter oilseed rape (Brassica napus L.) was the preceding crop in each experimental year. The content of organic carbon (Corg), plant-available phosphorus (P), potassium (K), magnesium (Mg) and pH in 1 mol/dm3 potassium chloride (KCl) was determined in the 0–30 cm soil horizon before the experiment. Soil samples were collected from three horizons (0–30, 30–60 and 60–90 cm) in early spring before the beginning of the growing season to determine mineral N (ammonium N [NH4–N] and nitrate N [NO3–N]) content. In the experimental plots, soil pH ranged from 6.1 to 6.3, and soil nutrient levels were determined as 9.7–10.8 g/kg for Corg, 60.1–70.6 mg/kg for P, 147–172 mg/kg for K and 58–64 mg/kg for Mg![]() ${\rm SO}_4^{2-} $. Soil organic C was determined using the modified Kurmies’ method (Shimadzu UV-1201 V spectrophotometer, Shimadzu Corporation Kyoto, Japan) (Houba et al., Reference Houba, van der Lee and Novozinsky1995). Soil pH was measured using a digital pH meter with temperature compensation (20 °C) in deionized water and 1 mol/dm3 KCl at a 5:1 ratio. Plant-available P and K were measured by the Egner-Riehm method (using 3.5 mol ammonium lactate acetic acid buffered to pH = 3.75 as extracting solution) (Houba et al., Reference Houba, van der Lee and Novozinsky1995). Phosphorus was determined by the vanadium molybdate yellow colorimetric method (Shimadzu UV-1201 V spectrophotometer, Shimadzu Corporation Kyoto, Japan), and K was determined by atomic emission spectrometry (AES) (BWB Technologies UK Ltd. Flame Photometers, Newbury, UK). Magnesium was extracted with 0.01 M calcium chloride (CaCl2) and determined by atomic absorption spectrophotometry (AAS) (AAS1N, Carl Zeiss Jena, Germany). The content of NH4–N in the soil was determined colorimetrically with Nessler's reagent, and NO3–N levels were determined colorimetrically with phenoldisulfonic acid (Shimadzu UV-1201 V spectrophotometer).
${\rm SO}_4^{2-} $. Soil organic C was determined using the modified Kurmies’ method (Shimadzu UV-1201 V spectrophotometer, Shimadzu Corporation Kyoto, Japan) (Houba et al., Reference Houba, van der Lee and Novozinsky1995). Soil pH was measured using a digital pH meter with temperature compensation (20 °C) in deionized water and 1 mol/dm3 KCl at a 5:1 ratio. Plant-available P and K were measured by the Egner-Riehm method (using 3.5 mol ammonium lactate acetic acid buffered to pH = 3.75 as extracting solution) (Houba et al., Reference Houba, van der Lee and Novozinsky1995). Phosphorus was determined by the vanadium molybdate yellow colorimetric method (Shimadzu UV-1201 V spectrophotometer, Shimadzu Corporation Kyoto, Japan), and K was determined by atomic emission spectrometry (AES) (BWB Technologies UK Ltd. Flame Photometers, Newbury, UK). Magnesium was extracted with 0.01 M calcium chloride (CaCl2) and determined by atomic absorption spectrophotometry (AAS) (AAS1N, Carl Zeiss Jena, Germany). The content of NH4–N in the soil was determined colorimetrically with Nessler's reagent, and NO3–N levels were determined colorimetrically with phenoldisulfonic acid (Shimadzu UV-1201 V spectrophotometer).
In treatment D0, N was applied at 30 (spelt) or 50 kg N/ha (common wheat and durum wheat) in early spring (growth stage [GS] 30, according to the BBCH scale, Lancashire et al., Reference Lancashire, Bleiholder, Langeluddecke, Stauss, van den Boom, Weber and Witzen-Berger1991). In treatment D1, the rate of N fertilization was determined based on an analysis of the soil N balance (N min) (Rutkowska and Fotyma, Reference Rutkowska, Fotyma and Ozkaraova2011) Eqn (1), N uptake of wheat (26 kg N/t grain) and predicted grain yields of common wheat, durum wheat and spelt (8, 7 and 6 t/ha, respectively). The content of mineral N in the 0–90 cm layer of soil was determined as 92 kg N/ha in 2008, 84 kg N/ha in 2009 and 79 kg N/ha in 2010.
where:
N fer – optimal rate of N fertilizer (kg/ha);
N crop – crop N requirement (kg/ha);
N min – content of mineral N in soil (kg/ha);
RVF – N min replacement value (1.0);
UNF – N fertilizer use efficiency (65%).
Seeds of common wheat, durum wheat and spelt were sown on three dates: optimal for the local conditions, i.e. 20 August (treatment B2), and delayed by 10 days (B1) and 20 days (B0) relative to the optimal seeding date. Seed rate was 350 (C0), 450 (C1) and 550 (C2) seeds/m2 (Table 1). Nitrogen rates in treatment D1 were calculated as 58–78 kg N/ha (spelt), 98–118 kg N/ha (durum wheat) and 138–158 kg N/ha (common wheat). In treatment D1, N fertilizer was applied twice (50 kg N/ha at GS 30, and the remaining amount at GS 37). In treatment D2, the N rate was 40 kg N/ha higher than that determined based on the content of mineral N (N min). The additional N was applied at GS 51. Nitrogen was applied as ammonium nitrate (34.5%) in all treatments (D0, D1, D2). Disease control involved a different number of treatments and the use of various fungicide products. At the low level (E0), fungicides were not applied; at the average level (E1), 125 g/ha flusilazole and 250 g/ha carbendazim were applied at GS 40; at the high level (E3), 100 g/ha trinexapac-ethyl and 125 g/ha propiconazole +40 g/ha cyproconazole were additionally applied at GS 30 and GS 52, respectively (Table 1).
Agronomic treatments that did not constitute experimental variables were performed in accordance with good agricultural practice. The preceding crop was harvested and stubble removed mechanically. The plots were ploughed to a depth of 18–20 cm, harrowed with a medium harrow before sowing and loosened with a cultivation unit composed of a drag harrow, a rotary harrow and two rows of semi-rigid tines. The seeds of the analysed cultivars of winter wheat were dressed (37 ml of carbendazim +83 ml of thiuram per 100 kg of seeds) and sown to a depth of 3 cm with 10.5 cm spacing between rows. Before sowing, N fertilizer (34.5% ammonium nitrate) was applied at 20 kg N/ha, phosphate (46% triple superphosphate) was applied at 39 kg P/ha, and K (60% K2O) was applied at 100 kg K/ha. Weeds were controlled with 5.57 g/ha iodosulfuron-methyl-sodium, 10 g/ha mesosulfuron-methyl and 15 g/ha amidosulfuron (GS 25–29). Each year, wheat was harvested at physiological maturity in the first 10 days of August with the use of a small-plot harvester (Wintersteiger Classic, type 1540–447, Ried, Austria). Spelt grain was dehulled with the use of a spelt dehuller (Kruszek – Uniwersalna Czyszczarnia, Promar Ltd., Poznań, Poland).
The grain yield of wheat in each plot was determined by weight after threshing and expressed on a dry matter basis (85% DM). The major yield components were determined immediately before harvest: the number of spikes m2, the number of grains per ear, and thousand grain weight (TGW) on a DM basis (85% DM).
Statistical analysis
The results were analysed with the use of a mixed model of 35–1 fractional factorial design with resolution V to evaluate the main effects (A, B, C, D and E) and all two-factor interactions in three growing seasons (2007/2008, 2008/2009, 2009/2010). The remaining higher-order interactions were pooled in error estimates. The experimental factors (A, B, C, D and E) were the fixed effects, and growing season, replicates and incomplete blocks were the random effects. The significance of differences between means was evaluated using Tukey's HSD test (P < 0.05). Data were processed using Statistica software (Dell Inc., 2016). F-test statistics (ANOVA), five experimental factors and their interactions across the experimental years are presented in Table 2.
Table 2. F-test statistics (ANOVA)
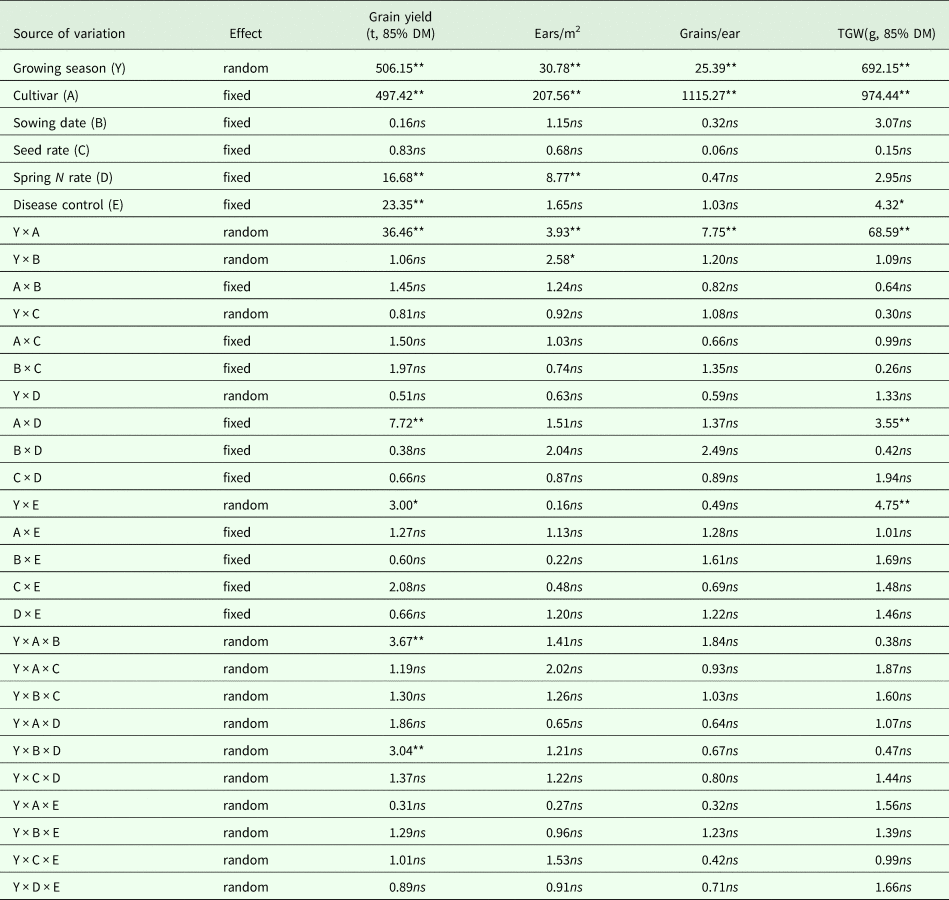
DM, dry matter; TGW, thousand grain weight.
* significant P < 0.05;
** significant P < 0.01; ns – not significant.
Results
Weather conditions
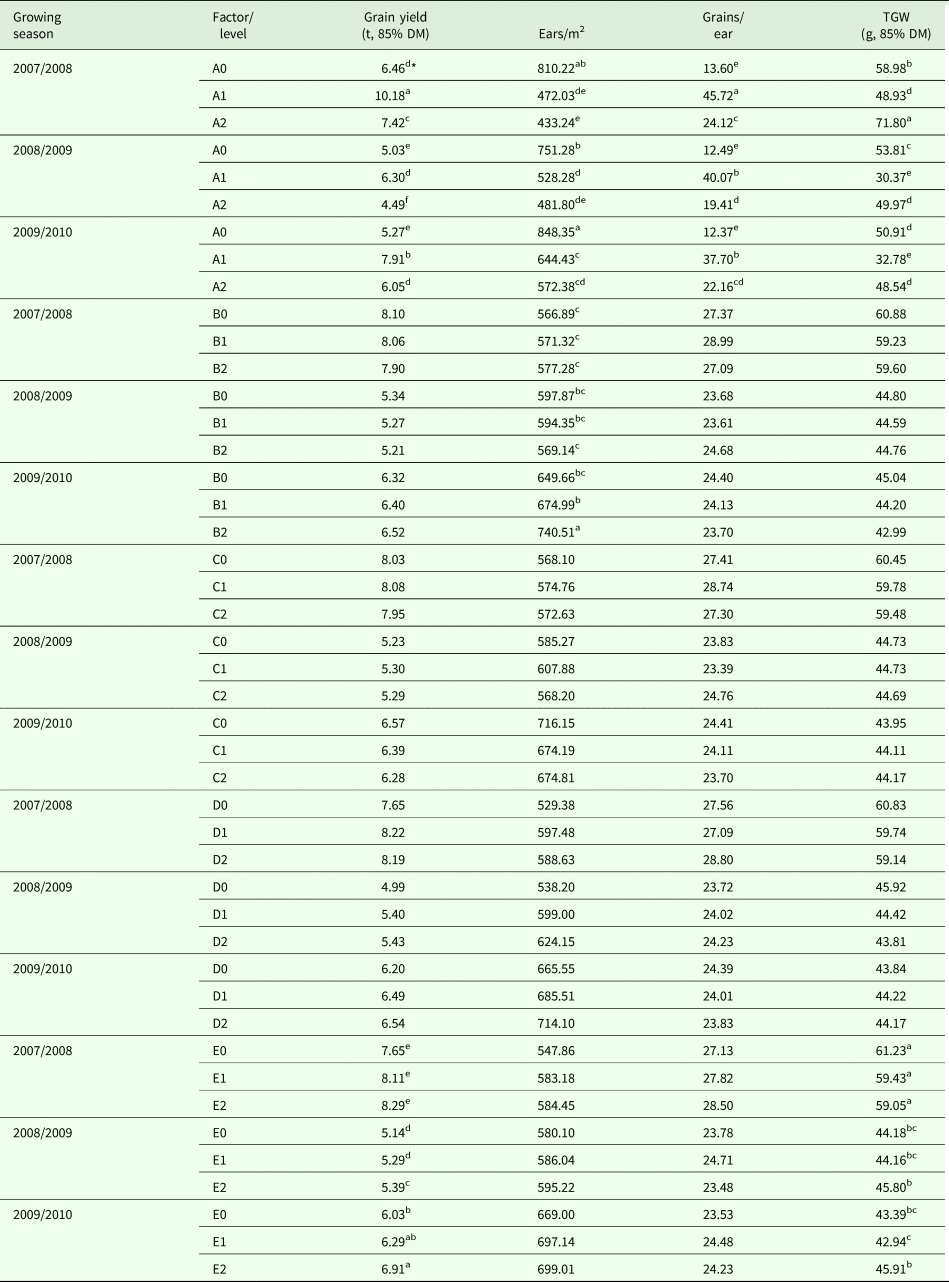
In NE Poland, the growing season of the three species lasted from 295 to 308 days (delayed seeding) to 315–322 days (optimal seeding date) in 2007–2010. The growing season of 2007/2008 was characterized by a mild winter (mean daily temperature during winter was 0.8–3.9 °C higher than the long-term average) and high precipitation (113% of the long-term average) at the beginning of stem elongation in April (Table 3). In all years of the study, grain yield was highest in common wheat, followed by durum wheat and spelt (Table 4). Favourable winter temperatures and precipitation levels during the main stages of wheat growth (GS 30–39) in the first growing season contributed to satisfactory grain yields which were determined at 10.18 t/ha for common wheat cv. Oliwin, 7.42 t/ha for durum wheat cv. Komnata and 6.46 t/ha for spelt cv. Schwabenkorn (Table 5). The second and third growing seasons (2008/2009 and 2009/2010) were characterized by far less favourable overwintering conditions. In winter, mean daily temperatures were 0.7–1.3 °C (2008/2009) to 5.9–6.5 °C (2009/2010) lower than the long-term average. In the above seasons, the main growth stages of wheat (GS 30–39) were marked by dry spells. In April 2009 and 2010, precipitation levels accounted for only 0.11–0.28 of the rainfall noted in April 2008 (Table 3). In the second and third year of the study, the yields of winter wheat cultivars were 34 and 20% lower, respectively, than those observed in the first growing season (Table 5).
Table 3. Precipitation and temperature in 2007–2010 v. the long-term average (1981–2010)
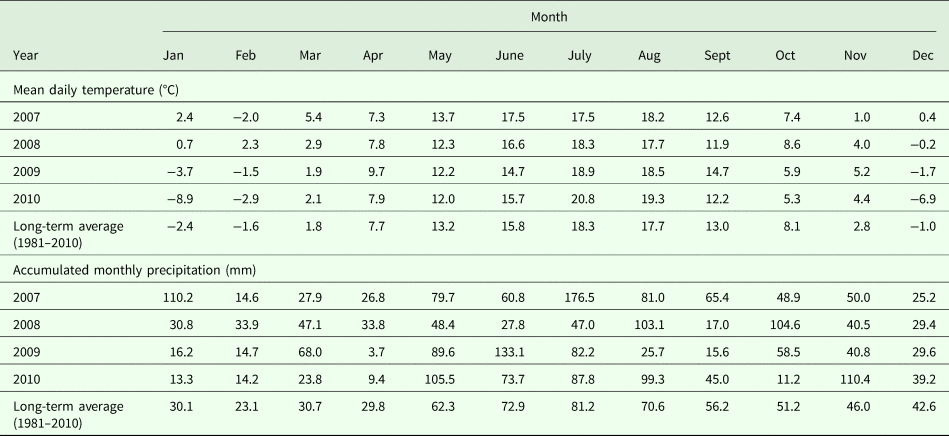
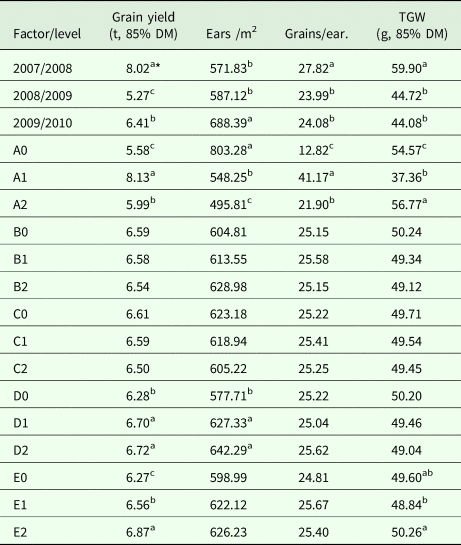
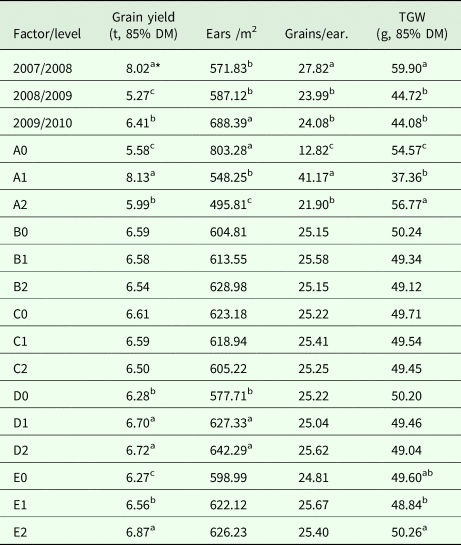
Table 4. Significance of differences between the mean values of the main effects: year (Y) and five agronomic factors (A, B, C, D and E) in an analysis of the yield components and grain yield of wheat
DM, dry matter; TGW, thousand grain weight.
* means with the same letter are not significantly different at P ⩽ 0.05 according to Tukey's HSD test.
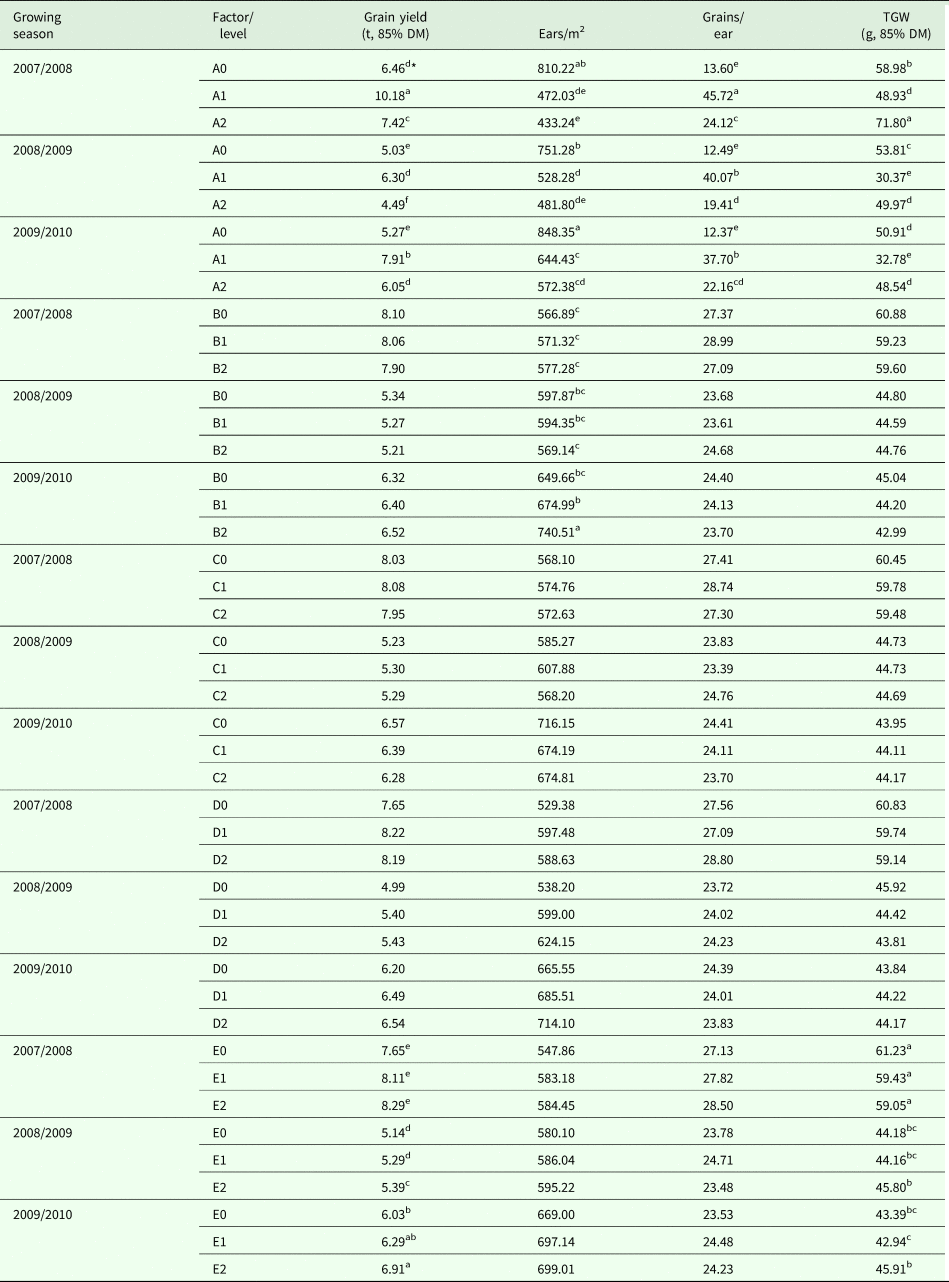
Table 5. Significance of differences between the mean values of interactions (Y × A, Y × B, Y × C, Y × D and Y × E) in an analysis of the yield components and grain yield of wheat
DM, dry matter; TGW, thousand grain weight.
* means with the same letter are not significantly different at P ⩽ 0.05 according to Tukey's HSD test.
Cultivar
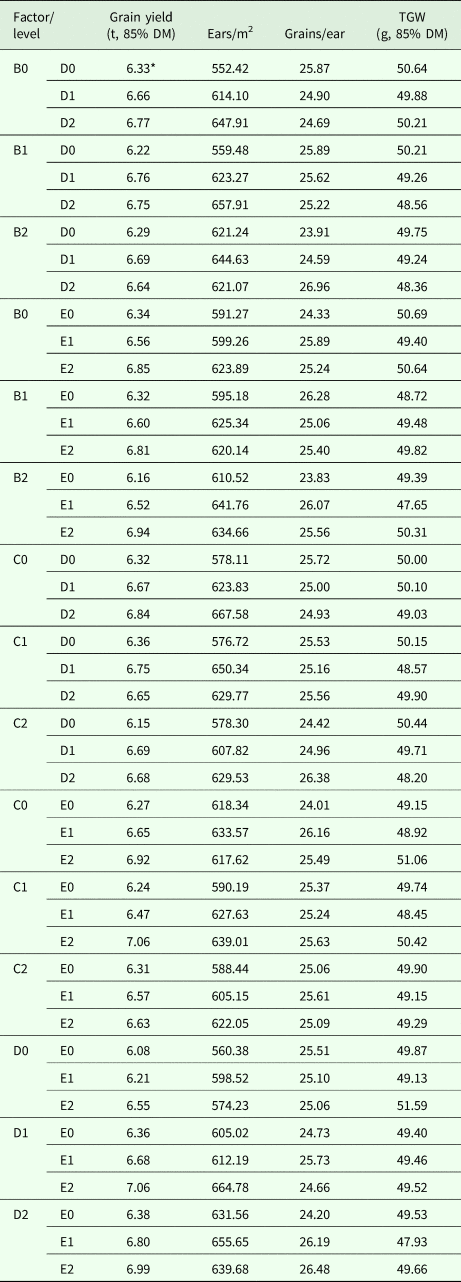
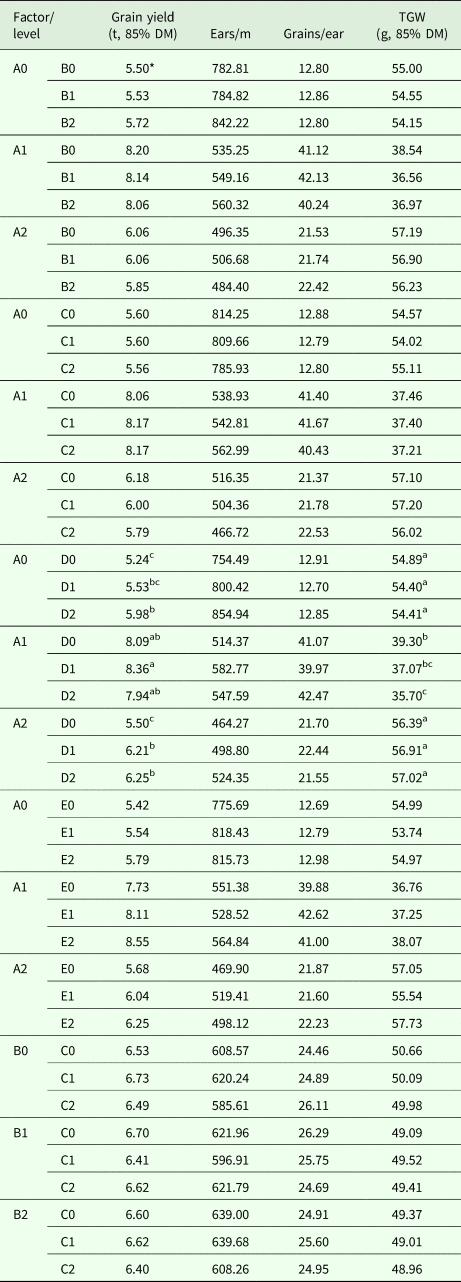
The highest number of ears/m2 was noted in spelt (751–848) in each year of the experiment (Table 5). Common wheat cv. Oliwin and durum wheat cv. Komnata produced 32 and 38% fewer ears/m2, respectively, than spelt cv. Schwabenkorn (Table 4). Regardless of species, all of the evaluated winter cultivars of wheat produced significantly (P < 0.01) more eras (572–848) in the third year of the experiment (Tables 4 and 5). In the analysed species of the genus Triticum, the number of grains per ear was not significantly influenced by the intensity of agronomic inputs (A × B, A × C, A × D, A × E) (Tables 2 and 6).
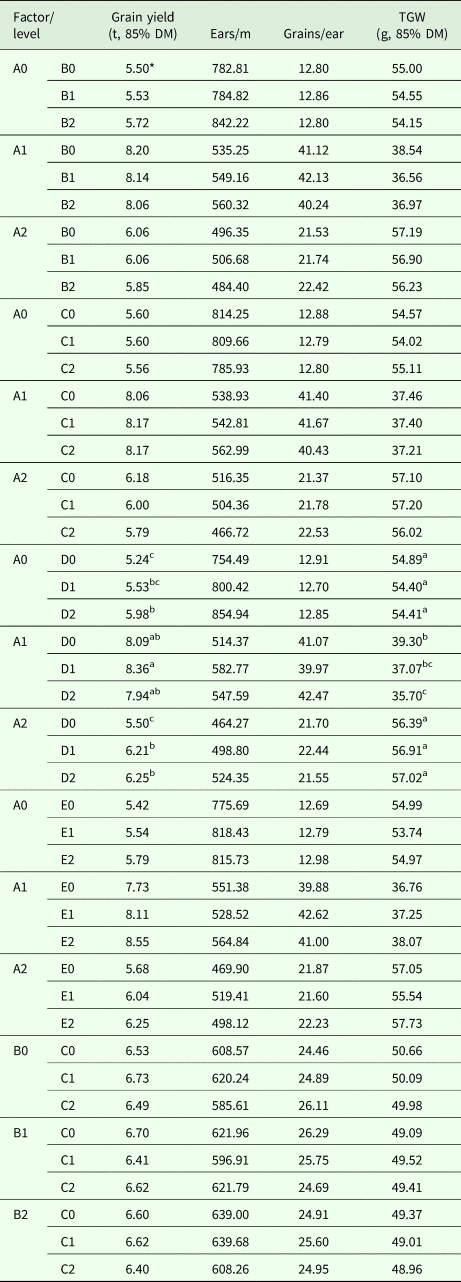
Table 6. Significance of differences between the mean values of interactions (A × B, A × C, A × D, A × E and B × C) in an analysis of the yield components and grain yield of wheat
DM, dry matter; TGW, thousand grain weight.
* means with the same letter are not significantly different at P ⩽ 0.05 according to Tukey's HSD test.
The number of grains per ear was a species-specific trait (Tables 2 and 4) and was not influenced by weather conditions (Tables 2 and 5). The number of grains per ear was highest in common wheat cv. Oliwin (41), average in durum wheat cv. Komnata (22) and lowest in spelt cv. Schwabenkorn (13) (Table 4). All of the winter wheat cultivars evaluated produced a higher number of grains per ear in the 2007/2008 growing season (Tables 4 and 5), which was characterized by the most favourable weather conditions for the growth and development of wheat during the experiment (Table 3).
The TGW of wheat is also a species-specific trait, but it is relatively strongly influenced by habitat and climate conditions (Tables 2 and 5). In the first growing season, TGW was highest in durum wheat cv. Komnata (71.80 g) (Table 5). In the second and third growing season, TGW was significantly (P < 0.01) highest in spelt cv. Schwabenkorn (53.81–50.91 g). In all experimental years, TGW was lowest in common wheat cv. Oliwin (30.37–48.93 g) (Table 5). On average, TGW weight was highest in durum wheat (56.77 g), somewhat lower in spelt (54.57 g) and lowest in common wheat (37.36 g) during the entire experiment (Table 4).
The results of the study confirmed the high yield potential of common wheat (8.13 t/ha) and considerable yield potential of durum wheat (5.99 t/ha) and spelt (5.58 t/ha) in NE Poland (Table 4). It should be noted that common wheat produced higher yields than spelt and durum wheat in each year of the experiment (Table 5). Weather conditions in the evaluated growing seasons merely modified the differences between common wheat and durum wheat (±24–28%) and spelt (±20–37%). On average, spelt yields were 0.41 t/ha (7%) lower than durum wheat yields (Table 4), excluding the second year of the experiment, when spelt yields were 0.54 t/ha (12%) higher than durum wheat yields (Table 5).
Sowing date
In all winter cultivars of wheat studied, stand density (number of ears/m2 before harvest) was not significantly differentiated by sowing date (A × B). The number of ears/m2 was significantly (P < 0.05) modified by the experimental conditions (Y × B) (Table 2). In the first growing season, delayed seeding did not induce significant differences in the number of ears/m2. In the second and third season, the number of ears/m2 was significantly (P < 0.05) higher when wheat was sown on the optimal (earliest) date, regardless of cultivar (Table 5). Seeding date did not exert a significant influence on the remaining yield components (grains/ear TGW) in the analysed Triticum species (Table 2).
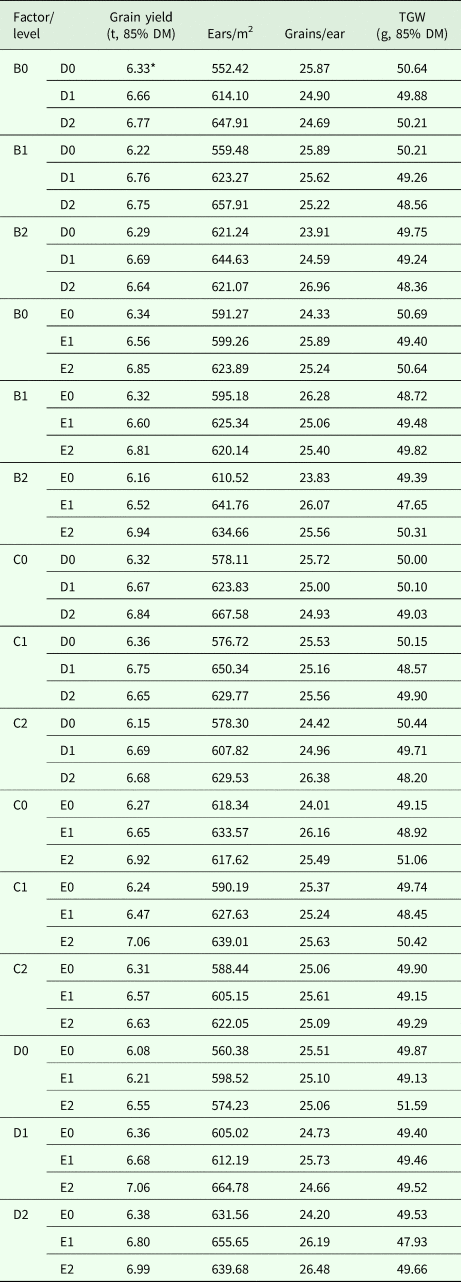
The evaluated winter wheat cultivars were highly tolerant of 10-day or 20-day delay in seeding (Tables 2 and 6). In the agro-ecological conditions of NE Poland, seed date was not correlated with the yield of the analysed winter cultivars of common wheat, durum wheat and spelt, regardless of habitat and climate conditions (Y × B) or the intensity of the remaining agronomic factors (A × B, B × C, B × D, B × E) (Tables 2, 5–7).
Table 7. Significance of differences between the mean values of interactions (B × D, B × E, C × D and D × E) in an analysis of the yield components and grain yield of wheat
DM, dry matter; TGW, thousand grain weight.
*means with the same letter are not significantly different at P ⩽ 0.05 according to Tukey’s HSD test.
Seeding rate
Seed rate (350–550 grains/m2) had no significant influence on grain yield or the yield-forming traits of the evaluated cultivars of common wheat, durum wheat and spelt, regardless of year (Y × C) or the intensity of the remaining agronomic factors (A × C, B × C, C × D, C × E) (Tables 2, 5–7).
Nitrogen rate
Common wheat, spelt and durum wheat produced the highest number of eras/m2 in treatments where the rate of spring N fertilization was determined based on the content of soil N min (Table 4), regardless of the experimental conditions (Y × D) or the intensity of the remaining agronomic factors (A × D, B × D, C × D, D × E) (Tables 2, 5–7). The number of ears/m2 was not significantly different in treatment D2, where the rate of N fertilizer was increased by 40 kg/ha relative to the balanced N rate (N min). Nitrogen fertilization did not differentiate the number of grains per ear in the analysed cultivars of common wheat, durum wheat and spelt, regardless of year (Y × D) or the intensity of the remaining agronomic factors (A × D, B × D, C × D, D × E) (Tables 2, 5–7). Spring N fertilization led to differences in TGW only in common wheat cv. Oliwin. The TGW weight of common wheat cv. Oliwin decreased by 6–9% in response to a higher N rate (Table 6), regardless of habitat and climate conditions (Y × D) or the remaining agronomic factors (A × D, B × D, C × D, D × E) (Tables 2, 5–7).
The analysed winter wheat cultivars responded differently to N fertilization in spring (Table 2). Common wheat cv. Oliwin and durum wheat cv. Komnata produced the highest yields (8.36 and 6.21 t/ha, respectively) in response to N fertilizer rates, determined based on the content of N min in soil (Table 6). Increasing the spring rate by 40 kg/ha in excess of the balanced N rate (D2) was not justified because it did not induce a further increase in the grain yield of common wheat and durum wheat. The grain yield of spelt cv. Schwabenkorn continued to increase in response to the highest rate of spring N fertilization (N min + 40 kg N/ha, D2). The grain yield of spelt cv. Schwabenkorn increased by 0.45 t/ha (8%) when the rate of N fertilizer applied in spring was higher than the optimal rate determined based on the soil N min content (Table 6). The responses of winter cultivars of the analysed wheat species to spring N fertilization were not influenced by the experimental conditions (Y × D) or the intensity of the remaining agronomic factors (A × D, B × D, C × D, D × E) (Tables 2, 5–7).
Disease control
An increase in the intensity of fungal disease control increased all yield components in the winter cultivars of Triticum species (Table 4). However, significant differences (P < 0.05) were observed only in TGW (Table 2). An increase in the intensity of disease control (0, 1, 2) increased TGW by 1–3% (Table 4), regardless of wheat species (A × E) or the intensity of the remaining agronomic factors (B × E, C × E, D × E) (Tables 2, 5–7). The application of two fungicide treatments and a growth retardant had a particularly beneficial effect (4% increase) on TGW in the evaluated cultivars of winter wheat in the second and third growing season (Table 5).
The use of fungicides was an important yield-protecting factor with a beneficial influence on all yield components of the evaluated winter cultivars of wheat (Table 2). An increase in the intensity of fungicide treatments improved the performance of all analysed Triticum species. The application of two fungicide treatments (E2) significantly (P < 0.05) increased the grain yield of all wheat species by 0.62 (E1) to 0.88 t/ha (E0) (10–15%). However, the yield-protecting effect of fungicide treatments differed across the evaluated Triticum species. The weakest response to intensified fungicide use was observed in spelt cv. Schwabenkorn, where grain yield was increased by only 370 kg/ha. The grain yield of durum wheat cv. Komnata and common wheat cv. Oliwin increased by 820 and 570 kg/ha, respectively, in response to two fungicide applications, and it was 2.2-fold and 1.5-fold higher, respectively, in comparison with the grain yield of spelt. It should also be noted that the responses of the evaluated cultivars of winter wheat to intensified fungicide treatment were not influenced by habitat and climate conditions (Y × E) or the intensity of the remaining agronomic factors (A × E, B × E, C × E, D × E) (Tables 2, 5–7).
Discussion
Cultivar
In the present study, all of the wheat species evaluated produced the highest yields in 2008, which was characterized by the most favourable overwintering conditions and the most uniform distribution of rainfall during the growing season. Common wheat was characterized by the highest yield (8.13 t/ha). The yields of durum wheat and spelt were 26 and 31% lower, respectively, in comparison with common wheat. The winter cultivars of durum wheat generally have a lower yield potential than common wheat, nonetheless, these differences can be modified by weather and habitat conditions during the growing season (Ehdaie and Waines, Reference Ehdaie and Waines2001; Cerón and Martel, Reference Cerón and Martel2003; Haidukowski et al., Reference Haidukowski, Visconti, Perrone, Vanadia, Pancaldi, Covarelli, Balestrazzi and Pascale2012). In a study conducted by Haidukowski et al. (Reference Haidukowski, Visconti, Perrone, Vanadia, Pancaldi, Covarelli, Balestrazzi and Pascale2012) in northern Italy, durum wheat yields were around 17% lower than common wheat yields. In southern Spain (Cerón and Martel, Reference Cerón and Martel2003), the average yield of durum wheat was only 7% lower than common wheat yield. In California (Ehdaie and Waines, Reference Ehdaie and Waines2001), durum wheat and common wheat were characterized by similar yields. The yield potential of spelt is generally lower in comparison with common wheat, however; the observed differences are influenced by climate and habitat conditions (Rüegger and Winzeler, Reference Rüegger and Winzeler1993; Rimle et al., Reference Rimle, Ruegger, Schmid and Stamp1995; Castagna et al., Reference Castagna, Minoia, Porfiri and Rocchetti1996; Sulewska, Reference Sulewska2006). Rimle et al. (Reference Rimle, Ruegger, Schmid and Stamp1995) and Castagna et al. (Reference Castagna, Minoia, Porfiri and Rocchetti1996) demonstrated that the differences in grain yields of common wheat and spelt are minimized under unfavourable growing conditions. The above-cited authors noted that spelt can produce higher yields than common wheat in cold and wet climates. Similar results were reported by Rüegger and Winzeler (Reference Rüegger and Winzeler1993), who compared the performance of spelt and common wheat under field conditions in Muri (altitude 459 m asl) and Oberwallestalden (1011 m asl) in Switzerland. In Muri, spelt yields were equivalent to 0.94 of winter wheat yields, whereas in Oberwallestalden, where climate and habitat conditions for wheat cultivation are far less supportive than in Muri, spelt yields were 10% greater than common wheat yields. In Central-Eastern Europe (Lithuania, Poland, Czech Republic), spelt yields are around 8–21% lower than common wheat yields (Lacko-Bartošová and Otepka, Reference Lacko-Bartošová and Otepka2001; Cyrkler-Degulis and Bulińska-Radomska, Reference Cyrkler-Degulis and Bulińska-Radomska2006; Jablonskytė-Raščė et al., Reference Jablonskytė-Raščė, Maikštėnienė and Mankevičienė2013).
Sowing date
The interaction between sowing date and weather conditions, particularly in regions with harsh winters, influences the grain yields of winter cultivars of Triticum species (Ali et al., Reference Ali, Ali, Sattar and Ali2010). The winter cultivars of wheat must be sown by a date which guarantees the achievement of at least three tillers during vegetative growth before winter dormancy (Legge et al., Reference Legge, Fowler and Gusta1983; Andrews et al., Reference Andrews, Pomeroy, Seaman, Butler, Bonn and Hoekstra1997; Dubis and Budzyński, Reference Dubis and Budzyński2006). Crop plants which achieve the above stage before winter have a greater chance of overwintering successfully. In NE Poland, sufficient tiller formation in the winter cultivars of common wheat, durum wheat and spelt can be achieved before winter only if they are sown in September. October seeding is generally regarded as late for all winter cultivars of Triticum species because it delays germination, seedling emergence and the initial stages of plant development and prevents complete tiller formation before winter (Budzyński, Reference Budzyński2012).
It should be noted that plant responses to sowing date could be a varietal feature that is strongly influenced by weather conditions. For this reason, the repeatability of results may be low or absent across years. In the current study, winter cultivars of common wheat, spelt and durum wheat did not respond to a 20-day delay in sowing, including October sowing, which is not recommended in NE Poland. Interactions were not observed between sowing date and seed rate. In a study of the winter cultivars of common wheat conducted in southern Poland (with milder winters) by Podolska and Wyzińska (Reference Podolska and Wyzińska2011), sowing date was an important yield-forming factor. In the cited study, a 14-day delay in sowing decreased grain yield by 15–21%, and a further 14-day delay in sowing decreased grain yield by 30% relative to the earliest sowing date (optimal for the local conditions) (Podolska and Wyzińska, Reference Podolska and Wyzińska2011). In experiments conducted in Pakistan by Sun et al. (Reference Sun, Zhang, Chen, Pei and Liu2007) and Ali et al. (Reference Ali, Ali, Sattar and Ali2010), the grain yield of common wheat decreased by 7–12% in response to 10–20 days’ delay in seeding. In a study carried out by Baloch et al. (Reference Baloch, Shah, Nadim, Khan and Khakwani2010) on the eastern coast of China, a 15-day delay in seeding lowered the grain yield of common wheat by only 1%. A considerable (21%) decrease in common wheat yield was reported only when seeding was delayed by 30 days (Baloch et al., Reference Baloch, Shah, Nadim, Khan and Khakwani2010). In a recent study, Dai et al. (Reference Dai, Wang, Dong, Qian, Yin, Dong, Chu and He2017) observed no significant response to a 15-day delay in the seeding of common wheat in northern China. Studies investigating the responses of common wheat to delayed seeding revealed significant yield-forming effects of the interactions between sowing date, genotype and weather conditions (Sun et al., Reference Sun, Zhang, Chen, Pei and Liu2007; Ali et al., Reference Ali, Ali, Sattar and Ali2010; Baloch et al., Reference Baloch, Shah, Nadim, Khan and Khakwani2010; Podolska and Wyzińska, Reference Podolska and Wyzińska2011; Dai et al., Reference Dai, Wang, Dong, Qian, Yin, Dong, Chu and He2017). In temperate climates (Eastern Europe, Central Europe), the winter cultivars of durum wheat are more likely to be affected by delayed sowing than the winter cultivars of common wheat because durum wheat is characterized by a longer (by 3–4 days) germination period (Budzyński, Reference Budzyński2012). In a study carried out by Szumiło and Rachoń (Reference Szumiło and Rachoń2008) in eastern Poland, the grain yield of durum wheat decreased by 17% in response to a 14-day delay in seeding. In Poland, winter spelt is most tolerant of changes in seeding date. The optimal seeding date for winter spelt is mid-September to late October (Budzyński, Reference Budzyński2012). In Germany, winter spelt also produced the highest yields when sown between the beginning and end of October (Probst, Reference Probst, Siebeneiher and Ostrowska1997). However, in a study by Sulewska et al. (Reference Sulewska, Koziara, Panasiewicz and Ptaszyńska2008), October seeding decreased spelt yields by 11% (0.31 t/ha).
Seed rate
Seed rate determines directly the number of eras/m2 in all cereal species (Budzyński, Reference Budzyński2012). Due to the strong response of stand density to weather conditions and agronomic factors, the interactions between cultivar and environmental conditions are rarely statistically significant (Sadras and Slafer, Reference Sadras and Slafer2012; Slafer et al., Reference Slafer, Savin and Sadras2014; Rozbicki et al., Reference Rozbicki, Ceglińska, Gozdowski, Jakubczak, Cacak-Pietrzak, Mądry, Golba, Piechociński, Sobczyński, Studnicki and Drzazga2015). Excessive stand density can compromise stand survival, contribute to plant loss and decrease the performance of the surviving plants without influencing grain yield. The optimal values of yield components that guarantee high grain yields in wheat are difficult to determine because they are significantly influenced by genotype, habitat and weather conditions (Budzyński, Reference Budzyński2012). In the current study, seed rates of 350–550 grains/m2 did not induce significant variations in the grain yield of the analysed wheat species. In a study of the winter cultivars of common wheat conducted by Bavec et al. (Reference Bavec, Bavec, Varga and Kovacevic2002) in a humid continental area in Slovenia, the highest grain yield of common wheat was reported in response to a seed rate of 500–650 grains/m2 (when sown on the optimal sowing date). When the seed rate was increased to 800 grains/m2 or decreased to 350 grains/m2, the grain yield of common wheat decreased by only 1–2%. In southern Europe (Croatia), a seed rate of 300 grains/m2 produced the highest yield of hulled spelt grain (6.91 t/ha), while grain yield decreased by 3–4% in response to a decrease (200 grains/m2) or an increase (400 grains/m2) in seeding rate (Pospišil et al., Reference Pospišil, Pospišil, Svečnjak and Matotan2011). In Central-Eastern Europe (Poland), spelt yield peaked (3.08 t/ha) at a seed rate of 500 grains/m2, whereas seed rates of 400 and 300 grains/m2 decreased yields by 4 and 8%, respectively (Pużyński et al., Reference Pużynski, Stańkowski, Pużyńska, Iwański, Wianecki and Biel2015). In most studies of spelt, the highest grain yields were reported at a seed rate of 400 grains/m2 (Briggs, Reference Briggs1988; Sulewska et al., Reference Sulewska, Koziara, Panasiewicz and Ptaszyńska2008; Mikos, Reference Mikos2012). Seed rates lower than 200 grains/m2 very rarely improved spelt yields (Troccoli and Codianni, Reference Troccoli and Codianni2005). The winter cultivars of durum wheat perform best when sown at a rate of 400–600 grains/m2 (Arduini et al., Reference Arduini, Masoni, Ercoli and Mariotti2006; Sulewska et al., Reference Sulewska, Koziara, Panasiewicz and Ptaszyńska2008; Budzyński, Reference Budzyński2012). In a study by Arduini et al. (Reference Arduini, Masoni, Ercoli and Mariotti2006), the yield of durum wheat sown at 400 grains/m2 was 42 and 21% higher than in treatments with seeding rates of 200 and 250 grains/m2, respectively. Such a strong response to a decrease in seeding rate could be attributed to the low tillering potential of selected cultivars of durum wheat (Budzyński, Reference Budzyński2012).
Nitrogen rate
Nitrogen fertilization is the key yield-forming trait in wheat grain production (Fageria et al., Reference Fageria, Baligar and Li2008; Budzyński, Reference Budzyński2012; Basso et al., Reference Basso, Cammarano, Fiorentino and Ritchie2013; Olszewski et al., Reference Olszewski, Makowska, Pszczółkowska, Okorski and Bieniaszewski2014). Subject to soil conditions and cultivar, common wheat yields can increase up to a fertilization level of 120–150 kg N/ha (Saint Pierre et al., Reference Saint Pierre, Peterson, Ross, Ohm, Verhoeven, Larson and Hoefer2008; Harasim et al., Reference Harasim, Wesołowski, Kwiatkowski, Harasim, Staniak and Feledyn-Szewczyk2016) and 200–240 kg N/ha in high-input systems (Sieling et al., Reference Sieling, Stahl, Winkelmann and Christen2005; Shekoofa and Emam, Reference Shekoofa and Emam2008). Winter durum wheat produced the highest grain yields in response to N rates of 150–180 kg N/ha (López-Bellido et al., Reference López-Bellido, López-Bellido and López-Bellido2006; Ercoli et al., Reference Ercoli, Masoni, Pampana, Mariotti and Arduini2013). In spelt production, the optimal N rate was determined at up to 50 kg N/ha (Koutroubas et al., Reference Koutroubas, Fotiadis and Damalas2012; Pospišil et al., Reference Pospišil, Pospišil and Brčić2016). It is worth noting that spelt showed lower N utilization efficiency values, probably due to its higher grain N concentration and lower N harvest index compared with common wheat (Koutroubas et al., Reference Koutroubas, Fotiadis, Damalas and Papageorgiou2014). In the current study, spelt yields continued to increase significantly in response to the highest rate of N fertilizer (98–118 kg N/ha) which was 40 kg N/ha higher than the balanced N rate calculated based on the N nim content of soil. Common wheat cv. Oliwin and durum wheat cv. Komnata produced the highest yields in response to the balanced N rates (N nim) of 138–158 and 98–118 kg N/ha, respectively, and a further increase in N rate (by 40 kg N/ha) did not lead to an increase in the grain yield of these wheat species.
Disease control
In southern Europe (Italy, Spain), fungicide treatments increased the grain yield of common wheat by 8–15% (Cerón and Martel, Reference Cerón and Martel2003; Scarpino et al., Reference Scarpino, Reyneri, Sulyok, Krska and Blandino2015). Fungicides are generally less likely to benefit wheat yields in the cooler climate of eastern and northern Europe (Olesen et al., Reference Olesen, Jørgensen, Petersen and Mortensen2003; Podolska, Reference Podolska2008; Kulik and Pszczółkowska, Reference Kulik and Pszczółkowska2011). In northern Europe (Denmark), a single fungicide treatment increased common wheat yield by 6–7% (Olesen et al., Reference Olesen, Jørgensen, Petersen and Mortensen2003). In Poland, the application of one or two fungicide treatments induced only a 4–5% increase in common wheat yields (Podolska, Reference Podolska2008). In common wheat ears artificially inoculated with a mixture of toxic Fusarium graminearum (Schwabe) and F. culmorum (W. G. Sm.) Sacc. strains, fungicide treatments increased grain yields by as much as 50–52% (Haidukowski et al., Reference Haidukowski, Visconti, Perrone, Vanadia, Pancaldi, Covarelli, Balestrazzi and Pascale2012). In durum wheat artificially inoculated with F. graminearum and F. culmorum, fungicides were 50% less effective than in common wheat (Haidukowski et al., Reference Haidukowski, Visconti, Perrone, Vanadia, Pancaldi, Covarelli, Balestrazzi and Pascale2012). Under field conditions, fungicides were equally effective in durum wheat and common wheat (Pląskowska and Chrzanowska-Drożdż Reference Pląskowska and Chrzanowska-Drożdż2010). Wiwart et al. (Reference Wiwart, Perkowski, Jackowiak, Packa, Borusiewicz and Buśko2004) and Suchowilska and Wiwart (Reference Suchowilska and Wiwart2006) demonstrated that spelt is highly resistant to disease. In practice, the above is manifested by lower fungicide efficacy in the production of spelt (Pospišil et al., Reference Pospišil, Pospišil, Svečnjak and Matotan2011). In the present study, wheat grain yields peaked when two fungicide treatments (GS 40 and 52) were applied in combination with a growth retardant (GS 30). The above treatments increased grain yields by around 10–11% in common wheat and durum wheat and by 7% in spelt. In absolute terms, fungicide treatments were twice as effective (measured by the increase in grain yield) in common wheat and durum wheat as in spelt.
Conclusions
Field experiments with more than three experimental factors are rarely established for organizational and financial reasons. In the current study, a field experiment with the 35–1 fractional factorial design supported an evaluation of five agronomic factors and analyses of selected experimental treatments without compromising the system's ability to detect significant treatment effects. The experimental design was used to test, under identical agro-ecological conditions, the winter cultivars of Triticum species whose agronomic requirements remain poorly researched.
In NE Poland, the highest grain yield (8.13 t/ha) was noted in the winter cultivar of common wheat (cv. Oliwin). The yields of the winter cultivars of durum wheat (cv. Komnata) and spelt (Schwabenkorn) were 26 and 31% lower, respectively, in comparison with common wheat. Nevertheless, the yields of durum wheat and spelt can be considered as highly satisfactory. The results presented here are based on a single variety of each species and with significant G × E interaction identified for each species; the use of other varieties are likely to produce differing responses which could be greater than the variation between species shown in the current study. The grain yields of the evaluated winter cultivars of common wheat, durum wheat and spelt did not respond to delayed seeding, including October seeding. The applied seed rates (350, 450, 550 grains/m2) had no significant influence on the grain yield of the analysed wheat species. Interactions were observed between cultivar and N rate. Common wheat cv. Oliwin and durum wheat cv. Komnata produced the highest yields in response to an N fertilizer rate calculated based on the N min content of soil. The grain yield of spelt cv. Schwabenkorn peaked when the balanced N rate (N min) was increased by 40 kg N/ha. In absolute terms, common wheat yields continued to increase significantly in response to the N rate of 138–158 kg N/ha, and durum wheat and spelt yields continued to increase in response to the N rate of 98–118 kg N/ha. In all evaluated wheat species, the highest grain yields were noted in response to two fungicide treatments applied in spring (GS 40 and 52). On average, the effectiveness of intensive fungicide treatments (measured by the increase in grain yield) was twice higher in common wheat and durum wheat than in spelt.
Financial support
The results presented in this paper were obtained as part of a comprehensive study financed by the University of Warmia and Mazury in Olsztyn (grant No. 20.610.020-300) and the National Science Center (grant No. NN310168939).
Conflicts of interest
None
Ethical standards
Not applicable


