


Introduction
In Mediterranean environments, forage production for dairy operation is both difficult and costly due to erratic rainfall (Francia et al., Reference Francia, Pecchioni, Destri Nicosia, Paoletta, Taibi, Franco, Odoardi, Stanca and Delogu2006; Lithourgidis et al., Reference Lithourgidis, Dordas, Damalas and Vlachostergios2011). Oat is among the major winter cereal forages cultivated throughout Greece; it is a nutritive, palatable, succulent and fast-growing fodder crop (Bladenopoulos, Reference Bladenopoulos2010). Under favourable conditions, oat can provide quality forage from late autumn to mid-spring (Stuart et al., Reference Stuart, Slatter, Elliott and Busby2002), which is mostly fed as green chop, while the spare is stored as hay in order to be used when green fodder is scarce (Stevens et al., Reference Stevens, Armstrong, Bezar, Griffin and Hampton2004). Yet, despite its apparent advantages, forage oat often demands high inputs, in terms of water and N availability, in order to achieve high yields (Iqbal et al., Reference Iqbal, Sufyan, Aziz, Zahid, Qamir-ul-Ghani and Aslam2009; Ramos et al., Reference Ramos, Altieri, Garcia and Robles2011; Choudhary and Prabhu, Reference Choudhary and Prabhu2016).
Mixtures of annual winter cereals and forage legumes for hay or silage are used extensively as a sustainable feed option in drought-prone environments (Papastylianou, Reference Papastylianou2004; Lithourgidis et al., Reference Lithourgidis, Dordas, Damalas and Vlachostergios2011). Particularly forage legumes have drawn special interest lately, as the European livestock sector is under pressure to increase homegrown protein and reduce the imported soybean meal and the scarcer fishmeal (Westhoek et al., Reference Westhoek, Rood, van den Berg, Janse, Nijdam, Reudink and Stehfest2011). As a result, many legume species have been considered as suitable for intercropping with oat. Among them, common vetch, an annual legume with a climbing habit and high protein concentration, is widely intercropped with oat because, in monocrops, its production is rather low since it normally lays on the ground thus impeding harvest (Robinson, Reference Robinson1969). Common vetch yield is also restricted by the lower tolerance to water deficit compared to cereals (Hadjichristodoulou, Reference Hadjichristodoulou1978). Oat mixed with vetch, at 35:65 seeding ratio, has shown high forage yield and protein concentration under Mediterranean conditions (Lithourgidis et al., Reference Lithourgidis, Vasilakoglou, Dhima, Dordas and Yiakoulaki2006; Dhima et al., Reference Dhima, Lithourgidis, Vasilakoglou and Dordas2007). These two species show high complementarity in N niche since common vetch meets a high percentage of its N needs from N2-fixation (Unkovich et al., Reference Unkovich, Baldock and Peoples2010), while oat uptakes N from deeper soil layers due to its fast and deep root growth (Hauggaard-Nielsen et al., Reference Hauggaard-Nielsen, Ambus and Jensen2001). Nitrogen fixation is critical for legume performance in cases of low soil N availability. Under Mediterranean conditions, utilization of the available soil N depends on soil water availability (Tsialtas et al., Reference Tsialtas, Kassioumi and Veresoglou2001), whereas excessive N should be avoided as it could lead to excessive vegetative growth and lodging (Papastylianou, Reference Papastylianou2004).
Forage yield and quality of common vetch mixtures with cereals depend on species composition and/or proportion and the phenological stage at harvest (Droushiotis, Reference Droushiotis1985; Roberts et al., Reference Roberts, Moore and Johnson1989; Lithourgidis et al., Reference Lithourgidis, Dordas, Damalas and Vlachostergios2011). However, while the selection of species, seeding ratios or management factors (e.g. sowing time and density, or N fertilization rates) have drawn considerable attention in the design of cereal/legume intercrops (Yu et al., Reference Yu, Stomph, Makowski, Zhang and van der Werf2016), the specific genotypic requirements of an intercrop have gained less interest (Baxevanos et al., Reference Baxevanos, Tsialtas, Vlachostergios, Hadjigeorgiou, Dordas and Lithourgidis2017). Hence, identifying compatible genotypes entails investigation for the potential attainment of high forage yield and nutritional quality.
Competitiveness is a genetically-controlled feature in plants but is also influenced by the environment. However, it cannot be attributed to a single plant trait; rather, it seems to be the convergence of several plant characteristics (Cousens et al., Reference Cousens, Barnett and Barry2003; Bertholdsson, Reference Bertholdsson2005; Asif et al., Reference Asif, Iqbal, Randhawa and Spanner2014). Intercrops have been reported to yield better when the interspecific competition is lower than the intraspecific competition (Vandermeer, Reference Vandermeer, Caroll, Vandermeer and Rosset1990). High inter- and intra-species variation has been reported for oats and common vetch in terms of the time of maturity, plant height, growth rate, and plant vigour (Assefa and Ledin, Reference Assefa and Ledin2001).
The objectives of the present work were to: (i) study the performance of oat accessions grown either as monocrops with and without N fertilizer or as intercrops with common vetch, for forage yield, quality and agronomic traits, and (ii) explore the oat genotypic requirement for maximizing complementarity, reducing competition in oat-vetch intercrop and increasing intercrop economic viability for forage production.
Materials and methods
Experimental site
A field experiment was established for two successive growing seasons (2014–15 and 2015–16) at adjacent sites in Hellenic Agricultural Organization – “Demeter”, Institute of Industrial and Fodder Crops (39o36′N, 22o25′E, 77 m a.s.l.), Larissa, Greece. The experimental site was left fallow the previous season, and seedbed preparation included mouldboard plough, disk harrow and cultivator. The soil was a clay loam (CL) Vertisol (pH 7.84, organic matter 15.6 g/kg, N-NO3 11.0 mg/kg, P-Olsen 12.0 mg/kg, CH3COONH4-extracted K 150.2 mg/kg and CaCO3 12.0 g/kg at 0–30 cm depth). Mean monthly temperatures and precipitation during the two growing seasons are presented in Fig. 1. Weather conditions were quite different between the two growing seasons. During 2014–15 growing season, both winter and spring were much warmer compared to 2015–16 season, while precipitation was much lower (January–March), but evenly distributed in spring (April–May).
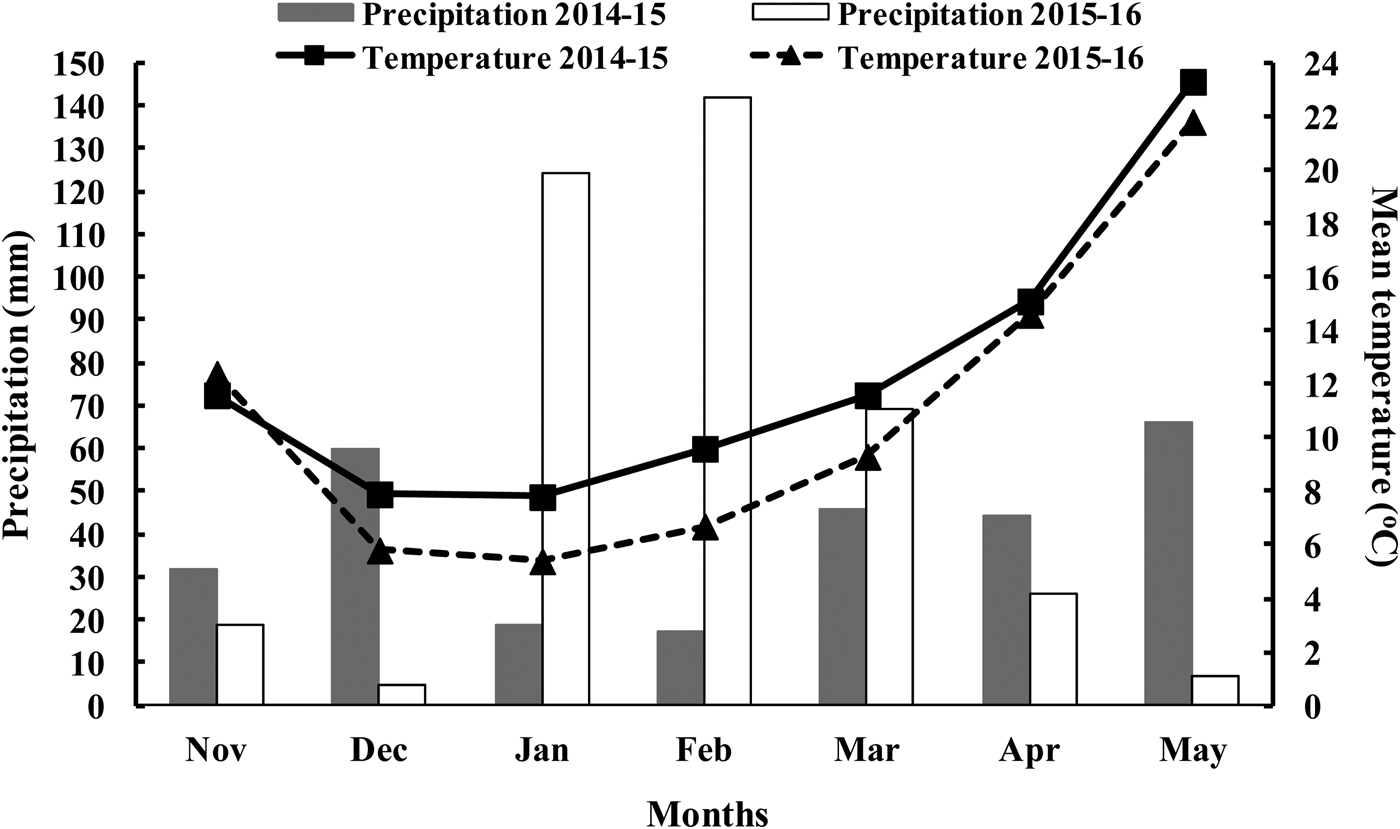
Fig. 1. Monthly mean air temperature and total precipitation during the two growing seasons (November–May).
Experimental design, treatments and cultural practices
The experiment was arranged as a Randomized Completed Block (RCB) design with 13 treatments (four oat accessions grown in monocrops with and without nitrogen (N) addition, the oat accessions in mixtures with common vetch cv. Pegasus, and the common vetch monocrop) and three replications. Each plot (6 m2) consisted of six 4-m long rows at 0.25 m separation. The seeding rate for oat and vetch monocrops was 440 and 170 seeds/m2, respectively. Based on seed numbers, a 35 : 65 oat : vetch ratio was sown in intercrops, corresponding to 154 seeds/m2 for oats and 110 seeds/m2 for common vetch, since this ratio has been found optimum for the local conditions (Lithourgidis et al., Reference Lithourgidis, Vasilakoglou, Dhima, Dordas and Yiakoulaki2006; Dhima et al., Reference Dhima, Lithourgidis, Vasilakoglou and Dordas2007). The seeds were mixed and sown by hand in mid-November, while N fertilizer was applied in early February as urea (46-0-0) without urease inhibitor at a rate of 100 kg N/ha, as recommended by the local agronomic practices (Bladenopoulos, Reference Bladenopoulos2010).
Oats exhibited winter hardiness without frost damage as well as the common vetch. Thus, the mean establishment of species was >90%. The crop was kept free of weeds by hand-hoeing when necessary. Satisfactory nodulation was verified by visual examination of roots. Irrigation was not applied in both growing seasons.
Oat and common vetch varieties
Three high-yielding oat lines (B2, B3, B4) derived from the landrace Ntopio Elassonas and the commercial, widely-adaptable oat cv. Flega (Bladenopoulos, Reference Bladenopoulos2010), registered by Hellenic Agricultural Organization – “Demeter”, Institute of Plant Breeding and Genetic Resources, Thermi, Greece, were used. The oat accessions were selected for the study upon their contrasting maturities (i.e. Flega: very early, B3: early, B4: moderate and B2: late maturing) and plant heights (i.e. B2: very short (75 cm), B3 and B4: moderate tall (95 and 90 cm, respectively), and Flega: tall (105–110 cm)). The common vetch cv. Pegasus (Hellenic Agricultural Organization – “Demeter”, Institute of Industrial and Fodder Crops, Larissa, Greece) was selected for its wide adaptation and the high forage yield potential in monocrops.
Agronomic and yield measurements
The agronomic traits were determined in monocropped or intercropped oats or common vetch on ten randomly selected plants per plot per species and the average was calculated constituting the value per plot. Lodging was visually assessed in oats only.
Height at stem elongation stage (HSE): measured at oat stem elongation growth stage (BBCH 32, Lancashire et al., Reference Lancashire, Bleiholder, Langelüddecke, Stauss, Van den Boom, Weber and Witzenberger1991), as the distance from the soil surface to the top of the canopy and considered as an index of early vigour.
Final plant height (FPH): measured at forage maturity (BBCH 77), as the distance from the soil surface to the uppermost point of the plant.
Days to flowering (DtF): in oats, it was the number of days from 1 January till 50% of the inflorescences were fully emerged (BBCH 65). In vetch, it was the number of days from 1 January to the day of the first open flower (sporadically within the population, BBCH 61). This trait was regarded as an index of earliness.
Lodging percentage (Lodg): measured in oats grown in monocrops and intercrops. It was the degree of lodging in percentage scale with 0% to indicate fully-upright plants and 100% to correspond to completely lodged plants at maturity.
Monocropped oats were harvested at the beginning of anthesis of each cultivar, whereas monocropped common vetch and the mixtures were harvested at the silage vetch maturity (BBCH 77), when 60–70% of the pods had reached the typical length and when they were pressed, the juice was exuded (Dean, Reference Dean2001). Aboveground biomass was determined in the four inner rows in each plot, which was cut to ground level, with manual shears. To determine the botanical composition, dry matter yield (DM) and forage quality, a subsample of ca. 1 kg was obtained from each plot. The plants were sorted by hand to the component species (vetch or oat), dried at 65°C for 72 h and then ground to pass a 1 mm screen. The vetch contribution (VPC, g/kg) to the DM was calculated.
Quality assessments
Total N concentration (g/kg) was determined using the Kjeldahl method and crude protein concentration (CP) was calculated by multiplying total N by 6.25 (AOAC, 2006). Furthermore, the crude protein yield (CPY) was calculated as DM × CP. Other quality traits as neutral detergent fibre (NDF), acid detergent fibre (ADF) and acid detergent lignin (ADL) were determined according to Van Soest et al. (Reference Van Soest, Robertson and Lewis1991) using an ANKOM 220 Fibre Analyzer (ANKOM Technology Corporation, NY, USA). Hemicellulose content (Hem) was estimated as the difference between NDF and ADF (Harris, Reference Harris1970). The in vitro DM digestibility method (Tilley and Terry, Reference Tilley and Terry1963; Harris, Reference Harris1970) was used to determine digestibility.
The following equations were used for further quality calculations (Horrocks and Vallentine, Reference Horrocks and Vallentine1999; Undersander and Moore, Reference Undersander and Moore2002):


where TDN, total digestible nutrients; DMI, dry matter intake; DDM, digestible dry matter; RFV, relative feed value; RFQ, relative forage quality; NEL, net energy for lactation.
Competition and economic indices
The advantage of the intercrops over monocrops and the effect of competition between the two intercropped species were calculated using different competition indices as below:
The partial and total land equivalent ratios (LER) were used to compare the biological efficiency and the productivity [hereafter referred as modified LER (LERm)] of intercropping compared to monocropping (Gebeyehu et al., Reference Gebeyehu, Simane and Kirkby2006). The total LER (LERt) was calculated by standardizing against the yield of the respective oat or vetch monocrops:


where Y o and Y v were the DM of oats and vetch, respectively, in monocrops and Y ov and Y vo were the DM of oats and vetch, respectively, in intercrops.
Additionally, the modified total LER (LERmt) was calculated by standardizing against the monocrop DM of the best-performing oat or vetch genotype:


where Y mo and Y mv were the highest DM of oats and vetch, respectively, in monocrops and Y ov and Y vo were the DM of oats and vetch, respectively, in intercrops.
To overcome the weakness of LER to take into account the value and the cost of the crops that are being sown, the replacement value intercropping index (RVI) was calculated. The RVI provides information about the economic viability of an intercropping system and it takes into account the input cost in the production process of the primary monoculture that is compared (Moseley, Reference Moseley1994; Singh et al., Reference Singh, Ahalawat and Sharma2015). The RVI calculation follows:

where a, b were the commercial value of oat and vetch DM, Y ov, Y vo and Y o were defined previously and C was the additional input cost associated with the oat monoculture. The result of this equation is the fraction by which the intercrop is more or less valuable than monocrop.
Similarly, the modified replacement value intercropping index (RVIm) was calculated for comparing the productivity of intercropped oats against the respective best-yielding oat monocrop (Gebeyehu et al., Reference Gebeyehu, Simane and Kirkby2006):

where a, b, Y ov, Y vo, Y mo and C were as defined previously. The result of this equation is the fraction by which the intercrop is more or less valuable in comparison to the most productive monocrop.
The commercial value of oats DM was considered at a = €180/t and of vetch at b = €250/t. The additional input cost (C) of monocrop oat was considered as follows:
-
Cost of N fertilization: €91/ha,
-
Cost of seeding for oat monocrops: €79.2/ha,
-
Cost of seeding for oat : vetch intercrops: €73.8/ha.
Thus, the additional cost was calculated as:
additional cost of oat monocrops = €5.4/ha (Cost of seeding for oat monocrops – Cost of seeding for oat : vetch intercrops),
Additional cost of oat monocrops with N fertilization = €96.4/ha (Additional cost of oat monocrops + Cost of N fertilization).
The estimates based on oat monocrops with N addition were abbreviated as LERtN, LERmtN, RVIN and RVImN, while those based on oat monocrops without N supplementation as LERtnN, LERmtnN, RVInN and RVImnN, respectively.
Statistical analyses
A three-way analysis of variance (ANOVA) referred to cropping system × growing season × genotype (Cs × Gs × G) model using the mixed procedure, was performed. Cropping system and G were considered as fixed factors and Gs as a random effect (Annicchiarico, Reference Annicchiarico2002). The sum of squares (SS) was partitioned into cropping system (SSCs), growing season (SSGs), genotype (SSG), and the two- and three-way components (SSGs×Cs, SSG×Gs, SSG×Cs, and SSGs×G×Cs). ANOVA was performed using the statistical software JMP 5.1 (SAS Institute 2004) and the means were compared using the LSD test at P ≤ 0.05. Correlation analyses were performed between the agronomic traits, DM, CP and CPY and the bivariate analysis between the cropping systems was used to study the genotype × cropping system interaction.
Results
Forage yield
Growing season (Gs), cropping system (Cs), genotype (G) and the G × Cs interaction had significant effects on DM and CPY (Table 1). However, despite the variability in weather conditions across the two growing seasons, DM and CPY were not affected by the G × Gs interaction. The most significant interaction was the G × Cs interaction, which for DM, had an almost threefold higher contribution to variation compared to the G × Gs interaction (18.4 vs. 6.6), indicating a strong genotypic interaction across cropping systems (Table 1). The over-season mean comparisons for DM showed that the intercrops (OatsI) produced more DM (45.1%), 7.97 t/ha in comparison to 5.49 t/ha of common vetch monocrop. Moreover, OatsI produced more DM (3.4%) compared to OatsnN (7.71 t/ha) and less DM (5.0%) than OatsN (8.39 t/ha). The VPC to the intercrop DM ranged from 479.3 g/kg (B3-Peg) to 770.4 g/kg (B2-Peg) (Table 2). Furthermore, OatsI produced higher CPY (from 29.8% up to 75.5%) compared to common vetch monocrop, OatsN and OatsnN. The mixtures with the higher CPY were Fle-Peg (1.08 t/ha) and B2-Peg (1.06 t/ha). Nitrogen application in oats resulted in the higher increase of CPY than DM because the CPY (0.72 t/ha) in OatsN was on average, higher (26.3%) in comparison to OatsnN (0.52 t/ha).. The respective DM increased only by 8.8% (Table 2).
Table 1. Analysis of variance as percentage (%) contribution regarding the treatment sum of squares (%SS) of oat-vetch intercrops and the respective monocrops

DF, degree of freedom, DM, dry matter yield; CP, crude protein concentration; CPY, crude protein yield; DtF, days to flowering; HSE, height at stem elongation stage of oat; FPH, final plant height; Lodg, Lodging.
Superscript values are significance level of SS; ns, not significant.
Table 2. Over-season mean comparisons of dry matter yield (DM), crude protein yield (CPY), and contribution of common vetch (VPC) in the DM of the mixtures

OatsnN, oat monocrops without nitrogen (N) addition; OatsI, oat-vetch intercrops; OatsN, oat monocrops with N addition; Peg, common vetch cv. Pegasus.
Τhe regression between OatsnN and the respective OatsI was significant (R2 = 0.68, P ≤ 0.05, n = 4) for DM (Fig. 2a). However, the regression between OatsN and OatsI was not significant (Fig. 2b) and thus, the most productive treatment in OatsnN was that of the oat genotype B3 (Fig. 2a). Additionally, the oat cv. Flega was the most responsive to N, while the oat genotypes B2 and B3 were the least responsive (Fig. 2b).

Fig. 2. Regression analyses of dry matter yield (DM) of unfertilized oat monocrops (DM OatsnN) against intercropped (DM OatsI) oat accessions [B2, B3, B4, cv. Flega (Fle)] with common vetch cv. Pegasus (Peg) (a) and oat monocrops supplemented with N (DM OatsN) against intercropped (DM OatsI) oat accessions (b) across two growing seasons. Where *, significant at 5% probability; ns, not significant.
Forage quality
Crude protein concentration was strongly affected by the genotype (Table 1). Across the growing seasons, the CP of common vetch monocrop was almost the double (140.2 g/kg) than that of OatsnN (71.8 g/kg) and OatsN (86.7 g/kg) (Table 3). Thus, the higher CP of OatsI (128.2 g/kg) was primarily attributed to vetch participation in the mixture. The mixture with the highest CP was B2-Peg (140.2 g/kg), which had the highest VPC (770.4 g/kg) (Table 2). On the other hand, the lowest CP (111.6 g/kg) was found in B3-Peg mixture, the intercrop with the lowest VPC (479.3 g/kg).
Table 3. Over-season mean comparisons of crude protein concentration (CP), neutral detergent fibre (NDF), acid detergent fibre (ADF), hemicellulose (Hem), acid detergent lignin (ADL), digestibility (Dig), total digestible nutrients (TDN), dry matter intake (DMI), digestible dry matter (DDM), relative feed value (RFV), relative forage quality (RFQ) and net energy for lactation (NEL)

ns, not significant; OatsnN, oat monocrops without nitrogen (N) addition; OatsI, intercrops; OatsN, oat monocrops with N addition; Peg, common vetch cv. Pegasus.
The NDF of OatsnN and OatsN were the highest (619.7 and 604.4 g/kg) followed by OatsI (507.5 g/kg) and common vetch cv. Pegasus (418.5 g/kg) (Table 3). The NDF in intercrops was lowest when the VPC in DM was the highest. Thus, the B2-Peg mixture (high VPC) had the lowest NDF (477.4 g/kg), while the B3-Peg intercrop (low VPC) showed the highest NDF (532.2 g/kg).
The ADF and Hem concentration followed a similar to the NDF pattern. Both ADF and Hem in common vetch monocrop was lower compared to oat monocrops (Table 3). Furthermore, the highest ADF value (339.7 g/kg) was measured in the B3-Peg mixture, while the lowest (303.9 g/kg) was found in the B2-Peg mixture. Similarly, the B3-Peg intercrop had the highest Hem, whereas the B2-Peg mixture had the lowest. The differences were small and insignificant regarding ADL; however, they followed the same ranking with CP. Thus, the common vetch monocrop had, on average, higher ADL value (79.9 g/kg) compared to oat monocrops (59.5–59.6 g/kg). Digestibility followed the trend of CP as well; it was higher for common vetch monocrop and ΟatsI (639.4 and 614.2 g/kg), but it was lowest in OatsnN (477.2 g/kg). The B2-Peg mixture was the most digestible (649.2 g/kg). The same ranking was found for TDN, with B2-Peg mixture to have the highest value (621.2 g/kg) and B3-Peg the lowest (574.9 g/kg). Regarding RFV and RFQ, indices derived from ADF and NDF, common vetch monocrop and OatsI had higher values than OatN and OatnN. The B2-Peg mixture had significantly higher RFV (1270.6 g/kg) compared to the B3-Peg mixture (1091.1 g/kg), and the values of RFQ were close to RFV. Similar was the ranking for NEL; the B2-Peg mixture had higher values (15.0 Mcal/kg) compared to the B3-Peg mixture (14.1 Mcal/kg) (Table 3).
Competition and economic indices
The partial LER of common vetch (LERvetch) plotted against the partial LER for OatsnN (LERoatsnN) showed that mixture B3-Peg, being in the area (d) of the diagram, flagged that both species performed better in intercrops, whereas the other mixtures were located in area (b), meaning that oat growth was suppressed by common vetch competition (Fig. 3). The oat genotype B2, occupying the furthest right position on the diagram, was the most competitively suppressed by the common vetch. However, the ranking of the intercrops for LER was the same, even when the oats supplemented with N (data not shown).

Fig. 3. Partial land equivalent ratio (LER) of common vetch cv. Pegasus (LERvetch) plotted against LER of unfertilized oats (LERoatsnN) for the oat accessions (B2, B3, B4, cv. Flega (Fle)) intercrops with common vetch (Peg). Area (a) corresponds to vetch suppression by oats, the reverse holds in the area (b), in area (c) both species are suppressed in the mixture due to competition, while in area (d) species are facilitated in the mixture.
The LERtN was significantly higher than 1.0 for all the intercrops; the B2-Peg and B3-Peg mixtures were significantly higher than the rest, but when DM was standardized to monocrops without N addition (OatsnN), the best LERtnN (1.43) was found for the B2-Peg mixture (Table 4). The RVI values followed the same trend.
Table 4. Land equivalent ratio (LER), replacement value intercropping index (RVI) for oats (B2, B3, B4, cv. Flega (Fle)) intercropped with common vetch cv. Pegasus (Peg). Means were averaged over two growing seasons
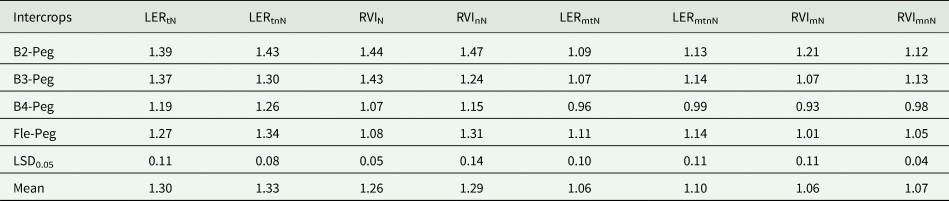
LERtN, LERtotal with nitrogen (N) addition; LERtnN, LERtotal without N addition; RVIN, RVI with N addition; RVInN, RVI without N addition; LERmtN, modified LERtotal with N addition; LERmtnN, modified LERtotal without N addition; RVImN, modified RVI with N addition; RVImnN, modified RVI without N addition.
The LERmtN and LERmtnN indicated that the intercrops B2-Peg, B3-Peg and Fle-Peg had no significant differences. The RVImN showed that B2-Peg mixture was 21% more economically viable when compared to OatsN, whereas the B2-Peg and B3-Peg mixtures had higher RVImnN, by 12 and 13%, respectively, when compared to OatsnN (Table 4).
Agronomic traits
A two-day delay was observed in the flowering of OatsI (126.2 days) in comparison to OatsnN and OatsN (124.1 and 124.4 days, respectively, Table 5). The oat line B2 in intercrops was the last to reach anthesis (128.3 days), whereas the earliest was the cv. Flega in intercrops (123.7 days). Regarding the HSE, OatsI and OatsN were, on average, 3.1 cm taller compared to OatsnN. The oat line B3 in intercrops had the higher HSE among OatsI (53.1 cm) and OatsNn (54.4 cm). The ranking differed among the OatsN, since B3N treatment ranked third in HSE (48.3 cm), while the oat line B2 had the lowest HSE across the three cropping systems. Regarding the FPH, cv. Flega was the tallest in all three cropping systems, whereas the oat line B2 was the shortest. Finally, the treatments B4N and B4 in intercrops were the most susceptible to lodging (41.4 and 35.6%, respectively).
Table 5. Mean comparisons for days to flowering (DtF), height at stem elongation stage (HSE), final plant height (FPH) and lodging (Lodg) over two growing seasons. At the bottom, means per treatment are presented

ns, not significant; OatsnN, oat monocrops without nitrogen addition; OatsI, oat-vecth intercrops; OatsN, oat monocrops with nitrogen addition, Peg; common vetch cv. Pegasus.
Nevertheless, there was no significant difference in DtF for common vetch in intercrops. The HSE and FPH values were highest in the B2-Peg mixture (55.4 and 110.4 cm, respectively) and shortest in the B3-Peg (52.2 and 97.5 cm, Table 5).
Correlations between agronomic parameters and yield
Dry mater yield was negatively correlated with DtFoats (r = −0.66, P < 0.01), Lodgoats (r = −0.87, P < 0.01) and FPHvetch (r = −0.69, P < 0.01). Crude protein yield was positively correlated with DtFoats (r = 0.71, P < 0.01), HSEvetch (r = 0.93, P < 0.01) and FPHvetch (r = 0.80, P < 0.01). Moreover, negative correlations were found for CPY with HSEoats (r = −0.88, P < 0.01) and FPHoats (r = −0.87, P < 0.01, Table 6).
Table 6. Pearson correlations between intercrop dry matter yield (DM) and crude protein yield (CPY) with oat and vetch days to flowering (DtH), height at stem elongation stage (HSE), final plant height for oats and vetch (FPH) and Lodging (Logd) in the intercrops

Superscript values are significance level; ns, not significant; †, not determined to avoid spurious correlation. n = 24.
Discussion
Effects of main factors on the determined traits
Despite the variability in weather conditions between the two growing seasons, DM, CP and CPY were not affected by the G × Gs interaction and this is consistent with previous studies in Greece (Dhima et al., Reference Dhima, Lithourgidis, Vasilakoglou and Dordas2007; Lithourgidis et al., Reference Lithourgidis, Vasilakoglou, Dhima, Dordas and Yiakoulaki2006, Reference Lithourgidis, Dhima, Vasilakoglou, Dordas and Yiakoulaki2007) and Spain (Caballero et al., Reference Caballero, Goicoechea and Hernaiz1995), where the G × Gs interaction was reported as either not significant or small.
The oat agronomic traits DtF, HSE and FPH were mainly affected by G, as it was indicated by the significant G × Cs interaction. This interaction for DM, CPY and agronomic traits underlined the need to shift the current selection procedure, that has been primarily focused on the selection of species, seeding ratios and management practices (Caballero et al., Reference Caballero, Goicoechea and Hernaiz1995; Papastylianou, Reference Papastylianou2004; Lithourgidis et al., Reference Lithourgidis, Vasilakoglou, Dhima, Dordas and Yiakoulaki2006; Dhima et al., Reference Dhima, Lithourgidis, Vasilakoglou and Dordas2007; Vasilakoglou et al., Reference Vasilakoglou, Dhima, Lithourgidis and Eleftherohorinos2008) to the selection of genotypes as well (Baxevanos et al., Reference Baxevanos, Tsialtas, Vlachostergios, Hadjigeorgiou, Dordas and Lithourgidis2017).
Francis et al. (Reference Francis, Flor, Temple, Papandick, Sanchez and Triplett1976) and Smith and Francis (Reference Smith, Francis and Francis1986) argued that the differential responses of cultivars across cropping systems have yet to be elucidated and the germplasm selection based on cropping systems depends on the extent of the G × Cs variation, which can be highlighted by the relative performance of different cultivars in two or more systems. Likewise, the data of this study indicated a high magnitude of G × Cs variation in comparison to the G × Gs interaction (threefold higher) for DM. This implies that the performance of genotypes was less consistent over cropping systems than over growing seasons. Thus, in order to develop high yielding cultivars suitable for intercropping and optimum resource allocation, it would be more efficient to test numerous genotypes across different cropping systems than across several growing seasons (Gebeyehu et al., Reference Gebeyehu, Simane and Kirkby2006; Baxevanos et al., Reference Baxevanos, Tsialtas, Vlachostergios, Hadjigeorgiou, Dordas and Lithourgidis2017).
According to the present study, intercrops produced, on average, 45.1% more DM than common vetch and 5.0% less DM compared to oat monocrops supplemented with N. Nevertheless, the intercrops produced 3.4% more DM than oat monocrops grown without N addition. In previous studies, it has been reported that yields of legume-cereal intercrops were intermediate or lower than those of cereal monocrops. In Greece, Lithourgidis et al. (Reference Lithourgidis, Vasilakoglou, Dhima, Dordas and Yiakoulaki2006) reported that the oat : vetch intercrop (common vetch cv. Melissa:oat cv. Pallini) produced 29–34% higher DM than vetch monocrop, but it had 18–21% less DM compared to oat monocrop. Caballero et al. (Reference Caballero, Goicoechea and Hernaiz1995) reported that the oat : vetch intercrops produced 34% more DM than common vetch monocrop, but they yielded 57% lower than oat monocrops. However, Giacomini et al. (Reference Giacomini, Vendruseolo, Cubilla, Nicoloso and Fries2003) found that the intercropped oats produced more than the oat monocrops.
As the residual N availability was low in the present trial (11.0 mg N-NO3/kg), the supplementation of N stimulated the growth of oats in monocrops. However, the intercrops produced 3.4% more DM than the unfertilized oat monocrops because common vetch in the mixtures, as a N2-fixing species, differentiated its N niche. Nitrogen fixation is critical when soil N availability is low and under such conditions, intercropping plays a significant role (Bulson et al., Reference Bulson, Snaydon and Stopes1997). Acquisition of soil N by cereals may reduce N availability to legumes and consequently force them to increase N2-fixation (Tsialtas et al., Reference Tsialtas, Baxevanos, Vlachostergios, Dordas and Lithourgidis2018). Assefa and Ledin (Reference Assefa and Ledin2001) have also indicated that, under low N availability, oat growth was suppressed in favour of vetch and this was confirmed in the present study by the VPC to the DM of the intercrop. Specifically, VPC ranged from 770.3 g/kg in the B2-Peg mixture to 479.3 g/kg in the B3-Peg mixture, indicating the strong interactions between oat genotypes and common vetch.
A meta-analysis by Yu et al. (Reference Yu, Stomph, Makowski, Zhang and van der Werf2016) demonstrated that an increase in density of a species increased its relative yield and decreased the relative yield of the companion species. Moreover, N fertilization appeared to have a pivotal role, since the relative yield of cereals increased and that of legumes decreased as N rate increased. In the present study, both seeding rate and soil N availability in intercrops were identical among the mixtures. However, the genetic differences between oats and the G × Cs interaction resulted in the differential contribution of the oat genotypes in the DM of intercrops. Lithourgidis et al. (Reference Lithourgidis, Vasilakoglou, Dhima, Dordas and Yiakoulaki2006) reported that DM in oat : vetch mixtures was not affected by the seeding ratio of either common vetch or oat. Nevertheless, the VPC increased by 17% when the vetch seeding ratio increased from 55% to 65%. In our work, the difference between the highest and the lowest VPC was 291.1 g/kg (37.8%), indicating a large genotypic effect.
The regression analysis between OatsnN and OatsI (Fig. 2a) indicated a moderate correlation (R2 = 0.68) between the two cropping systems suggesting that the OatsnN treatment could be used as a performance predictor in intercrops. However, when the evaluation of oats was conducted under N supplementation, the correlation was insignificant (Fig. 2b). According to Baudoin et al. (Reference Baudoin, Camarena and Lobo1997), genetic changes of the component crops should be accompanied by modifications in agronomic practices in order for the cultivars to be properly adapted to the chosen system (Smith and Francis, Reference Smith, Francis and Francis1986). However, Galwey et al. (Reference Galwey, De Queiroz and Willey1986) pointed out that the correlation between monocrops and intercrops gives only their relationship, whereas the breeder is interested in identifying cultivars that depart from the trend. For example, the oat genotype B3 was much less responsive to N, even though it produced the highest DM without N addition, indicating that it could be suitable for low input conditions. On the other hand, oat cv. Flega was the most responsive to N fertilization in monocrops and it also yielded high in intercrops, suggesting that it can be used as a genotype of wide adaptability in various cropping systems.
Crude protein concentration in forage is the major criterion for forage quality appraisal. By extension, CPY is also critical since CP harvested per area basis is important for livestock operations (Caballero et al., Reference Caballero, Goicoechea and Hernaiz1995; Lithourgidis et al., Reference Lithourgidis, Vasilakoglou, Dhima, Dordas and Yiakoulaki2006). According to our results, CPY in oats supplemented with N was 26.3% higher than that of oat monocrops without N addition. Assefa and Ledin (Reference Assefa and Ledin2001) reported that soil fertility and fertilizer application can alter the contribution of particular parts of oat plants such as leaves, stem and panicle fractions. Thus, an increase in leaves and panicle may increase the CP, whereas an increase in stems may reduce it. In the present study, the CP in common vetch was almost twofold higher than in oat monocrops and the vetch fraction was the main determinant of CP in mixtures. Thus, the B2-Peg mixture had the highest CP (140.2 g/kg), whereas the B3-Peg intercrop showed the lowest (111.6 g/kg).
Other important quality traits for forages are NDF, ADF and Hem, the derivative of their subtraction (Caballero et al., Reference Caballero, Goicoechea and Hernaiz1995; Assefa and Ledin, Reference Assefa and Ledin2001). Contrastingly to CP, NDF, ADF and Hem were higher in oat monocrops, lower in oat intercrops and much lower in common vetch monocrop. Regarding the mixtures, VPC was the quality determinant, with the B3-Peg intercrop to be the lowest-performing (low VPC), whereas the B2-Peg intercrop was the best (high VPC); similar results have been reported in previous studies (Caballero et al., Reference Caballero, Goicoechea and Hernaiz1995; Assefa and Ledin, Reference Assefa and Ledin2001). Nevertheless, Lithourgidis et al. (Reference Lithourgidis, Vasilakoglou, Dhima, Dordas and Yiakoulaki2006) reported that NDF followed the same trend with CP and attributed this to different cultivars and growth stages of vetch at harvest. In our study, the differences between intercrops and monocrops for NDF were large, in comparison to ADF or Hem, confirming previous studies on oat:vetch intercrops (Caballero et al., Reference Caballero, Goicoechea and Hernaiz1995; Lithourgidis et al., Reference Lithourgidis, Vasilakoglou, Dhima, Dordas and Yiakoulaki2006; Ramos et al., Reference Ramos, Altieri, Garcia and Robles2011). This could be ascribed to the fact that both ADF and Hem are fractions of NDF, and thus cultivar discrimination was better.
Lignin has been identified as a major factor that decreases digestibility, but fibre utilization is also limited by physical constraints at the cellular level (Buxton and Redfearn, Reference Buxton and Redfearn1997). Lignin content (ADL), digestibility and TDN followed a similar to CP trend since ADL was higher in vetch monocrop and oat : vetch intercrops compared to oat monocrops, being in agreement with previous studies (Caballero et al., Reference Caballero, Goicoechea and Hernaiz1995; Lithourgidis et al., Reference Lithourgidis, Vasilakoglou, Dhima, Dordas and Yiakoulaki2006; Ramos et al., Reference Ramos, Altieri, Garcia and Robles2011). Legumes are typically more digestible than grasses not because their fibres are more digestible but because they contain less fibres. In fact, legume fibres are more lignified and thus less digestible than that of grasses. Similarly, the major factor lowering the digestibility of forages as they mature is the higher fibre and lower cell-soluble concentrations of mature forages (Buxton and Redfearn, Reference Buxton and Redfearn1997; Carpita and McCann, Reference Carpita, McCann, Buchanan, Gruissem and Jones2000). Furthermore, digestibility has been inversely related to fodder fibre content; the lower the fibre, the higher the digestibility (Ramos et al., Reference Ramos, Altieri, Garcia and Robles2011). As it was expected, the B2-Peg intercrop was the most digestible, whereas the B3-Peg mixture showed the lowest digestibility. Moreover, oats supplemented with N were more digestible compared to their non-supplemented peers. However, oat cv. Flega was an exception since no difference in digestibility was detected, regardless the N regime. Forage digestibility could be improved by reducing the amount of lignified cells or by developing improved cultivars so that lignified cells are more digestible (Buxton and Redfearn, Reference Buxton and Redfearn1997). Finally, RFV, RFQ and NEL indicated that there were large differences within the intercrops. Thus, the B2-Peg intercrop had the highest RFV, RFQ and NEL values, while the B2nN showed the lowest.
To summarize, the differences between the intercrops for DM and CPY were attributed to differences in VPC. The intercrop with the highest VPC (B2-Peg) was among the highest-yielding in CPY, whereas the intercrop with the lowest VPC (B3-Peg) was among the highest-yielding in DM. The quality of intercrops was dependent on VPC with a high VPC to improve the quality of B2-Peg mixture, by achieving the highest CP, digestibility, TDN, RFV, RFQ and NEL. On the other hand, the B2-Peg intercrop had the lowest NDF, ADF and Hem.
Competition and economic indices
Higher production is always the main goal of any potential practice. However, the complementary and competitive aspects of the intercropped species make the comparison difficult. Plotting the partial LER values of common vetch against the LER values of oats grown with and without N supplementation in a bivariate diagram is a way to illustrate the pattern of competitive outcomes in intercrop experiments (Williams and McCarthy, Reference Williams and McCarthy2001; Bedoussac and Justes, Reference Bedoussac and Justes2010). The partial LER suggested that the oat genotype B3 showed complementarity with common vetch, whereas in the other mixtures, vetch dominated over oats following the order B2 > B4 > Flega (Fig. 3). LER was used as a criterion of the efficiency of intercropping for resources' partitioning compared with monocropping (Banik et al., Reference Banik, Sasmal, Ghosal and Bagchi2000; Ghosh, Reference Ghosh2004). However, there are limitations in the use of LER because the two cropping systems may require different inputs and the comparison of the two, under a specific input regime, may favour one over the other (Mead and Willey, Reference Mead and Willey1980; Fukai and Trenbath, Reference Fukai and Trenbath1993; Anil et al., Reference Anil, Park, Phipps and Miller1998). The aforementioned discussion was a motivation for testing monocropped oats with and without N since it is a common agronomic practice for farmers to grow intercrops without N in contrast to monocrops, which are usually N-supplemented. Nevertheless, our data revealed the same pattern for competitiveness and complementarity regardless of the N regime.
In most of the intercrops, total LER exceeded unit (Table 4), indicating that there was a distinctive yield advantage of intercrops over monocrops in terms of more efficient use of the resources for plant growth (Dhima et al., Reference Dhima, Lithourgidis, Vasilakoglou and Dordas2007; Sadeghpour et al., Reference Sadeghpour, Jahanzad, Lithourgidis, Hashemi, Esmaeili and Hosseini2014; Baxevanos et al., Reference Baxevanos, Tsialtas, Vlachostergios, Hadjigeorgiou, Dordas and Lithourgidis2017). Also, significant differences were observed in LERt among mixtures. Specifically, when LERt was standardized on OatsN, the B2-Peg and B3-Peg intercrops were the most efficient mixtures. However, when LER standardized on OatsnN, the B2-Peg intercrop was the most efficient mixture, possibly because the DM of B3nN treatment was much better in no-N treatment and its LER was lower.
Nevertheless, the LER was not proved to be the most efficient index and for this reason, a modification (LERmt) was developed. The LERmtN and the LERmtnN indicated that B2-Peg, B3-Peg and Fle-Peg mixtures were not different, whereas the RVImN and RVImnN separated identically the mixtures alike the respective RVIN and RVInN. Thus, the B2-Peg mixture was the most profitable (by 21%), when RVI was standardized on OatsN, whereas the B2-Peg and B3-Peg mixtures were the most profitable (by 12 and 13% respectively), when RVI was standardized on OatsnN. These results could be ascribed to the fact that the CP had a major impact on the intercrop value since the price for common vetch was considered at €250/t, while that for oats was set at €180/t. Moreover, the production cost of OatsN is higher due to N supplementation, which results in lower economic viability.
Correlation of agronomic traits with yield
Increased yields in some crops are the result of the indirect selection for plant architectural traits related to yield. However, different traits may be appropriate for cultivars intended for use in intercrops than those for monocrops (Nelson and Robichaux, Reference Nelson and Robichaux1997). Plant characteristics suitable for intercropping are those enhancing complementarity and consequently minimize interspecies competition (Davis and Woolley, Reference Davis and Woolley1993).
The DM in intercrops increased when oats flowered earlier, lodged less and the companion common vetch was shorter (Table 6), conditions which were evident in the intercrops of the oat genotype B3. This finding was pronounced by the lower VPC in B3 mixture. However, CPY was higher when oats flowered later and were shorter at the stages of HSE and maturity; in contrast, the common vetch was taller at these two stages. As a result, the B2-Peg mixture was a suitable combination for high CPY. Additionally, this intercrop showed high VPC in the mixture. The oat genotype B4 was low-yielding because of its sensitivity to lodging, whereas oat cv. Flega showed low lodging under both N regimes. Tolerance to lodging has been established as a highly important parameter of cereal productivity since it contributes to an improved standing ability of legume (Karpenstein-Machan and Stuelpnagel, Reference Karpenstein-Machan and Stuelpnagel2000).
Assefa and Ledin (Reference Assefa and Ledin2001) reported that vetch in monocrops was very similar to vetch in mixtures at the beginning of the growing period. However, vetch could not compete to oats because of their rapid growth rate. Consequently, the most compatible oat cultivars for intercropping with vetch were the shorter and later flowering ones. These features matched to the oat genotype B2, which was not competitive early in the season, as it was assumed by the short HSE, but it was shorter at maturity and later in flowering. Furthermore, the oat genotype B3, compared to B2, was fast-growing as indicated by the high HSE, showed earlier flowering and it was taller at maturity. High HSE of cereals early in the season, under Mediterranean conditions, is a favourable trait because it is associated with high biomass accumulation before anthesis and enhanced capacity of a cultivar to minimize translocation losses due to dry and hot weather (Papakosta and Gagianas, Reference Papakosta and Gagianas1991). Tuna and Orak (Reference Tuna and Orak2007) reported that decreasing vetch's seeding ratio in the mixtures resulted in decreased vetch FPH, while the opposite resulted in increased plant height in oats. These trends were in accordance with our findings since the B2-Peg mixture (high VPC) was significantly taller, whereas the B3-Peg mixture (low VPC) was significantly shorter. The reverse ranking was obtained for the oat line B2 in intercrop, which was the shortest, while the line B3 was ranked second regarding plant height.
In summary, the oat line B2 was the shortest, the latest flowering and less vigorous early in the season, a trait that allowed common vetch to dominate in the intercrop. On the other hand, the oat line B3 was the most vigorous early in the season, the earliest maturing and the tallest one, features contributed to its dominance in intercrop with common vetch.
Conclusions
Intercrops produced more DM (3.4%) than unfertilized oats in monocrops and less DM (5.0%) compared to N-fertilized oats. The respective percentages were + 75.5% and + 38.9% for CPY. The oat performance in unfertilized monocrops was a moderate predictor of the performance in intercrops and highlighted the need for selecting the most compatible oat cultivars for intercropping with vetch. The CPY and quality differences between the intercrops were attributed to differences of VPC in the mixture, since the intercrop with high VPC had high CPY, whereas the intercrop with the least VPC showed the highest DM. Also, VPC was the determinant of CP in mixtures. Thus, the B2-Peg mixture had the highest CP, whereas the B3-Peg showed the lowest. Fibre traits (NDF, ADF and Hem) followed an opposite to CP pattern, whereas ADL, digestibility TDN, RFV, RFQ and NEL showed a similar to CP trend. The oat B2 in intercrops was the shortest, the latest flowering and the less vigorous early in the season, traits that allowed common vetch to dominate in the intercrop (vetch participation 770 g/kg). On the other hand, the oat B3 was the most vigorous early in the season, the earliest maturing and the tallest, traits that resulted in common vetch suppression in the mixture (vetch participation 479 g/kg). The mixtures B2-Peg and B3-Peg were the most economically viable (by 12% and 13%, respectively) when compared to unfertilized oat monocrops. The B2-Peg mixture was the most economically viable (21%) and with the highest quality when the comparison was based on N-fertilized oat monocrops.
Acknowledgment
The authors acknowledge the excellent reviewers whose willingness and comments to improve the manuscript is greatly appreciated.
Financial support
This research received no specific grant from any funding agency, commercial or not-for-profit sectors.
Conflict of interest
None.
Ethical standards
Not applicable.


