


Introduction
Tea (Camellia sinensis (L.) O. Kuntze) is one of the world's leading cash crops and is second only to water in terms of amount drunk globally (Macfarlane & Macfarlane Reference Macfarlane and Macfarlane2004). Millions of livelihoods around the world depend on the production of tea. Black tea production in the world is projected to grow at 2.9% annually to reach 4.2 million tonnes by 2023 (Chang Reference Chang2015). Tea is produced in more than 35 countries ranging from Mediterranean climates to the hot-humid tropics. Indonesia, India, China, Sri Lanka and Kenya are the world's largest tea exporting countries (FAO 2015).
The Sri Lankan tea industry holds a unique position, successfully serving the tastes favoured by different markets. Over the years, this has been a key success factor of the country's tea industry branded as ‘Ceylon Tea’. The tea industry in Sri Lanka contributes 1.1% of the Gross Domestic Production while generating 11.2% of net foreign exchange earnings to the nation (Central Bank of Sri Lanka 2013). Tea is grown over 2 03 000 ha and the area is broadly divided into up-country (>900 m a.s.l.), mid-country (300–900 m a.s.l.) and low-country (<300 m a.s.l.), depending on the altitude of tea cultivation (Department of Agriculture 2003).
Principle abiotic factors that affect growth and productivity of tea are extreme temperatures and drought (Upadhyaya & Panda Reference Upadhyaya and Panda2004). Although the total annual rainfall in most of the tea-growing regions in Sri Lanka is sufficient for the production of tea, uneven rainfall distribution (i.e. variability) often limits annual tea yields (Wijeratne & Fordham Reference Wijeratne and Fordham1996a). Due to its perennial nature the tea crop encounters occasional drought, temperature and rainfall fluctuations (Upadhyaya & Panda Reference Upadhyaya and Panda2004). The components of tea yield include a number of shoots per unit area, mean weight of a shoot at plucking (i.e. harvesting) and time taken to reach a pluckable size (De Costa et al. Reference De Costa, Mohotti and Wijeratne2007). Yield components of tea are greatly affected by cultivar differences, environmental factors (e.g. temperature and moisture) and management practices (e.g. frequency of plucking and plucking standard). In order to explore growth and development potential of tea cultivars, and to evaluate the possibilities of adjusting management decisions under variable climatic conditions, it is vital to understand how crop processes are influenced by major environmental factors and management decisions. Therefore, prediction of tea yield that is achievable and of the distribution of tea yield throughout the year is important when managing tea plantations efficiently, e.g. planning labour requirements, supplying adequate transport facilities and achieving factory capacity to process harvested shoots cost effectively.
Mechanistic crop models are used frequently when estimating crop yields under variable climatic conditions (Hansen Reference Hansen2005). Several types of tea simulation models exist, with varying degrees of complexity, depending on their end use and application (Fordham Reference Fordham1970; Willat Reference Willat1971; Tanton Reference Tanton1981; Cloughley Reference Cloughley1983; Pachepskaya & Asatiani Reference Pachepskaya and Asatiani1986; Cannell et al. Reference Cannell1990; Anandacoomaraswamy & Campbell Reference Anandacoomaraswamy and Campbell1993; Smith et al. Reference Smith1993). Though these models provide useful information, they are not applicable to a wide range of environments. The comprehensive process-based simulation model developed by Matthews & Stephens (Reference Matthews and Stephens1998a, Reference Matthews and Stephensb) can be used to describe the dynamics of a population of tea shoots in response to temperature, humidity and daylength. This model can be used to estimate the potential and seasonal distribution of tea yield describing dry matter (DM) production and partitioning under optimal environmental conditions. The model has been applied to conditions in Tanzania, Zimbabwe and North-east India (Matthews & Stephens Reference Matthews and Stephens1998a,Reference Matthews and Stephensb; Panda et al. Reference Panda, Stephens and Matthews2003). However, many parameters in this model are difficult to measure on a routine basis, making validation for new locations difficult. None of the previous modelling approaches focused on Sri Lankan tea cultivars, except the model developed by Anandacoomaraswamy & Campbell (Reference Anandacoomaraswamy and Campbell1993). In this latter model, yield was calculated as a constant fraction of DM production. Moreover, the influence of temperature on shoot growth was not considered or validated. Therefore, it is unlikely that the above models can simulate yield across the range of altitudes encountered in the tea-growing regions of Sri Lanka, or the peaks and troughs of production in areas with a marked seasonal pattern.
Knowledge on the response of shoot development and growth of Sri Lankan tea cultivars to environmental changes is limited, and their performance under diverse environmental conditions in major tea growing regions in Sri Lanka have not been predicted. In particular, detailed analysis of shoot growth and shoot replacement cycles over time in relation to moisture and temperature stresses has not been conducted. Therefore, estimation of shoot growth and tea yields through simulation modelling under diverse agro-climatic conditions in Sri Lanka has not been achieved. Despite these limitations, quantifying the effect of environmental variables on development and growth of tea shoots is important. To develop simulation models which enable prediction of tea yields precisely requires quantifying the effect of environmental variables on development and growth of tea shoots. Therefore, the overall objective of the current study was to develop a model to simulate shoot replacement cycle, growth and yield of tea under both optimal, and extremes of temperature and moisture. The specific objectives of the current study were to (1) derive appropriate functions to explain the rate of leaf initiation, leaf expansion, shoot development, DM production and DM partitioning; (2) develop cultivar-specific leaf development and growth relations under temperature and water stresses; and (3) validate the model predictions against independent datasets collected from different tea-growing regions in Sri Lanka; Up-Country Wet Zone (UW), Up-Country Intermediate Zone (UI), Mid-Country Intermediate Zone (MI) and Low-Country Wet Zone (LW) (Table 1).
Table 1. Long-term meteorological observations of the study regions

Material and methods
Data sources
The model uses daily weather data for simulation. Daily minimum and maximum temperatures (T min and T max, respectively, °C), solar radiation (MJ/day), rainfall and class A pan evaporation (E) (mm/day) were obtained from the Meteorological Department sub-stations located at the study regions (Table 1). Crop and soil data for model development were obtained from field experiments conducted at the Glen Alpine Estate – Badulla (UI), a farmer's field at Hali-Ela (MI) (Tables 1 and 2) and from published reports (Table 2). Crop and soil data for model validation were obtained from the Glen Alpine Estate – Badulla (UI), a farmer's field at Hali-Ela (MI), field No. 2 of St. Joachim Estate, Tea Research Institute, Ratnapura (LW), St. Coombs Estate, Talawakelle (UW) and Uva Extension Centre, Tea Research Institute, Passara (MI) (Table 3) (Wijeratne et al. Reference Wijeratne2007, Reference Wijeratne2013). Moreover, datasets used for model validation (Table 3) were independent from the data used for model parameterization (Table 2), though some experiments were used for both purposes.
Table 2. Summary of field experiments conducted for model calibration/parameterization

Table 3. Summary of field experiments conducted for the validation of the tea model

Note: datasets used for model validation were independent from the datasets used for parameterization (Table 2) though some experiments used were in common.
Growth of a tea shoot
The growth of a tea shoot has a natural cyclic pattern including alternating active and dormant phases (Eden Reference Eden1965; Ellis & Grice Reference Ellis and Grice1976; Wijeratne Reference Wijeratne2001). Harvesting of tea shoots (i.e. plucking) removes apical dominance (Fig. 1). Then one or two axillary buds below the point of plucking start to regenerate as new shoots. The first leaf appendages to unfurl are the two outer covers of the bud referred as ‘scale leaves’ and they have a very short lifespan (Fig. 1). The next leaf appendage to initiate and expand is the ‘fish leaf’, which is an oval-shaped, blunt leaf without apparent serration and veins (Fig. 1). After the fish leaf, normal flush leaves appear and those successive leaves are called 1st, 2nd and 3rd normal leaves (Fig. 1).
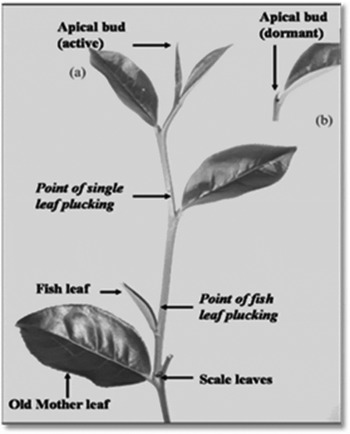
Fig. 1. Typical (a) active (b) dormant shoots of tea (Source: Wijeratne Reference Wijeratne2001).
Overview of the model
The model was developed to estimate the shoot replacement cycles over time, DM production and partitioning, and shoot yield of widely grown tea cultivar TRI 2025. This is a dynamic model as it predicts the growth of a tea shoot with time on a daily time step, and deterministic as the model predictions are not associated with any probability distribution. The model was developed and run in R software version 2.51 (R Core Team 2013). The model consists of different sub-modules, weather, crop and soil that interact with each other as outlined in Fig. 2.

Fig. 2. Schematic overview of the data flow in the shoot growth model of tea.
A high-level overview of the crop model is as follows (see also Fig. 2). The model updates daily and cumulative thermal time (TT – measured in Celsius degree days from the natural senescence of scale leaves) is calculated using inputs from the weather module. Leaf area index (LAI) characterizing a typical shoot is modelled as a function of TT based on empirical relationships (Table 4) determined from the data in Table 2. Along with LAI, standard assumptions relating to light interception and radiation-use efficiency are used to calculate daily DM accumulation derived from both photosynthesis in the growing shoot (DMS, g/m2) and DM partitioned from the maintenance canopy (DMP, g/m2). The number of harvestable shoots/m2 on the plucking table was derived using data collected from field experiments (Table 2). Two further empirical relationships derived from data shown in Table 2 are: (i) conversion of total DM accumulated in a shoot to fresh weight (FW) and (ii) identification of the thresholds in TT that mark initiation of the different stages of shoots development after the senescence of scale leaves (Table 4). The empirical relationships allow model outputs to be compared with measurements of FW, in-field assessment of the development stage of the crop and measured LAI. Finally, the model also calculates temperature and water stress indices that each range from complete stress (index = 0) to no stress (index = 1), and in the model multiply FW and hence describe the impact of these stresses in terms of a reduction in FW. Details of the model development are described in the next section.
Table 4. Relationships between the estimated leaf area of a tea shoot (LAS) and cumulative thermal time from the senescence of scale leaves (TT) for different shoot development stages of TRI 2025

Model development and underpinning experimental results
Three field experiments were conducted to derive parameters required for the development of a shoot growth model for TRI 2025. Experimental details are summarized in Table 2. The first experiment was conducted to develop equations to predict the area of an individual leaf (LA) and leaf area of a shoot (LAS) using leaf length (L) and width (W), cumulative TT since the senescence of scale leaves (Table 4, Fig. 2) and number of days (D) since the senescence of scale leaves (Table 5). As the first step, non-destructive measurements of L, W and LA were obtained from the fish leaf, and first, second and third normal leaves in a tea shoot at different developmental stages. The LA was measured using the grid count method (Caldas et al. Reference Caldas1992) while L and W were measured using a ruler. The relationship between LA and the variables L, W, L 2, W 2 and the products LW and L2W were examined as suggested by Zenginbal et al. (Reference Zenginbal2006). The best model to explain LA was determined through a stepwise regression in SAS, based on the R 2 values. Results showed that the variation of LA could be explained by the product of length and width (L × W) satisfactorily. The selected model to predict the LA of TRI 2025 was LA = 0.714 × L × W (R 2 = 0.98).
Table 5. Relationships between the estimated leaf area of a tea shoot (LAS) and the number of days from the senescence of scale leaves (D) for different shoot development stages of TRI 2025

Next, number of days (D) and TT required to produce successive leaves in a shoot, and LAS were measured, from the natural senescence of scale leaves until a shoot with three fully expanded normal flush leaves and a bud was produced (i.e. harvestable tea shoot with an average shoot length of 120 mm). Ten shoots were tagged immediately after plucking and the number of days required to initiate fish leaf, first, second and third normal leaves on a tea shoot were measured (Table 2). Moreover, L and W of individual leaves on those tea shoots were also measured daily. Daily minimum and maximum temperatures were recorded for the study period. The L and W values measured were used to estimate the LA of different leaves on a tea shoot at the end of each day using the equation derived above. When estimating the leaf area of a tea shoot containing several leaves (i.e. LAS) the estimated leaf area of individual leaves on a tea shoot were added. The relationships between estimated LAS and the number of days from the senescence of scale leaves for different shoot development stages at Badulla are shown in Fig. 3.

Fig. 3. Estimated leaf area of a growing tea shoot (LAS) (symbols; mean ± s.e.), and best-fitted relationships between the LAS and the number of days from the senescence of scale leaves (lines) at different shoot developmental stages for TRI 2025. Note: equations for different shoot development stages are given in Table 3, and scales in the X and Y axes are different. Mean ± s.e., n = 10.
After the scale leaves had senesced naturally, 4 days were required to initiate the fish leaf, and 11, 16 and 23 days to initiate the first, second and third normal leaves, respectively (Fig. 3, Table 5). After initiation of the third normal leaf, an additional 20–23 days were required to reach the harvestable stage (Fig. 3, Table 5). The harvestable stage of a tea shoot was determined in the present model when a shoot reached a leaf area of 25–30 cm2 or a corresponding shoot length of 10–12 cm. Derived relationships between the estimated LAS and numbers of days from the senescence of scale leaves through regression analysis are given in Table 5.
The weather module calculates TT for use in the developmental processes of TRI 2025 using daily weather data (i.e. daily T max and daily T min) and three cardinal temperatures (Fig. 2). Cardinal temperatures considered were 12.5 °C as the base temperature (T base) (Carr & Stephens Reference Carr, Stephens, Willson and Clifford1992; Ekanayake et al. Reference Ekanayake, Sangakkara and Mapa1992; Wijeratne Reference Wijeratne1994), 22 °C as the optimal temperature (T opt) (Wijeratne Reference Wijeratne1996) and 40 °C as the ceiling temperature (T ce) (Carr Reference Carr1972). Accumulation of TT over the growing period was calculated as explained by Robertson et al. (Reference Robertson2002). Calculated TT in the weather module is an input to the crop module to estimate LA and LAS (cm2) (Fig. 2).
After the scale leaves had senesced naturally, 128.5 °C days were required to initiate the fish leaf (Table 4). Similarly, 187.5, 234.5, 295.5 °C days were required to initiate the first normal leaf, second normal leaf and third normal leaf, respectively. From the initiation of the third normal leaf, an additional 97 °C days were required to attain the harvestable stage (i.e. 392.5 °C days) (Table 4). For each stage of development, the derived relationships between the estimated LAS and TT from the senescence of scale leaves through regression analysis are given in Table 4. Then, leaf area index (LAI) of a shoot was estimated using the following equation.
 $${\rm LAI}\;{\rm of}\;{\rm a}\;{\rm shoot} = \displaystyle{{{\rm LAS(c}{\rm m}^{\rm 2}{\rm )}} \over {{\rm 10}\,{\rm 000}\;{\rm c}{\rm m}^{\rm 2}}}$$
The LAI was subsequently used to calculate DM produced from a growing tea shoot through its own photosynthesis (DMS, g/m2). Then the proportion of DM added (DMP, g/m2) to a growing shoot from the maintenance canopy (MC), based on shoot developmental stage, was calculated (Fig. 2). The model calculates potential daily DMS using light extinction coefficient (k), radiation-use efficiency (RUE) and LAI. Radiation-use efficiency and light extinction coefficient values used are 0.34 g/MJ and 0.6, respectively for cultivar TRI 2025 (Anandacoomaraswamy & Campbell Reference Anandacoomaraswamy and Campbell1993). The daily proportional conversion of total solar radiation (S) to photosynthetically active radiation (PAR) was considered to be 0.5 (Monteith & Unsworth Reference Monteith and Unsworth1990; Campbell & Norman Reference Campbell and Norman1998). The fraction of incoming PAR intercepted by a growing tea shoot was calculated as explained by Monsi & Saeki (Reference Monsi and Saeki2005) using the extinction coefficient (k) and leaf area index (LAI). Once the amount of intercepted radiation was estimated, RUE was used to calculate the amount of daily DM production by a growing shoot (DMS) as follows:
 $${\rm DMS} = 0{\cdot}5 \times S \times {\rm RUE}(1 - e^{ - k \times {\rm LAI}})$$
where DMS is dry matter production from the growing tea shoot (g/m2), S is daily radiation (MJ/m2/day), and RUE is radiation-use efficiency (g/MJ).
In a growing shoot, DM accumulation occurs through local photosynthesis in the shoot (DMS) and DM mobilized from other parts of the plant (DMP), referred to as the maintenance canopy. The ratio of these two sources changes as the shoot develops. Here, the amount of DM mobilized from the maintenance canopy (DMP) was estimated as explained by Manivel & Hussain (Reference Manivel and Hussain1982), i.e. sink capacity of a tea shoot with a bud, bud with one normal leaf, bud with two normal leaves and bud with three normal leaves declines in the order of 100, 70, 40 and 30% of daily DM accumulated in a tea shoot, respectively. Therefore, the percentage of DM produced by a growing shoot through its own photosynthesis (DMS) was considered to be 0, 30, 60 and 70% of the daily DM accumulated in a growing shoot in each of the development stages, respectively. Considering these values, a smooth relationship between the percentage DM produced by a growing shoot through its own photosynthesis with TT was developed, i.e. %DM produced by a growing shoot = 0.192 × TT − 3.01. Based on this relationship the amount of DM partitioned to a growing shoot from the maintenance canopy (DMP) was calculated as follows:
 $${\rm DMP} = \displaystyle{{{\rm DMS}} \over {{\rm PCDM}}}{\rm \times PCMC}$$
where DMS is the amount of dry matter produced by a growing shoot through its own photosynthesis, PCDM is the % contribution from growing shoot to DM accumulated and PCMC is the % contribution from MC to DM accumulated.
Total DM accumulated in a growing tea shoot at the end of each day was computed as the summation of DM produced from the growing shoot through its own photosynthesis and DM partitioned from the maintenance canopy of that day, i.e. DMS + DMP (Figs 2 & 4).

Fig. 4. Simulated dry matter (DM) production through own photosynthesis of a tea shoot with three leaves and bud (DM3), two leaves and bud (DM2), one leaf and bud (DM1) and fish leaf and bud (DMf) (a), and simulated DM partitioned from the maintenance canopy (MC) to the same shoot at the different development stages described for DM production (b) with time from the senescence of scale leaf (days) for TRI 2025 grown in optimal environmental and management conditions where moisture, nutrient and temperature stresses were assumed to be zero.
Moisture content of a fresh tea shoot can vary in the range 70–83% (wet basis) depending on the climatic conditions, weather pattern and tea cultivar (Samaraweera Reference Samaraweera, Sivapalan, Kulasegaram and Kathiravetpillai1986). Ten shoot samples with three leaves and bud were collected randomly from the experimental site at Hali-Ela and taken immediately to the Biology Laboratory at Uva Wellassa University, Badulla, Sri Lanka in sealed polythene bags to record shoot FW. Samples were then oven-dried to constant weight at 80°C to measure the dry weight of each shoot sample. The mean moisture percentage of a tea shoot measured in the current study was 80% and was used to calculate the FW of a simulated tea shoot consisting of three leaves and a bud (Table 2).
Fresh weight of harvestable tea shoots (i.e. shoots with three leaves and bud) of an area of 1 m2 on the plucking table under optimum environmental conditions (i.e. in the absence of moisture, nutrients and temperature stresses) was estimated for the experiment conducted at a tea smallholder's field at Hali-Ela (Table 2). There was a significant difference in the mean number of shoots/m2 on the plucking table at different developmental stages with time (i.e. the month of the year) (Fig. 5). The highest number of harvestable shoots was recorded from May–July (21 ± 3.1) while the lowest number was recorded in January–February (10 ± 3.1). A sixth order polynomial function explained the temporal variation in the number of harvestable shoots/m2 on the plucking table (R 2 = 0.94, Fig. 5). The estimated FW of a tea shoot in the previous step was then multiplied with the estimated mean number of shoots with three leaves and bud to calculate the FW of harvestable shoots per m2 on the plucking table at Hali-Ela (g/m2) (Fig. 2). A similar approach was used when estimating the FW of shoots in other developmental stages. Simulated FW of shoots in different developmental stages with time is shown in Fig. 6a.

Fig. 5. Variation in the observed number of shoots (shoots/m2) at different developmental stages (i.e. buds, bud and fish leaf, bud and one, two or three normal leaves) with time at the smallholder's field – Hali-Ela during the study period (mean ± s.e., n = 10), dotted line (i.e. poly bud + 3NL) and the equation indicate the polynomial function fitted to explain the variation in number of shoots with three leaves and a bud with time.

Fig. 6. Simulated fresh weight of shoots in different developmental stages (three leaves and bud (TFW3), two leaves and bud (TFW2), one leaf and bud (TWF1) and fish leaf and bud (TFWf)) on 1 m2 of plucking table for TRI 2025 when moisture and temperature stress assumed to be zero (a) and when considering moisture and temperature stresses (b) for TRI 2025 at Hali-Ela from 10 Dec to 22 Jan 2013.
Model simulation under temperature and soil moisture stresses
The weather module calculates temperature stress index (TEMSTRESS) (Fig. 2). If the daily mean temperature (T mean) is below a lower threshold (T lower) or exceeds an upper threshold (T upper) then the model considers the plant has experienced either cold or heat stress, respectively. The lower and upper-temperature thresholds for Sri Lankan tea cultivars are 18 and 29 °C, respectively (Carr Reference Carr1972; Panda Reference Panda2011). Accordingly, the temperature stress index was calculated as:
 $${\rm CTEMPSTRESS} = \displaystyle{{(T_{{\rm mean}} - T_{{\rm base}})} \over {(T{\rm lower} - T{\rm base})}}\;{\rm for}\;T_{{\rm mean}} \le T_{{\rm lower}}\;{\rm and}$$
 $${\rm HTEMPSTRESS} = \displaystyle{{(T_{{\rm ce}} - T_{{\rm mean}})} \over {(T{\rm ce} - T_{{\rm upper}})}}\; {\rm for} T_{{\rm mean}} \ge T_{{\rm upper}}$$
where CTEMPSTRESS is the cold stress index and HTEMPSTRES is the heat stress index. Indices can vary from 0 to 1, where 0 indicates complete stress and 1 indicates zero stress.
The soil water sub-module was developed to compute the daily soil water balance accounting for major inputs and outputs of soil water (Fig. 2). Class A pan evaporation (E) was used with crop coefficient (K c) of 0.85 (Laycock Reference Laycock1964) to calculate the evapotranspiration from tea (teaET) as follows:
 $${\rm teaET}_{(n)} = K_{\rm c} \times E$$
The model estimates the soil moisture content (SMC) as
 $${\rm SM}{\rm C}_{{\rm (}n{\rm )}}{\rm = SM}{\rm C}_{{\rm (}n{\rm - 1)}}{\rm + rainfal}{\rm l}_{{\rm (}n{\rm )}} - {\rm teaE}{\rm T}_{{\rm (}n{\rm )}}$$
where the subscripts (n) and (n − 1) refer to the measurements taken at the end of nth and previous (n − 1) days.
Irrigation is not commonly practiced in tea lands of Sri Lanka; therefore, irrigation was not considered as an input. Runoff (R) was assumed to be zero as drains retain the water in the system. Rooting depth was considered to be 1 m as over 90% of the roots in a mature tea bush are located up to 1 m from the soil surface (Anandacoomaraswamy et al. Reference Anandacoomaraswamy2000). Field capacity (FC), moisture content (v/v) at which water stress begins to develop for tea (SMCstress) and permanent wilting point (PWP) for the tested soils were obtained from the literature (Table 6). Water stress coefficient at the end of the nth day (Ks(n)) was calculated using the following equations:
 $${\rm K}{\rm s}_{{\rm (}n{\rm )}}{\rm = 1 if SM}{\rm C}_{{\rm (}n{\rm )}} \ge {\rm SM}{\rm C}_{{\rm stress}}$$
 $${\rm K}{\rm s}_{{\rm (}n{\rm )}}{\rm = (SM}{\rm C}_{{\rm (}n{\rm )}}{\rm -} {\rm PWP)/(SM}{\rm C}_{{\rm stress}}{\rm -} {\rm PWP),}\;{\rm otherwise}$$
Table 6. Critical soil moisture levels (% – v/v) at the study sites

The Ks can vary from 0 to 1, where 0 indicates full moisture stress while 1 indicates the absence of moisture stress. The equation was adjusted with representative values of FC, PWP and SMC for tested locations (Table 6). A similar simplified approach was used when estimating the soil water balance for different plant species in other crop models (Jones & Kiniry Reference Jones and Kiniry1986; Suriyagoda et al. Reference Suriyagoda2010).
Cold and heat stress indices predicted by the model for three tested locations are given in Fig. 7. Tea plants at Hali-Ela experienced cold stress on one day only, i.e. CTEMPSTRESS of 0.86 observed on 25 December 2013 when the mean air temperature (17.75 °C) was lower than the lower threshold of 18 °C. Tea plants at Ratnapura and Talawakelle experienced frequent heat and cold stresses, respectively (Fig. 7). Water stress coefficient, Ks, at Hali-Ela varied from 0.98 to 1 (Fig. 7). Tea plants at Ratnapura experienced water stress in February (Ks = 0.8) and August (Ks = 0.88). Tea plants at Talawakelle did not experience water stress during the study period (Fig. 7).

Fig. 7. Variation in (a) simulated temperature stress index (CTEMPSTRESS, cold temperature stress; HTEMPSTRESS, heat temperature stress) and (b) observed rainfall (RAIN), estimated transpiration (teaET, mm/day) and simulated water stress coefficient (Ks) for TRI 2025 at Hali-Ela, Ratnapura and Talawakelle during the study period in 2013. Note the difference in Y-axis scales in the upper panel.
Simulated FW of a tea shoot at optimal moisture and temperature conditions was multiplied by soil moisture and temperature stress indices to simulate the weight of a tea shoot under actual field conditions. The model simulated tea shoot growth of one shoot replacement cycle at Hali-Ela, after incorporating stress indices, is illustrated in Fig. 6b.
Model validation
The model was validated using six independent datasets obtained from Badulla, Hali-Ela, Ratnapura, Talawakelle and Passara representing low-, mid- and up-country tea cultivating regions in the country (Tables 1 and 3). Variables used for model validation were LAS, number of harvestable tea shoots (three leaves with a bud) on 1 m2 plucking table, shoot FW and SMC. Primary data collected from the first experiment conducted at Glen Alpine Estate, Badulla and the third experiment conducted at Hali-Ela, and secondary data recorded from the experiments conducted at St. Joachim Estate, Tea Research Institute, Ratnapura, St. Coombs Estate, Tea Research Institute, Talawakelle and Uva Extension Centre, Tea Research Institute, Passara were used for model validation (Wijeratne & Fordham Reference Wijeratne and Fordham1996a, Reference Wijeratne and Fordhamb; Wijeratne et al. Reference Wijeratne2007, Reference Wijeratne2013; Prasadinie et al. Reference Prasadinie, Jayasinghe and Wijeratne2015) (Table 3).
Measures of model performance
In order to assess the model's performance and provide an objective evaluation of the ‘closeness’ of simulated and measured values, indicators such as coefficient of determination (R 2) and paired t-test were used. The model reproduces experimental data best when R 2 is close to 1 and P value for the t-test is >0.05 (indicating that observed and simulated data are not significantly different). The root-mean-square error (RMSE – mean differences between the values predicted by the model and values observed), and Nash-Sutcliffe error (NSE) (Nash & Sutcliffe Reference Nash and Sutcliffe1970) were also used to measure the model efficiency. If the error is zero, then NSE = 1, and the model represents a perfect fit. If the error and observed variances are equal, then NSE = 0, indicating that the model predictions are as accurate as the mean of the observed data. A negative NSE indicates the error about the model is greater than the error about the mean (i.e. weak model fitting).
Results
Model simulated shoot growth pattern
Simulated number of days (D) required to reach different leaf developmental stages, including the production of a harvestable tea shoot, increased from Hali-Ela (MI), Ratnapura (LW), to Talawakelle (UW) (Table 7). The mean number of days required to produce a harvestable shoot at Hali-Ela, Ratnapura and Talawakelle was 44, 51 and 65, respectively (Table 7). However, the simulated TT requirement for a shoot replacement cycle was similar across locations with an average of 397.6 °C days (Table 7). Moreover, the simulated TT required to produce shoots with one, two and three leaves and a bud were also similar across different locations (Table 7).
Table 7. Simulated number of days (D) and thermal time (TT) required to initiate successive leaves in a tea shoot at different locations
Model validation
The measured LAS at different developmental stages from Hali-Ela were correlated closely with the simulated values (Table 8). The R 2 for LAS at different shoot developmental stages were high (R 2>0.98), and therefore significant differences between the measured and simulated LAS were not observed for t-tests (Table 8). The NSE efficiency measure for LAS ranged from 0.94 to 0.99, and the RMSE from 0.44 to 1.81 cm2 when mean values were 1.6 and 31.9 cm2, respectively, indicating the ability of the model to make precise LAS predictions at Hali-Ela.
Table 8. The measured and simulated leaf area of a shoot of TRI 2025 (LAS – cm2) and the model fit statistics at different shoot developmental stages at Hali-Ela and Ratnapura, n = 10 and 6, respectively

Similar to the LAS measured at Hali-Ela in the current study, the secondary data collected from Prasadinie et al. (Reference Prasadinie, Jayasinghe and Wijeratne2015) for Ratnapura also showed close agreement with the model-predicted LAS, i.e. R 2 for different shoot developmental stages were high (R 2 >0.92), and therefore significant differences between the measured and simulated LAS were not observed for t-tests (Table 8). The NSE efficiency measure ranged from 0.84 to 0.99 and the RMSE from 0.2 to 0.75 cm2 when the mean values were 1.4 and 31.5 cm2, respectively indicating the capacity of the model to make precise LAS predictions at Ratnapura (Table 8).
Secondary data obtained from Wijeratne & Fordham (Reference Wijeratne and Fordham1996a, Reference Wijeratne and Fordhamb) on the number of harvestable tea shoots (shoots having three leaves with bud) per m2 were used to validate the model (Fig. 8). The model showed a medium level of strength when simulating the number of harvestable tea shoots at Ratnapura, i.e. the model had limitations when simulating the number of harvestable tea shoots in peak months, as the observed variability in the field was higher than that simulated by the model (Fig. 8). This may be due to the occurrence of shoot dormancy, changes in soil nutrient availability, and pest and disease conditions, and/or unavoidable variability in the plucking process among pluckers. For this reason, the model fit statistics for the number of harvestable tea shoots was average. The R 2 was weak (0.08) and the NSE was close to zero (0.061). This indicates that the model predictions are aligned with the mean of measured data and lacked the power to explain the observed variability. Moreover, the RMSE was 10.3 shoots/m2 when the mean value was 16 shoots/m2 indicating the higher variability between the observed and simulated values. However, the P value for the t-test remained at 0.188, indicating that the model predictions were not significantly different from the measured number of harvestable tea shoots at P = 0.05, despite the observed differences in certain months. Therefore, P-value alone is not adequate to test the model accuracy.

Fig. 8. Variation in the measured (symbols; mean ± s.e.) and simulated (line) number of harvestable tea shoots (i.e. shoots with three leaves and bud) from October 1992 to September 1993 at Ratnapura, means ± s.e., n = 24.
Fresh weight values obtained from shoots at different developmental stages at Hali-Ela for six consecutive plucking rounds were used to validate the model (Table 3). Measured FW at different shoot developmental stages can be simulated by the model, i.e. R 2 ranged between 0.98 and 0.99, and the t-test results comparing measured and simulated values showed no significant difference (Table 9, Fig. 9). The NSE efficiency measure for FW ranged from 0.93 to 0.98, and RMSE from 0.0014 to 1.77 g/m2 when mean values were 1.0 and 15.94 g/m2, respectively indicating the capability of the model to explain the mean and variability of the observed FW of tea shoots at different developmental stages.

Fig. 9. Variation in the measured (symbols; i.e. mean ± s.e.) and simulated (lines) shoot fresh weight for different shoot developmental stages of TRI 2025 at the smallholder tea farmer's field at Hali-Ela from 22 May to 26 June 2014 (n = 6), Note: the differences in Y-axis scales.
Table 9. The measured and simulated fresh weight of TRI 2025 shoots (FW – g/m2), and the model fit statistics for different shoot developmental stages at Hali-Ela, n = 6

Apart from the prediction of shoot FW at different developmental stages at Hali-Ela (Fig. 9), FW of harvestable tea shoots measured at Hali-Ela for a 1-year period was used to validate the model. Moreover, secondary data obtained from Ratnapura and Talawakelle for a 1-year period were also used to validate the model for shoot FW (Table 3, Fig. 10) (Wijeratne et al. Reference Wijeratne2007; Reference Wijeratne2013). The model could predict the fluctuations in tea yield except in few instances (overestimation in November and December and underestimation in August) at Hali-Ela.

Fig. 10. Variation in the measured (symbols; mean ± s.e.) and simulated (lines) harvestable tea shoot yield (g/m2) with time at Hali-Ela (2013 & 2014), Ratnapura (2006) and Talawakelle (2012) (mean ± s.e., n = 12 for measured values). Model fit statistics are also given.
The relationship between simulated and measured green leaf yields for a 1-year period at Hali-Ela had an acceptable strength, i.e. R 2 was 0.72, and the t-test statistics indicated the similarity between simulated and measured shoot yields. Moreover, NSE was 0.07 and RMSE was low (5.2 g/m2 when the mean value was 70 g/m2), indicating a satisfactory level of predictability of green leaf yields at Hali-Ela (Fig. 10). The model could explain major trends in measured tea shoot yields at Ratnapura and Talawakelle, i.e. R 2 were 0.78 and 0.58, respectively, and the t-test statistics indicated the similarity between simulated and measured shoot yields at both locations. Moreover, NSE were 0.1 and 0.46, and the RMSE were 8.9 and 17.2 g/m2 when mean values were 46.9 and 67.8 g/m2, respectively for Ratnapura and Talawakelle, indicating the satisfactory predictability of the green leaf yields at both locations (Fig. 10).
The model was also validated for SMC (%) (V/V) at the Uva Extension Centre, Tea Research Institute, Passara for 1 year (Table 3). Data required for model validation were obtained from Damayanthi et al. (Reference Damayanthi, Mohotti and Nissanka2010) (Table 3). There was an acceptable agreement between the measured and simulated SMC, i.e. R 2 was 0.69 and the t-test had P > 0.05 (Fig. 11). Moreover, the NSE was 0.61 and RMSE was 1.5% when the mean value was 23.01%, indicating the capacity of the soil–water sub-model to predict the variation of SMC in different months at Passara.
Fig. 11. Variation in the measured (symbols; mean ± s.e.) and simulated (line) soil moisture content (SMC) in the top 20 cm soil profile at the Uva Extension Centre, Passara, 2008, n = 23.
Discussion
Assimilate partitioning and cyclic growth of tea shoots under Sri Lankan climatic conditions have not been modelled despite some attempts made to estimate the phenological parameters and shoot growth under localized environmental conditions (Fordham Reference Fordham1970; Tanton Reference Tanton1981; Cloughley Reference Cloughley1983; Pachepskaya & Asatiani Reference Pachepskaya and Asatiani1986; Carr et al. Reference Carr, Dale and Stephens1987; Smith et al. Reference Smith1993; Anandacoomaraswamy & Campbell Reference Anandacoomaraswamy and Campbell1993). Therefore, the current model attempted to simulate DM production/partitioning, and shoot yield, of a widely cultivated Sri Lankan tea cultivar TRI 2025 under a range of climatic conditions.
Thermal time and its relationship with leaf initiation and shoot replacement cycle
Thermal time requirements were identified for the initiation of new leaves in a growing tea shoot and until a tea shoot reaches the harvestable stage. Tea cultivar TRI 2025 required 390–400 °C days to develop a harvestable tea shoot in the present study. However, a broad range of TT requirement was reported in previous studies, i.e. 330–370 °C days in high elevations with a mean temperature of 19 °C and 500–600 °C days in low elevations with a mean temperature of 26 °C considering the base temperature as 12.5 °C (Ekanayake et al. Reference Ekanayake, Sangakkara and Mapa1992; Wijeratne Reference Wijeratne1994). Moreover, according to Carr & Stephens (Reference Carr, Stephens, Willson and Clifford1992), TT requirement from bud break to reach a harvestable tea shoot (150 mm) was 491 °C days in Southern Malawi; a value higher than that observed in the present study. Observed differences in TT requirements across studies may be at least partly due to differences in shoot lengths considered at the time of harvest and cultivar differences. Moreover, TT required to develop a tea shoot with a fish leaf, one, two or three normal leaves in the present study were 129, 188, 235 and 296 °C days, respectively, and these values were consistent across different climatic conditions studied here. Therefore, as observed in this study and reported previously across different countries and tea cultivars, TT can be used to predict the developmental stage of a tea leaf and shoot. This concept is important to tea growers as it can be used to decide important harvesting policies such as plucking rounds for different periods of the year and locations based on the temperature variation.
Shoot growth models of tea have used a base temperature in the range of 7–15 °C depending on the cultivar and country (Hadfield Reference Hadfield1968; Kandiah & Thevadasan Reference Kandiah and Thevadasan1980; Hoshina et al. Reference Hoshina1983; Obaga et al. Reference Obaga, Squire and Langat1988; Smith et al. Reference Smith1993). Reports from other countries state that the optimum temperature for shoot growth of tea is in the range of 20–30 °C (Carr Reference Carr1972; Squire Reference Squire1979; Tanton Reference Tanton1982; Rahman Reference Rahman1988; Carr & Stephens Reference Carr, Stephens, Willson and Clifford1992; Smith et al. Reference Smith1993) and this value for Sri Lankan tea cultivars is 22 °C (Wijeratne Reference Wijeratne1996; Amarathunga et al. Reference Amarathunga, Jayaratne and Wijeratne1999). Ceiling temperature for shoot growth has not usually been considered in TT models (Wijeratne & Fordham Reference Wijeratne and Fordham1996a) due to the lack of information available, as most of the studies were conducted in environments with mean daily temperature less than the optimum for tea. Although cultivar-specific cardinal temperatures (i.e. T base, T opt and T ce) need to be investigated, the present results indicate that there is consistency in TT requirements calculated for different tea shoot developmental stages across a range of climatic conditions. Daily mean temperature in the Mid-Country Intermediate Zone (i.e. Hali-Ela) was closer to the optimal range for tea growth. Therefore, tea grown in this region required fewer days to produce a harvestable tea shoot (i.e. shorter shoot replacement cycle) than that observed in other climatic regions, despite the TT requirement across locations being similar. Therefore, TT shows promise when predicting shoot replacement cycles for different climatic regions, thereby allowing researchers and estate managers to make agronomic and management decisions.
Thermal time and its relationship with leaf area of a tea shoot
A basic prerequisite for any simulation model aimed at predicting the growth of a tea shoot is the ability to estimate leaf area accurately (Smith et al. Reference Smith, Harvey and Cannell1998). As observed at the validation stage the current model could predict the leaf area of a growing tea shoot very closely to that of measured values at different climatic conditions. This indicates that the model has the capacity to explain the observed variability of LA and SLA accurately. Therefore, relationships developed in the current study can be used when predicting the LAS under tested climatic conditions for TRI 2025. Moreover, this can also be used as a base when comparing the relationships between LAS and TT across cultivars, locations and climatic conditions, including temperature and moisture stresses.
Shoot density of tea
Variation in the mean number of harvestable tea shoots in different months of a year was simulated as a sixth-order polynomial function in the present study. In a previous study, Fordham (Reference Fordham, Alvim and Kozlowski1977) divided the year into favourable and unfavourable periods and developed equations to describe the numbers of shoots harvested in each period. However, the transition from one period to the next was difficult to determine. Palmer-Jones (Reference Palmer-Jones1974) and Fordham & Palmer-Jones (Reference Fordham and Palmer-Jones1977) simulated a population of shoots extending exponentially at rates which were normally distributed but modified according to the time of year. However, that model could not explain the size and conformation of the first peak or the decline in yields at the end of the rainy season in Malawi. In the models developed by Tanton (Reference Tanton1981) and Matthews & Stephens (Reference Matthews and Stephens1998a), the number of shoots per unit area was assumed to be constant. Therefore, the model developed in the current study represents a progression in comparison with previous tea models.
The model-simulated shoot number/m2 followed the same general pattern with time. However, it lacked the ability to explain observed variability, particularly during extreme peaks and troughs. This reflects the inadequacy of knowledge and/or need to incorporate other factors causing this unexplained variability into the model. It is known that changes in soil nitrogen fertility have a large influence on shoot population density (Stephens & Carr Reference Stephens and Carr1994). This may also be due to the unavoidable variability inherent in the plucking process adopted by different pluckers. Manual harvesting was practiced in the present study and in most of the previous experiments. However, the potential variability among pluckers was not considered when developing models to estimate tea yields. Moreover, the current model does not consider shoot dormancy or pest and disease occurrences. Therefore, the lack of fit between the model estimated and observed a number of harvestable shoots in certain months of the year would at least be partly due to the factors mentioned above. Overall, results indicate that further testing and improvements in the model are required to improve precision when predicting the harvestable shoot density of tea in different months of the year.
Shoot fresh weight or shoot yield
The model used a simple approach to simulate the biomass production of growing shoots and DM allocation from the MC. The model validation results from different climatic regions showed that the simulated values are in agreement with the observed values except in certain months. The lack of fit for those months could be due to the poor predictability of harvestable shoot number, as discussed above, and/or due to the variation in moisture percentage in shoots in different months in comparison to the constant moisture percentage currently used in the model. Potential impacts of these factors should be considered when improving the model. Experiments conducted in the Low-Country Wet Zone in Sri Lanka have shown that the mean weekly tea shoot yield can vary in the range of 16–20 g/m2/week (Wijeratne Reference Wijeratne1994). As both the measured and simulated results from the same region in the present study are in agreement with previous findings, the model can be used when estimating shoot yield of TRI 2025 under existing management and environmental conditions in that region. Despite these agreements, the model should be further improved and validated as more data become available from diverse climatic and management conditions, including periods with temperature and moisture stresses, to improve the applicability and precision under a wide range of management and climate conditions.
Moisture and temperature stresses
One of the main factors causing a discrepancy between the observed and simulated values in simulation models is due to the weakness in capturing crop responses to moisture stress (Suriyagoda et al. Reference Suriyagoda2010; Amarasingha et al. Reference Amarasingha2015). Moreover, soil–water models have limited application as the validation of those models for various locations is seriously hampered by the lack of data. Though the influence of soil moisture deficiency was used in estimating the changes in shoot yield of tea in Kenya (Carr Reference Carr1977; Othieno Reference Othieno1978) and Malawi (Nyirenda Reference Nyirenda1988), such attempts have not been made for modelling shoot yield of tea grown in Sri Lanka. Therefore, the proposed model provides a framework for predicting water balance and water stress coefficients using limited soil and root distribution-related parameters. The model-estimated SMCs were validated with limited data available from one location with good agreement. Therefore, the current model provides a convenient approach to simulate the tea shoot yield under stress conditions (i.e. moisture and temperature) without incorporating complicated parameters as in the CUPPA tea model (Matthews & Stephens Reference Matthews and Stephens1998b). Moreover, the moisture stress model parameters are not cultivar-specific; thus, the model has potentially broad applicability but requires further testing.
Effect of temperature stress on shoot growth and yield of tea has not been captured by previous tea models. TRI 2025 is a drought-tolerant cultivar and there was no heat stress at Hali-Ela and Talawakelle during the study period. Moreover, the mean daily temperature at Hali-Ela was close to the optimal growth of tea shoots. Talawakelle and Ratnapura represent cooler and warmer regions for tea shoot growth, respectively, and thus cold and heat stresses were prevalent at those sites, respectively, over the year. However, due to the lack of data available on the changes in tea shoot yield at extreme temperatures, model validation for temperature stress coefficients or shoot yield reduction was not possible. Therefore, the discrepancy of simulated and observed tea yields in certain harvests may be due to the inadequacy of information related to the temperature sensitivity of tea.
In summary, despite the close agreement between the measured and model-simulated shoot replacement cycles, LAS, tea shoot yields and SMC in most instances, certain discrepancies were also observed between the model simulated and observed values. Possible causes for such discrepancies are: (i) shoot yield is simulated assuming adequate nutrient availability and the absence of pests and diseases; (ii) harvestable shoot number per unit canopy area was simulated with an average strength and this may be due to the shoot dormancy and heterogeneity among pluckers; and (iii) accuracy of the model adjustments made under temperature and soil moisture stresses could not be adequately tested and validated due to the lack of data. Therefore, these aspects warrant further investigation to improve the present model.
Conclusions
The shoot growth model of TRI 2025 developed and validated in the current study captures shoot replacement cycles over time, DM production and partitioning, and shoot yield of tea in different climatic regions in Sri Lanka, i.e. model-simulated area of a tea leaf (cm2), leaf area of a tea shoot (cm2), time taken for a shoot to reach harvestable stage (days), number of harvestable tea shoots, temperature and moisture stresses and FW of tea shoots at harvest (g/m2) from different locations were in good agreement with the measured values. While the proposed model can be used to simulate shoot yield of tea in tested locations, further improvements with shoot growth data from more locations and under different environmental stresses are required.
Acknowledgements
Authors thank the staff at Tea Research Institutes at Talawakelle Ratnapura and Passara, Glen Alpin Estate, Badulla, Biology Laboratory, Uva Wellassa University and tea smallholders at Hali-Ela for their permission to obtain data and laboratory facilities. Research Facilitation Fund at the Postgraduate Institute of Agriculture, University of Peradeniya.


