Introduction
Dairy cows form a social hierarchy through dominance establishment and this is associated with higher-ranking individuals having supremacy in the use of resources (Phillips and Rind, Reference Phillips and Rind2002). In a dairy herd, the social rank (SR) is related to factors such as age and animal size that can be measured as body condition score (BCS) and live weight (Sottysiak and Nogalski, Reference Sottysiak and Nogalski2010). These factors are associated with physical strength and the competition for space that becomes a driver for aggressiveness of cows in confined spaces (Galindo and Broom, Reference Galindo and Broom2000). Aggressive social interactions create stress conditions between dominant and subordinate cows, which may affect milk production, especially for the subordinate cows (Chebel et al., Reference Chebel, Silva, Endres, Ballou and Luchterhand2016).
Dairy cows enter the milking area in a specific order and their behaviour is often expressed in a relatively consistent pattern (Paranhos da Costa and Broom, Reference Paranhos da Costa and Broom2001; Polikarpus et al., Reference Polikarpus, Kaart, Mootse, De Rosa and Arney2015). Consequently, preference for one side of the milking parlour seems to be a stable characteristic of a dairy cow (Hopster and van der Werf, Reference Hopster and van der Werf1998; Grasso et al., Reference Grasso, De Rosa, Napolitano, Di Francia and Bordi2007). SR (Melin et al., Reference Melin, Hermans, Pettersson and Wiktorsson2006), health-related characteristics (Flower et al., Reference Flower, Sanderson and Weary2006; Polikarpus et al., Reference Polikarpus, Kaart, Mootse, De Rosa and Arney2015) and productive-related characteristics (Górecki and Wójtowski, Reference Górecki and Wójtowski2004) can influence the efficient use of milking facilities. For example, SR, social structure of the herd and individual characteristics, such as anxiety, fear and stress, can influence side preference (Prelle et al., Reference Prelle, Phillips, da Costa, Vandenberghe and Broom2004). In addition, cows with locomotion and udder health problems can have problems to reach milking facilities (Gleeson et al., Reference Gleeson, O'Brien, Boyle and Early2007).
The knowledge about milking order in dairy systems may provide data that can be used for early detection of health problems and prevention of production and economic losses (Polikarpus et al., Reference Polikarpus, Kaart, Mootse, De Rosa and Arney2015). Many studies have pointed out different factors affecting the use of milking facilities but to our knowledge, the interplay between productive traits, the SR and the stability of cows in the order of entrance to the milking parlour remain unexplored. Thus, the aim of this study was to determine whether SR and stability in the order of entrance to the waiting area and milking parlour were affected by productive traits. To address the study's objective animals were initially classified by their SR. We investigated the relationship between SR and: (a) health-related traits (locomotion score (LS), BCS and udder hygiene score (UHS)); (b) stability in the order of entrance to the waiting area and milking parlour and (c) milk production.
Materials and methods
Animals, housing and management
Animal care and procedures were carried out according to the guidelines of the Animal Care and Use Committee of the Pontificia Universidad Católica de Chile (project ID no. 150908002). The study was conducted in a commercial dairy farm located in Pirque, Chile (33°38′28″S, 70°34′27″W). Lactating cows (n = 205; Holstein × Montbeliarde) were managed in three groups according to lactation stage (group 1: 63 cows, 0–100 days in milk (DIM); group 2: 77 cows, 100–201 DIM and group 3: 65 cows, >200 DIM). Animals were housed in dry lots (n = 3; 80 × 80 m2) with shade and had continuous access to water. Each pen had a rectangular-shaped concrete water trough (3.5 × 1.5 m2) and feed bunks were located in one side of the pens (approximately 60 linear m per pen). Cows were fed three times per day (8.00 a.m., 10.00 a.m. and 5.00 p.m.). Animals were milked in a 2 × 6 parallel milking parlour equipped with the DELPRO™ farm manager system (DeLaval, Sweden), three times per day (3.30 a.m., 12:00 p.m. and 6.00 p.m.). The walking distance from the pens to the milking parlour varied from 50 to 100 m, depending on the group's location. Milk yield was recorded daily and analysed as total means. Body weights were individually measured after the first milking using a livestock chute with a weighing bar system. Body weights were recorded every 6 days and means were analysed. Milk components were recorded every 21 days (milk components were analysed by using an infrared analyser: Milko-Scan CombiFoss 6000; Foss Electric, Hillerød, Denmark) and means were analysed.
Behavioural observations and SR determination
During 42 days, agonistic interactions (agonistic encounters included bunting, pushing, threatening, avoiding and fighting) were registered to calculate the SR index of each animal and its subsequent correlation analysis with productive traits (milk production, somatic cell count, lameness score, BCS and UHS). In addition, the sequence of entrance to the waiting area and the milking parlour was used to define two indices of individual stability.
Behavioural observations were undertaken using a video recording system (Sony, YC-231G). Numbered coloured collars were used to facilitate animal identification. Agonistic interactions were registered through direct observation at the water trough after two milking times (12.00 p.m. and 6.00 p.m.) during 2 consecutive days. Water trough access was denied from the moment the group left the pen to be milked until 30 min after the last cow entered the pen (approximately 1 h and 40 min without having access to water troughs in total). Each group was observed during 5 consecutive days for 30 h. At the feed bunks, during 2 consecutive days, agonistic interactions were registered through direct observation two times per day (8.00 a.m. and 5.00 p.m.). Each group was observed for 1 h and 30 min by the same observer.
An SR was calculated for each cow within each group from all observations (from water troughs and feed bunks). This SR was calculated based on methodology described by Galindo and Broom (Reference Galindo and Broom2000) and Hohenbrink and Meinecke-Tillmann (Reference Hohenbrink and Meinecke-Tillmann2012): SR = interactions won/(won + lost interactions). Animals showing a score of 0.0 to 0.4 were classified as subordinates. Individuals with a score from >0.4 to 0.6 were classified as intermediate. Cows with a score from >0.6 to 1.0 were classified as dominant.
Health- and productive-related characteristics
The LS, BCS and UHS were considered as health- and productive-related characteristics. After behavioural observations, these characteristics were recorded at the end of the midday milking (12.00 p.m.) during 6 consecutive days. The LS considered five individual aspects (spine curvature, tracking, speed, head carriage and abduction/adduction) of locomotion in a five-point scale as reported by O'Callaghan et al. (Reference O'Callaghan, Cripps, Downham and Murray2003) and observations were done for once daily for 6 consecutive days. The BCS was based on a five-point scale where 1 = emaciated to 5 = overly fat (Wildman et al., Reference Wildman, Jones, Wagner, Boman, Troutt and Lesch1982). A four-point score was used to measure the UHS based on Ruegg (Reference Ruegg2006) where 1 = completely free of dirt or has very little dirt; 2 = slightly dirty; 3 = mostly covered in dirt and 4 = completely covered, caked on dirt. The same person who was trained for those measurements carried out scorings for locomotion, body condition and udder hygiene.
Milk production and stability in the order of entrance to the waiting area and milking parlour
An automated management information system (DELPRO™, DeLaval, Sweden) recorded the entrance time to the milking parlour, milking duration, milking unit and individual milk yields and associates them with the ear tag embedded identification from each cow. Before each milking, all cows from each group were taken together to a waiting area. During this period, cows were free to choose their position in relation to the entrance in the milking parlour without any intervention of the stockman. The waiting area (120 m2) was in front of the milking parlour (Fig. 1). Both sides of the milking parlour were identical and accessed through automatic gates. The gates were open as soon as a milking unit was empty.

Fig. 1. Layout of the 2 × 6 parallel milking parlour. 1, entrance, 2, waiting area, 3, operator's pit, 4, right alley, 5, left alley, 6, exit alley.
The entrance order to the waiting area and the milking parlour were video-recorded (Sony, YC-231G). Nine records of entrance positions to the waiting area were obtained from each animal. For the entrance to the milking area 15 records of positions per animal were obtained. With these data, the individual stability of each animal was calculated as the standard deviation (s.d.) of its position records. With this information, 30% of the most stable cows and 30% of the less stable cows were selected to form two stability groups for production trait analyses. These groups (stable and non-stable) were compared for production characteristics such as milk production, urea, protein, fat and somatic cells in milk.
The sequence of entrance to the milking parlour was determined using the data obtained by using the DelPro™ program (DeLaval) routinely used in the dairy farm, where the starting time of milking and milking unit used by each cow was recorded. Based on the different numbers of animals from groups 1, 2 and 3, the positions in the order of entrance to the waiting area and milking parlour were standardize from 1 to 9.
Statistical analysis
Correlations were analysed using Pearson (parametric data: SR, milk composition and milk yield) or Spearman (non-parametric data: LS, BCS, udder hygiene and dominance level) tests. Additionally, χ 2 tests were performed to assess whether there was a dependency between LS, BCS and UHS with SR.
Productive characteristics, SR and order of entrance to the waiting area and to the milking parlour from stable and non-stable cows were analysed by using analysis of variance (ANOVA). The groups of cows (stable and non-stable) and their lactation stage were considered as fixed effects in the following model:

where Yijk is the dependent variable; μ is the overall mean; αi is the effect of lactation stage; βk is the effect of stability group and ɛijk is the experimental error.
The homogeneity of variances was analysed with the Levene test. This was followed by the Student–Newman–Keuls multiple comparison of means procedure at P < 0.05 to determine differences between the different groups. Results were expresses as mean ± s.d. Probability of P < 0.05 was defined as significant. SPSS statistical software for Windows was used (version 15.0.0; SPSS Inc., Chicago IL, USA). When statistical analyses were performed, the outliers identified were recognized as the consequence of extraordinary events, such as health problems (i.e. clinical mastitis and abortion), and the need for some veterinary treatment. Therefore, as they did not represent an important segment of the study population, they were eliminated from the analyses.
Additionally, to assess whether there was an effect of position on the s.d. of the position data, the cows were grouped into nine groups according to the average position obtained during the observations, and the s.d. of their locations was calculated. ANOVA or Kruskal–Wallis tests were performed with these data, after heteroscedasticity test of variances. When there was no heteroscedasticity of variance, the multiple comparison was performed using the Tukey's honest significant difference test, and otherwise, through the non-parametric test by notched box plots.
Results
Out of the initial 215 cows in the herd, five cows were culled out due to health problems during the study period; one additional cow had an abortion and was discarded from the study due to the need for veterinary treatment. Of the remaining 209 cows, four were eliminated from the results database, because they presented outlier values in some of the variables analysed. Table 1 shows the final production- and health-related characteristics for each group. Briefly, group 1 consisted of 77 animals, of which 27% were dominant, 38% were intermediate and 35% were subordinate. Group 2 (n = 63) had a distribution of 32% dominant animals, 29% of intermediate animals and 38% of subordinate animals. Group 3 (n = 65), where the animals in their last third of lactation had a distribution of 30% of dominant animals, 39% of intermediate animals and 31% of subordinate animals. The SR evaluation from all animals (n = 205) resulted in 61 dominant animals, 75 intermediate animals and 69 subordinate animals. The agonistic interactions during water consumption represented less than 20% of the total interactions (Table 2).
Table 1. Productive parameters, health-related characteristics and SRs (mean ± s.e.)

Table 2. Agonistic interactions recorded for 5 consecutive days in 205 dairy cows

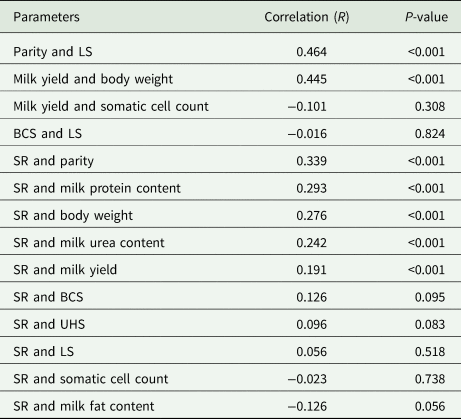
There was a significant correlation between the SR and parity, which means that multiparous cows tend to be dominant individuals in the herd (Table 3). A weak correlation between LS and parity (r = 0.464, P < 0.001) was found, which in a way indicates that animals with more parities have higher lameness scores. BCS had a tendency to be weakly correlated with the dominant animals, where dominant animals were had better scores than the subordinate animals (r = 0.126, P = 0.095). Table 4 shows the distribution of LS, BCS and UHS of cows within SRs. Regardless of SR in the herd, 88% of the cows had an LS of 2, 86% of the cows had a BCS between 2.75 and 3.25 and 78% of the cows had a UHS between 1 and 2. The χ 2 test showed that there was no dependency between LS [χ 2(205) 6, 3.94, P = 0.689], BCS [χ 2(205) 10, 14.3, P = 0.155] and UHS [χ 2(205) 6, 4.3, P = 0.634] on SR (Table 4).
Table 3. Correlations between different parameters for animals with at least five encounters

Correlations were analysed using Pearson (parametric data: SR, milk composition and milk yield) or Spearman (non-parametric data: LS, BCS, udder hygiene and dominance level) tests.
Table 4. Distribution of LS, BCS and UHS of lactating cows in relation to their SR and χ 2 analysis

The stability in the order of entrance to the waiting area had a significant effect on milk production, thus, stable cows had higher milk production than non-stable cows (Table 5). In relation to milk fat, stable cows presented a higher content at the waiting area and in the milking parlour, however, significant differences were only observed in the milking parlour (P < 0.01). The stability in the order of entrance also affected (P < 0.01) the concentration of urea at the waiting area with higher contents detected in stable cows.
Table 5. Productive characteristics, SR and average order of entrance to the milking parlour from stable and no stable cows (mean ± s.d.)

G, probability of lactation stage effect; S, probability of stability effect; SR, social rank.
a Based on the different numbers of animals from groups 1, 2 and 3, the positions in the order of entrance to the waiting area and milking parlour were standardize from 1 to 9.
As shown in Fig. 2, the s.d. of the position of the cows was related to their average position, thus, at the waiting room, the ANOVA test was significant, and differences were observed between the s.d.s of each category. Thus, the Kruskal–Wallis test was used, which gave a value of P < 0.001. This test showed differences among categories 1, 2 and 9, which presented the smallest s.d.s, with the central groups from 4 to 7. At the milking parlour, the ANOVA test was not significant (P = 0.060) and, as in the waiting room, the s.d. of the data presented heteroscedasticity, so the Kruskal–Wallis test was used, which was significant (P = 0.004), obtaining differences between the means of groups 1, 2 and 8 with group 4.

Fig. 2. Notched box plots from average order of entrance to the waiting area and milking parlour.
Discussion
Productive traits and SR
In this study, the SR was determined based on agonistic interactions from each group that was observed during the first minutes when there was no access to water. These findings coincide with a study conducted by Kondo et al. (Reference Kondo, Kawakami, Kohama and Nishino1984) who observed a rapid decrease in the frequency of agonistic encounters as time passes. Similarly, at the feed bunk, Menke et al. (Reference Menke, Waiblinger and Fölsch2000) reported that agonistic behaviour decreases in a relative short period.
Normally, the hierarchy is expressed mainly at the feed bunks (Val-Laillet et al., Reference Val-Laillet, De Passillé, Rushen and von Keyserlingk2008). In this study, cows had water ad libitum after the 1 h 40 min restriction imposed after milking and feed was offered three times a day. In this regard, feed availability was restricted creating more competition among animals, resulting in a greater number of agonistic interactions at the time of feeding (Proudfoot et al., Reference Proudfoot, Veira, Weary and Von Keyserlingk2009). The results of a study conducted by DeVries and Von Keyserlingk (Reference DeVries and Von Keyserlingk2006) concluded that dairy cows experience a lower number of agonistic interactions when they are given more than the standard of 0.61 m of feeder/animal (Grant and Albright, Reference Grant and Albright2001). In the current study, animals had 0.8 m/animal. Previous studies showed that fresh cows, first-calving heifers and cows recently integrated into a group are submissive cows; and larger and older cows in a group are often the most dominant (Guhl and Atkeson, Reference Guhl and Atkeson1959; Grant and Albright, Reference Grant and Albright2001; Phillips and Rind, Reference Phillips and Rind2002).
The correlations between LSs and parity found in this study were weak, however they pointed at the fact that older animals are more prone to having foot problems (Galindo and Broom, Reference Galindo and Broom2000). Hetticha et al. (Reference Hetticha, Hinostrozab, van Schaikb and Tadich2007) reported that the number of births and, therefore, the age, was a risk factor for the presentation of this pathology, where cows with three or more lactations presented 3.8 times more chances of suffering from this condition. This agrees with Sogstad et al. (Reference Sogstad, Fjeldaas and Østerås2005), who found that cows with three or more lactations had higher risks of lameness than those with less than three lactations. In this study, animals that are more dominant had increased body conditions scores. This finding suggest that dominant animals have unrestricted access to different resources (i.e. feed, water and bedding), while subordinate animals have restricted access to the feeding places, which could affect their feed intake (Dickson et al., Reference Dickson, Barr, Johnson and Wieckert1970; Llonch et al., Reference Llonch, Mainau, Ipharraguerre, Bargo, Tedó, Blanch and Manteca2018) and, therefore, their BCS. Overall, in this study, weak correlations and non-significant χ 2 values were found between LS, BCS, UHS and SR. These results, therefore, should be interpreted with caution as this was based on observations from 205 animals, which was not sufficient to have a greater dispersion of scores.
There was a weak correlation between milk yield (mean milk yield for each cow) and dominance; dominant animals had higher performance than the subordinate animals (r = 0.191, P < 0.01). In dry-lot pens, where feeding is not available ad libitum, animals unable to adapt to a competitive environment may be at a disadvantage in terms of the quantity and quality of the feed they have access to (Zobel et al., Reference Zobel, Schwartzkopf-Genswein, Genswein and Von Keyserlingk2011), which could affect their consumption and, therefore, decrease their production. It is very important that the cows have good access to the diet and water throughout the day, to ensure the health, welfare, production and efficiency of the cow (Shabi et al., Reference Shabi, Murphy and Moallem2005). In farms where feed is limited, and competition is high, dominant cows eat more feed (Grant and Albright, Reference Grant and Albright2001) and drink more water (Teixeira et al., Reference Teixeira, Hötzel, Machado Filho, Enríquez Hidalgo and Cazale2009) than subordinate cows.
There were weak correlations between SR and body weight (r = 0.276, P < 0.01), parity (r = 0.339, P < 0.01) and milk yield (r = 0.191, P < 0.01). In this study, when SR was determined at the water troughs and feed bunks, it was observed that dominant animals with larger body size, had unimpeded access to feed and water, while the subordinates were displaced and forced to move to other places without being able to consume feed. These results coincided with the study on a single herd carried out by Dickson et al. (Reference Dickson, Barr, Johnson and Wieckert1970), who suggested that live body weights and age were the factors most closely related to the position of the cow in the social hierarchy. In addition, Schein and Fohrman (Reference Schein and Fohrman1955) reported a high significant relationship between the range of dominance and age, and live body weight as well. On the other hand, the correlations between the SR and BCS and udder hygiene were low; the correlation coefficients were between 0.096 and 0.126 (Table 3). No significant correlation was observed between SR and LSs or somatic cell count (Table 3).
Stability in the order of entrance to the waiting area and milking parlour
At the waiting area, we observed a relationship (P = 0.008) between SR and milk yield, since stable cows (lower s.d.) were those with higher milk yield, compared to non-stable cows (higher s.d.) (Table 5). Furthermore, although stable cows entered into the waiting area 0.12 places after non-stable cows (Table 5) this is not expected to be biologically significant. According to Grasso et al. (Reference Grasso, De Rosa, Napolitano, Di Francia and Bordi2007) the cows have a coherent order of entry to the waiting area, which is considered as a social characteristic of the animals belonging to a dairy system.
The milk urea contents in both groups are within the normal expected range (150–420 mg/l) (Westwood et al., Reference Westwood, Lean and KeIlaway1998). Stable cows had higher contents of milk urea. The concentration of milk urea is related to the supply of nitrogen in the diet, specifically the balance between degradable proteins and energy in the rumen. A high nitrogen intake or an energy deficiency produces an excess of ammonium in the rumen, which is absorbed and transformed into urea in the liver. This increases its concentration in both blood and milk, and its excretion in the urine. These concentrations are important since they can have repercussions for the health, fertility or efficiency in the milk production of the animal (Noro and Wittwer, Reference Noro and Wittwer2003).
We observed a relationship (P < 0.001) between the stability in the order of entrance to the milking parlour and milk fat contents (Table 5). There were no studies found on the association that might exist between the stability in the order of entrance to milking facilities and milk composition. It is known that breed, parity and stage of lactation affect milk yield and milk composition (Kelsey et al., Reference Kelsey, Corl, Collier and Bauman2003). In this study, we were not able to select animals based on parity or number of calvings, which could be helpful to explain the observed relationship.
In relation to the stability in the order of entrance to the milking parlour, the stable animals entered 1.7 positions after non-stable animals, which agree with Hopster and van der Werf (Reference Hopster and van der Werf1998) who found that cows with a consistent side choice took more time to enter the room. Rathore (Reference Rathore1982) found that high-yield cows voluntarily entered the milking parlour earlier than low-yielding cows, and that was explained by the fact that cows were relieving the pressure of the udder caused by the milk, and that was the source of motivation to enter the milking parlour early. However, in the current study, we did not observed a relationship between the stability in the order of entrance to the milking parlour and milk yield. Conversely, Grasso et al. (Reference Grasso, De Rosa, Napolitano, Di Francia and Bordi2007) observed a positive correlation between milking order and milk production in primiparous cows, although the correlation coefficient was not high (r = 0.22). As shown in Table 5, there were no interactions between lactation stage (G) and stability (S) for milk yield, which could indicate that stability is a characteristic associated with the animal independently from its DIM.
Overall, results showed that a cow that prefers to come in first place would likely have less variation in her milking position than a cow in the middle of the herd because it may be easier to consistently be first than consistently be last; also, because there is less scope for variation at each end of the milking order. Although, our study used 205 animals, the heteroscedastic nature of milking position variance in the milking order was also reported in larger herds of around 500 lactating cows (Beggs et al., Reference Beggs, Jongman, Hemsworth and Fisher2018).
Limitations of the study
Additional factors need to be taken into account when interpreting the data from this study. The weak correlations obtained are from the total available animals, without differentiating them by production level. Thus, there was a high percentage of the variance that is a consequence of other factors, some of which were considered in the analysis (lactation group and body weight) and others that the study did not account, such as the number of calvings and months of gestation. In this sense, the significance of the correlations could indicate that, by decreasing the sources of variation in the analysed variables, the value of their correlation with social dominance could increase. Thus, although correlation values were weak, they could be considered as the basis for a larger controlled experimental design in which the effect of the aforementioned variables are included or isolated.
Conclusion
In the current study, SR was weakly correlated with production parameters such as milk yield, protein content, urea content, parity and body weight. SR did not affect cow's stability in the order of entrance to the waiting area and milking parlour. Stable cows had higher milk production and entered the milking parlour after non-stable animals. Overall, under the conditions of this study, the stability of the milking order appeared to be more closely associated with production traits rather than SR.
Acknowledgements
We would like to thank Fundación Agro UC for the animal facilities and assistance in obtaining the research data. Video recording equipment was kindly provided by Rafael Larraín and Jorge Oses. Special thanks should be given to Dr Hanne Helen Hansen from the University of Copenhagen for proofreading our manuscript. Paula Toro-Mujica would like to thank the REDI170084 project supported by the Comisión Nacional de Ciencia y Tecnología (CONICYT) of Chile for financing a scholar visit to the University of Copenhagen.
Financial support
This research received no specific grant from any funding agency, commercial or not-for-profit sectors.
Conflict of interest
The authors declare there are no conflicts of interest.
Ethical standards
Animal care and procedures were carried out according to the guidelines of the Animal Care and Use Committee of the Pontificia Universidad Católica de Chile (ID no. 150908002).