Introduction
Microbial-mediated nitrification is a key biogeochemical process in the global nitrogen (N) balance. Thus, knowledge of the key players in nitrification and prediction of their activity is essential for environmental and economic reasons. Nitrification of ammonia (NH3) to nitrate (NO3−) is believed to be a two-step process performed by two distinct groups of chemolithoautotrophic microorganisms (Kowalchuk et al. Reference Kowalchuk2000). One step oxidizes ammonium (NH4+) to nitrogen dioxide (NO2−) and another oxidizes NO2− to NO3−. Most ammonia-oxidizing bacteria (AOB) belong to the β-proteobacteria. There are two different clusters of nitrifiers within the β-AOB, the Nitrosomonas cluster and the Nitrosospira cluster. The Nitrosomonas cluster includes the genera Nitrosmonas and Nitrosococcus. Similarly, the nitrosospira cluster includes the genera Nitrosospira, Nitrosolobus and Nitrosovibrio. Nitrite-oxidizing bacteria have been described as four genera; Nitrobacter, Nitrococcus, Nitrospina and Nitrospira (Watson et al. Reference Watson1986).
Understanding of the N cycle has been revised in the past few years by the discovery of archaeal nitrification (Jung et al. Reference Jung2011). Archaea is composed of four phyla, Crenarchaeota, Euryarchaeota, Korarchaeota and Nanoarchaeota. Ammonia-oxidizing archaea (AOA) are members of a proposed novel phylum Thaumarchaeota (Gribaldo et al. Reference Gribaldo2010). However, as they are difficult to cultivate, some aspects of their physiology and contribution to biogeochemical pathways are still speculative. Ammonia-oxidizing archaea are found in almost all environments. Crenarchaeotal 16S rRNA gene sequences have been found from sediments of Pacific and Atlantic oceans (Flood et al. Reference Flood2015), lakes (Yang et al. Reference Yang2016), guts of animals (Radax et al. Reference Radax2012), agricultural soils (Tourna et al. Reference Tourna2011) and forest soils (Isobe et al. Reference Isobe2012). Typically, AOA greatly outnumber AOB in soils and sediments. In agricultural soils, the archaeal amoA gene copy number can be 3000 times higher than the bacterial amoA gene copies (Leininger et al. Reference Leininger2006).
Nitrification has been studied thoroughly in upland aerobic agricultural soil ecosystems. However, it is unclear how nitrification occurs in soil under flooded conditions. It has been projected that climate change is likely to affect the atmospheric water distribution pattern. Increasing global temperature will intensify precipitation and may lead to the conversion of many uplands to wetlands in tropical countries (Walther et al. Reference Walther2002; Davidson & Janssens Reference Davidson and Janssens2006). Under this scenario, soil biogeochemical processes will switch from aerobic to anaerobic type. In many South Asian countries such as India, agriculture is dependent on monsoon rainfall. During this period, most upland soils remain inundated for several days depending on precipitation intensity, causing the soil to undergo short-term or long-term anaerobiosis. Soils under flooded conditions undergo anaerobiosis with sequential reduction of NO31−, Fe2+, SO42− and carbon dioxide (CO2) as the terminal electron-accepting process (TEAP). Reduction and oxidation (redox) of the electron acceptors occurs at different temporal and spatial scales in the oxic and anoxic soil compartments. Exposure of anaerobic soil to oxygen leads to the oxidation of various reduced molecules. Therefore, soil undergoing reduction followed by oxidation can be characterized by different redox species and proportions of anaerobic-aerobic microorganisms. The reduction–oxidation is likely to influence the cycling of most elements. To reveal the complex interaction between redox metabolism and nitrification, experiments were carried out with the following objectives: (1) define nitrification potential of soil (vertisol) during reducing conditions, (2) elucidate the interaction between electron donors and nitrification and (3) evaluate the population dynamics of AOB and AOA during nitrification.
Materials and methods
Soil sampling and characterization
Experiments were carried out using soil samples collected from the experimental fields of the Indian Institute of Soil Science, Bhopal, Madhya Pradesh, India (23.30 N, 77.40 E, 485 m a.s.l.). The soil is a heavy clayey vertisol (typic Haplustert) (Mohanty et al. Reference Mohanty2014), characterized with organic carbon (C) of 5.7 g/kg, available N of 225 mg/kg, available phosphorus (P) of 2.6 mg/kg, available potassium (K) of 230 mg/kg, electrical conductivity (EC) of 0.43 dS/m and pH 7.5. The textural composition of the soil was: sand 15.2%, silt 30.3%, clay 54.5%. The soil had 863.24 µm NO3−, 0.01 µm Fe2+ and 101.02 µm SO42−. After collection, the soils were hand-processed after breaking the clods and removing roots and stones. Soil was then passed through a 2-mm mesh sieve and used within 2 days of collection.
Terminal electron-accepting process and nitrification potential
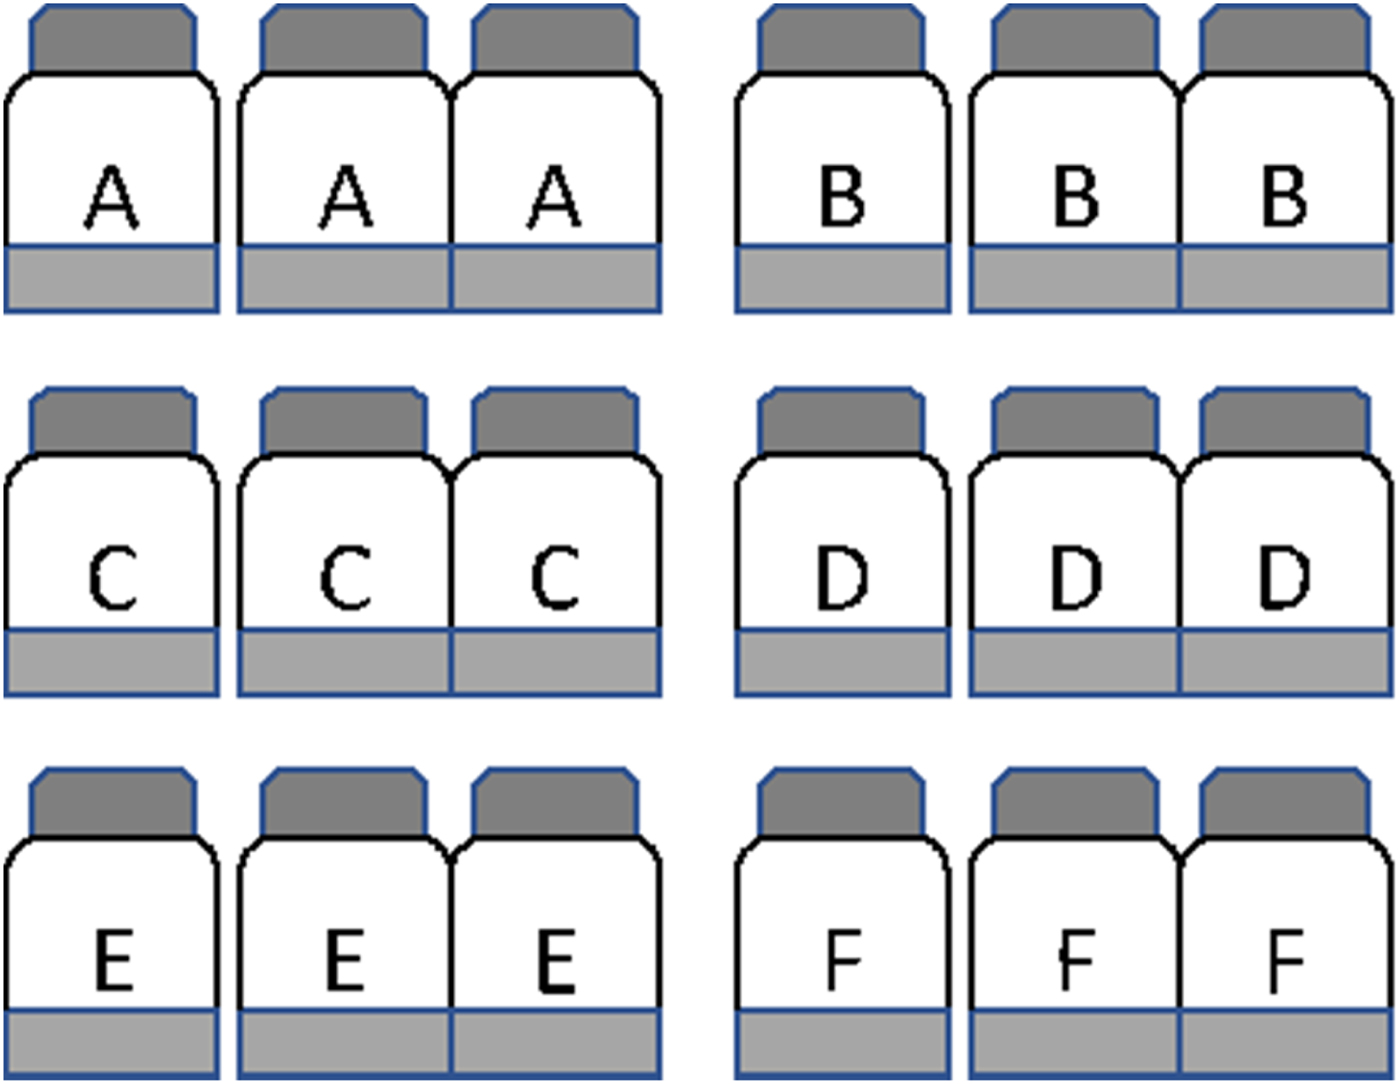
A total of 18 pre-sterilized serum bottles (capacity 130 ml each) were labelled in triplicate as A, B, C, D, E and F (Fig. 1). The bottles labelled A were used to determine the time points of peak reduction of six terminal electron acceptors. The bottles labelled B, C, D, E and F were used to determine potential nitrification corresponding to five different time points. To each bottle was added 20 g soil and 50 ml sterile double-distilled water to maintain a soil:solution ratio of 1:2.5, and closed with a neoprene septum. Peak period of NO3− reduction, Fe3+ reduction, SO42− reduction and methanogenesis were determined by following the change in concentration of electron acceptors in bottles labelled A. Care was taken to select time points when there was no or minimum overlapping of the TEAPs. The remaining bottles (B–F) were used to measure nitrification potential corresponding to five-time points: time zero (at the beginning of incubation), NO3− reduction, Fe3+ reduction, SO42− reduction and methanogenesis. The experiment was carried out in a completely randomized design. All bottles were kept at 30 ± 2 °C in an incubator with shaking at 100 rotations per minute (rpm) on an orbital shaker. To determine temporal variation of the TEAP, slurry sub-samples were withdrawn from the three bottles at regular intervals and concentrations of NO3−, Fe3+, SO42− and headspace CH4 were analysed as described later.

Fig. 1. Microcosms set up to evaluate the effect of redox metabolism on nitrification in the flooded soil ecosystem. Experiments were carried out with three replicates and a total 18 bottles were used. To each bottle, 20 g soil and 50 ml sterile double-distilled water were added. The bottles A were used to determine time points of peak reduction of terminal electron acceptors (NO31− reduction, Fe3+ reduction, SO42− reduction and CH4 production). At time zero, bottles B were amended with 10 mm NH4Cl and incubated to determine nitrification by measuring the accumulation of NO3 over incubation. At the time of peak NO31− reduction, bottles C were opened to ambient air and amended with 10 mm NH4Cl to estimate nitrification. Similarly, bottles D, E, and F were opened at the time of peak reduction of Fe3+, SO42−, and CH4 production and 10 mm NH4Cl was added to estimate nitrification.
To determine the nitrification potential at the peak reducing phases, three bottles were opened and shaken aerobically at 100 rpm for 2 h to equilibrate headspace with the ambient air. Then NH4+ (source: ammonium chloride, NH4Cl) was added at 10 mm concentration. Bottles were sealed again and incubated at 30 ± 2 °C with shaking at 100 rpm. Slurry sub-samples were withdrawn and NO3− concentration was measured daily to determine potential nitrification rate (PNR). The slope of the regression line relating changes in NO3− N concentration with incubation time was used to determine the nitrification potential rate (μg NO3− produced/g soil/day) (Schmidt & Belser Reference Schmidt, Belser, Page, Miller and Keeney1982).
Effect of electron donors on nitrification
To understand the effect of electron donors on nitrification, soil samples were incubated with electron donors. These electron donors (Fe2+ and S2−) were evaluated because their concentration varied significantly during TEAPs. Briefly, 20-g portions of soil samples were placed in autoclaved 130 ml serum bottles and held under flooded conditions by adding autoclaved distilled water at 1:2.5 volume ratio. Soil slurries were then amended with a freshly prepared aqueous solution of different inorganic electron donors at 10 mm concentration. Soil without any amendment served as a control. The electron donor was either Fe2+ (Iron(II) chloride, FeCl2) or S2− (nitrogen sulphide, N2S). Soil slurries were also amended with NH4+ as NH4Cl (10 mm) to measure nitrification. Bottles were kept in an incubator at 30 ± 2 °C with shaking (100 rpm). Slurry sub-samples were collected periodically and NO3− concentration was estimated. Headspace CO2 concentration was also monitored as described below.
Chemical analysis and potential nitrification rate determination
Concentration of the terminal electron acceptors in the slurry samples was estimated by various wet chemical methods. Soil NO3− content was estimated after extraction with calcium sulphate (CaSO4) and reaction by the phenol disulphonic acid method (Jackson Reference Jackson1958). Reduced Fe2+was determined by extracting slurries with 0.5 N hydrochloric acid (HCl) and ferrozine assay (Stookey Reference Stookey1970). Sulphate (SO42−) content was estimated by extracting slurries with calcium dihydrogen phosphate (Ca(H2PO4)2) and turbidometric analysis (Searle Reference Searle1979).
Quantification of methane and carbon dioxide
Gas samples of 0.1 ml were withdrawn from the headspace of the vials using a gas-tight syringe. After each sampling, the headspace was replaced with an equivalent amount of high purity (>99%) helium (He) to maintain atmospheric pressure. The gas He was used because of its inert chemical nature. Gas analysis was carried out using a gas chromatograph (GC) (CIC, India) equipped with a flame ionization detector and a Porapak Q column (2 m length, internal diameter 3.175 mm, 80/100 mesh, stainless steel column). The injector, column and detector were maintained at 120, 60 and 300 °C, respectively. Gas samples were introduced through the port of an on-column injector. The GC was calibrated before and after each set of measurements using different mixtures of methane (CH4) in N2 (Sigma Gases, New Delhi, India) and/or CO2 in N2 (Inox Air, Bhopal, India) as primary standards. Methane was quantified with an attached methanizer module. The temperature of the methanizer was 330 °C and the retention times of CH4 and CO2 were 1.30 and 2.5 min, respectively.
DNA extraction
DNA was extracted from 0.5 ml of the slurry sample using the ultraclean DNA extraction kit (MoBio, USA) according to the manufacturer's instructions. The DNA concentrations were determined in a biophotometer (Eppendorf, Germany) by measuring absorbance at 260 nm (A260), assuming that 1 A260 unit corresponds to 50 ng of DNA per μl. DNA extraction was further confirmed by electrophoresis on a 1% agarose gel. The extracted DNA was dissolved in 50 µl TE buffer and stored at −20 °C until further analysis.
Polymerase chain reaction amplification
Polymerase chain reaction (PCR) was performed in a total volume of 50 µl containing 1.0 ng of DNA template, 1× PCR buffer (10× PCR buffer II, ABI, CA, USA), 0.2 mm dNTP (Axygen, USA), 1.5 mm MgCl2, 0.1 µm of each primer and 1 U of DNA polymerase (NEB, USA). Thermal cycling was carried out by an initial denaturizing step at 94 °C for 4 min, 35 cycles of 94 °C for 1 min, 56 °C for 30 s, 72 °C for 45 s; final extension carried out at 72 °C for 5 min. The major cycling programme for each primer set is described elsewhere (Francis et al. Reference Francis2005). Fluorescently labelled gene fragments were generated by PCR using 6-carboxyfluorescein labelled at 5′end of the forward primers. The forward primer amoA-1F (5′-GGG GGT TTC TAC TGG TGG T) and the reverse primer amoA-2R (5′-CCC CTC KGS AAA GCC TTC TTC; K = G or T; S = G or C) were used (Caffrey Reference Caffrey1995). The primer set targets AOB. The amplicons correspond to positions 332 to 349 and 802 to 822, respectively, of the open reading frame of the amoA gene sequence of Nitrosomonas europaea (Horz et al. Reference Horz2000). The amo-111F (5′-TTY TAY ACH GAY TGG GCH TGG ACA TC; H = A or C or T; Y = C or T) and amo-643R (5′-TCC CAC TTW GAC CAR GCG GCC ATC CA; W = A or T; R = A or G) primers were used to amplify the amoA gene of AOA (Treusch et al. Reference Treusch2005). Polymerase chain reaction products were loaded onto a 1% agarose gel to ensure that fragments of the correct size were amplified; they were purified from the reaction mix using a PCR purification kit (Axygen, USA).
Terminal-restriction fragment length polymorphism analysis
Terminal-restriction fragment length polymorphism (TRFLP) analysis was performed on samples for which PCR product was generated. Fluorescently labelled PCR products (100 ng) were digested separately with three restriction enzymes (TaqI, HhaI, HaeIII) for AOB. Similarly, AOA digestion was performed with Msp, HhaI and RsaIII. The restriction enzymes were selected based on the ISPaR tool of the Microbial Community Analysis (MiCA) online resource (http://mica.ibest.uidaho.edu/trflp.php; Shyu et al. Reference Shyu2007). Samples were digested with each restriction enzyme by incubating the purified PCR product at 37 °C for 3 h. After digestion, the enzymes were inactivated by incubating the digested samples at 65 °C for 20 min as per the manufacturer's instruction (New England Biolabs, USA). The digested products were sent for fragment analysis at Macrogen (Korea). Aliquots (2–5 µl) of digest were mixed with 2.0 µl formamide and 0.5 µl of an internal length standard Liz 500 (Applied Biosystems, USA). The samples were denatured at 94 °C for 5 min and immediately placed on ice until loading onto genetic analyser (3500, Applied Biosystems, USA). Electrophoresis data were analysed using the GeneScan software (version 1.0, Applied Biosystems, USA). Fragments between 30 and 600 bp were included in the analysis. The area of each peak was expressed as a percentage of the total peak area. Peaks comprising <1% of the total area were removed from the analysis. Profiles were exported and data normalized to minimize error. The relative abundances of individual terminal-restriction fragments (TRFs) in a given PCR product were calculated based on the peak areas of the individual TRF in relation to the total peak area of all TRFs detected in the respective TRFLP community fingerprint pattern.
Phylogenetic assignment of terminal-restriction fragments
The putative phylogenetic identities of the AOA and AOB were determined by use of several web-based programs. Full-length amoA gene sequences were downloaded from the National Center for Biotechnology Information (NCBI, Bethesda, MD, USA). In silico PCR and DNA restriction were performed using ISPaR (Shyu et al. Reference Shyu2007). The in silico digestion generated TRFs representing different AOB and AOA. The primers and restriction enzymes used for in silico ISPaR were the same as for the invitro PCR and TRFLP analysis. The TRF nomenclature was based on the in silico analysis of fragment data using the web-based program APLAUS-MiCA (http://mica.ibest.uidaho.edu/trflp.php). The predicted TRFs were imported into PAT (MiCA) and matched with the TRFs generated from the samples. The normalized relative abundance of each TRFs was calculated by the APLAUS tool of MiCA (Shyu et al. Reference Shyu2007).
Statistical analysis
All statistical analyses were carried out using the ‘agricolae’ (De Mendiburu Reference de Mendiburu2014) and ‘vegan’ (Oksanen et al. Reference Oksanen2007) packages of the statistical software R (2.15.1) (Ihaka & Gentleman Reference Ihaka and Gentleman1996). Results for the experiments were presented as arithmetic means of triplicate samples. Significant difference among the treatments for a given parameter was tested by an analysis of variance (ANOVA) followed Tukey's HSD at P < 0.05. Effect of factors (NO3−, Fe2+, SO42−, CH4) on the variables (nitrification, relative fluorescence of TRFs), was tested by ANOVA. A linear regression model was developed to define the relationship between PNR and the variables. The confidence level of the regression model was evaluated with r 2 and P < 0.05. Complex interaction between electron acceptors and nitrification was derived by multiple regression models. For the interaction, the independent variable was PNR and dependent variables were NO3−, Fe2+, SO42− and CH4. The predicted PNR was correlated with observed PNR to test the significance of variation. After natural log transformation and normalization of data, Principal component analysis (PCA) was carried out to identify the major factor and the complexity of interaction. Principal component analysis was interpreted graphically by constructing a biplot, with the original variables drawn as vectors that summarize the inter-correlation between the variables. Principal component analysis biplots are a convenient way of mapping the original variables because the angles of the biplots depict the direction of correlation and the length depicts the amount of correlation. A biplot was made using the values of three replicated observations.
Results
Terminal electron-accepting processes
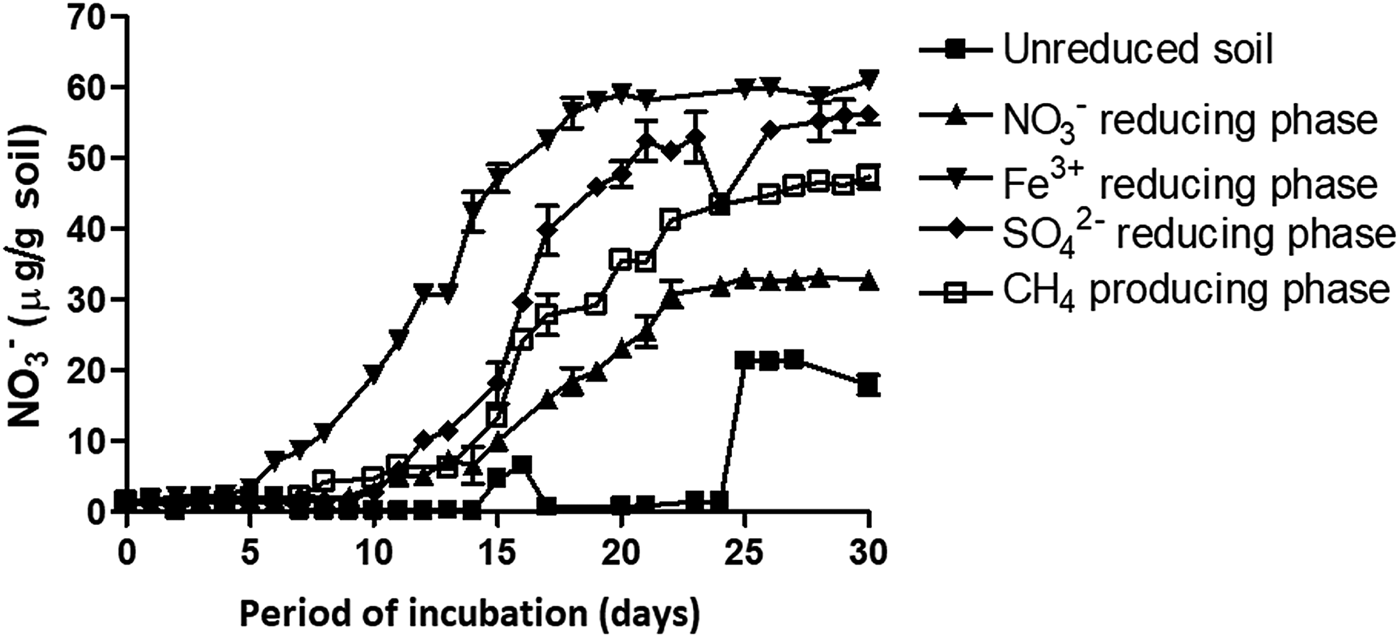
The redox metabolism or the TEAPs followed a classical sequential reduction. The reduction metabolism proceeded with NO3− reduction, Fe3+ reduction, SO42− reduction and CO2 reduction (methanogenesis) (Fig. 2). Nitrate reduction was initiated 2 days after flooding and completed within 2 weeks. A total of 800 µm NO3−was reduced during denitrification. Iron (Fe3+) reduction was initiated after 10 days. Concentration of Fe2+ increased to 45 µm over 60 days. Sulphate reduction was initiated during the 35 days of incubation. Initial SO42− concentration was ~95 µm and declined to 25 µm at 60 days of incubation. Methane production was initiated after 40 days of incubation. The cumulative value of CH4 production was 14.59 µg/g soil after 60 days of incubation. The time points of peak TEAPs were 10, 20, 35 and 50 days representing NO3− reduction, Fe3+ reduction, SO42− reduction and methanogenesis, respectively.
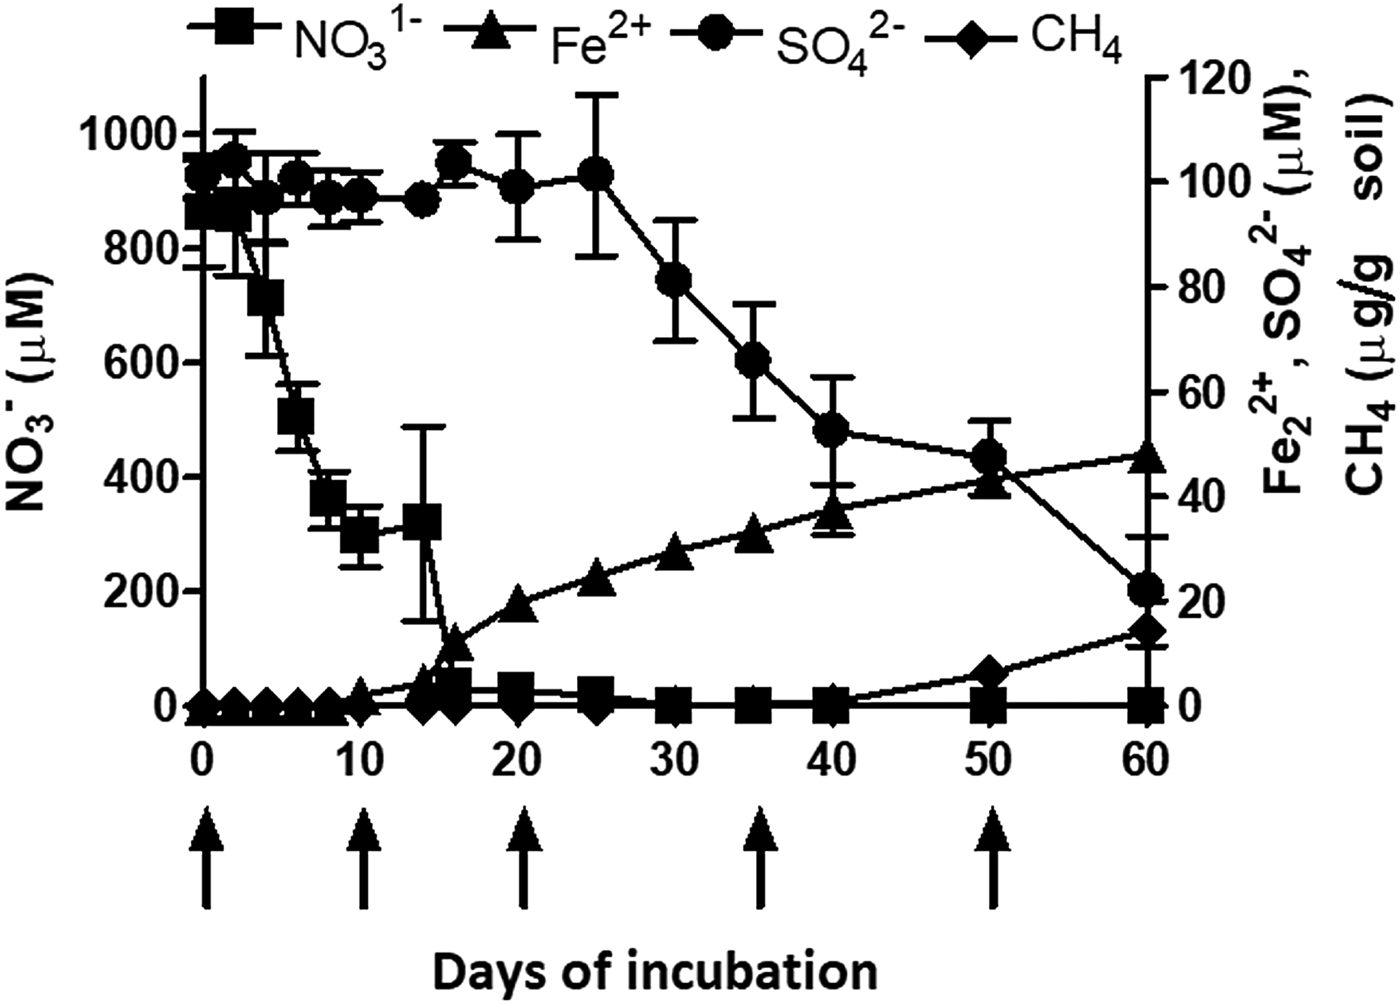
Fig. 2. Microbial redox metabolism or sequential reduction of terminal electron acceptors in a vertisol under flooded moisture regime (Top). Left Y axis represent NO3− (square) concentration, while, right Y-axis represents Fe2+ (triangle), SO42− (sphere), and CH4 (diamond) concentration. X axis represents days of incubation. Each datapoint represents the arithmetic mean and standard deviation of three replicated observations. Arrows indicate time points (0d, 8d, 20d, 35d, 50d) of peak terminal electron-accepting processes when the slurries were incubated further to determine potential nitrification rate.
Nitrification during sequential reduction process
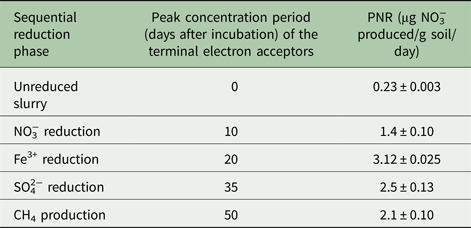
Unreduced slurry (0 day) gave 1.33 mm NO3−over 30 days of incubation. Contrastingly, NO3− reducing and Fe3+ reducing slurries resulted in 2.15 and 3.9 mm of NO3−, respectively. Potential nitrification rate at different ion reducing phases (at peak TEA concentration) followed the trend of Fe3+ reducing >SO42− reducing >CO2 reducing > NO3− reducing > unreduced soil (Fig. 3). The PNR of the unreduced slurry was 0.23 µg NO3−produced/g soil/day and it increased 14-fold during the Fe3+ reduction phase over the unreduced slurry (Table 1).

Fig. 3. Nitrification in differently reduced slurry samples. Slurries were incubated for a period of 30 days to determine potential nitrification rate. Each datapoint represents arithmetic mean of three replicated observations with standard deviation as error bar.
Table 1. Potential nitrification rate (PNR) of a vertisol during sequential reduction of terminal electron acceptors. For all samples n = 3 and P < 0.01

NO3−, nitrate; Fe3+, ferric iron; SO42−, sulphate; CH4, methane.
Effect of electron donors on nitrification
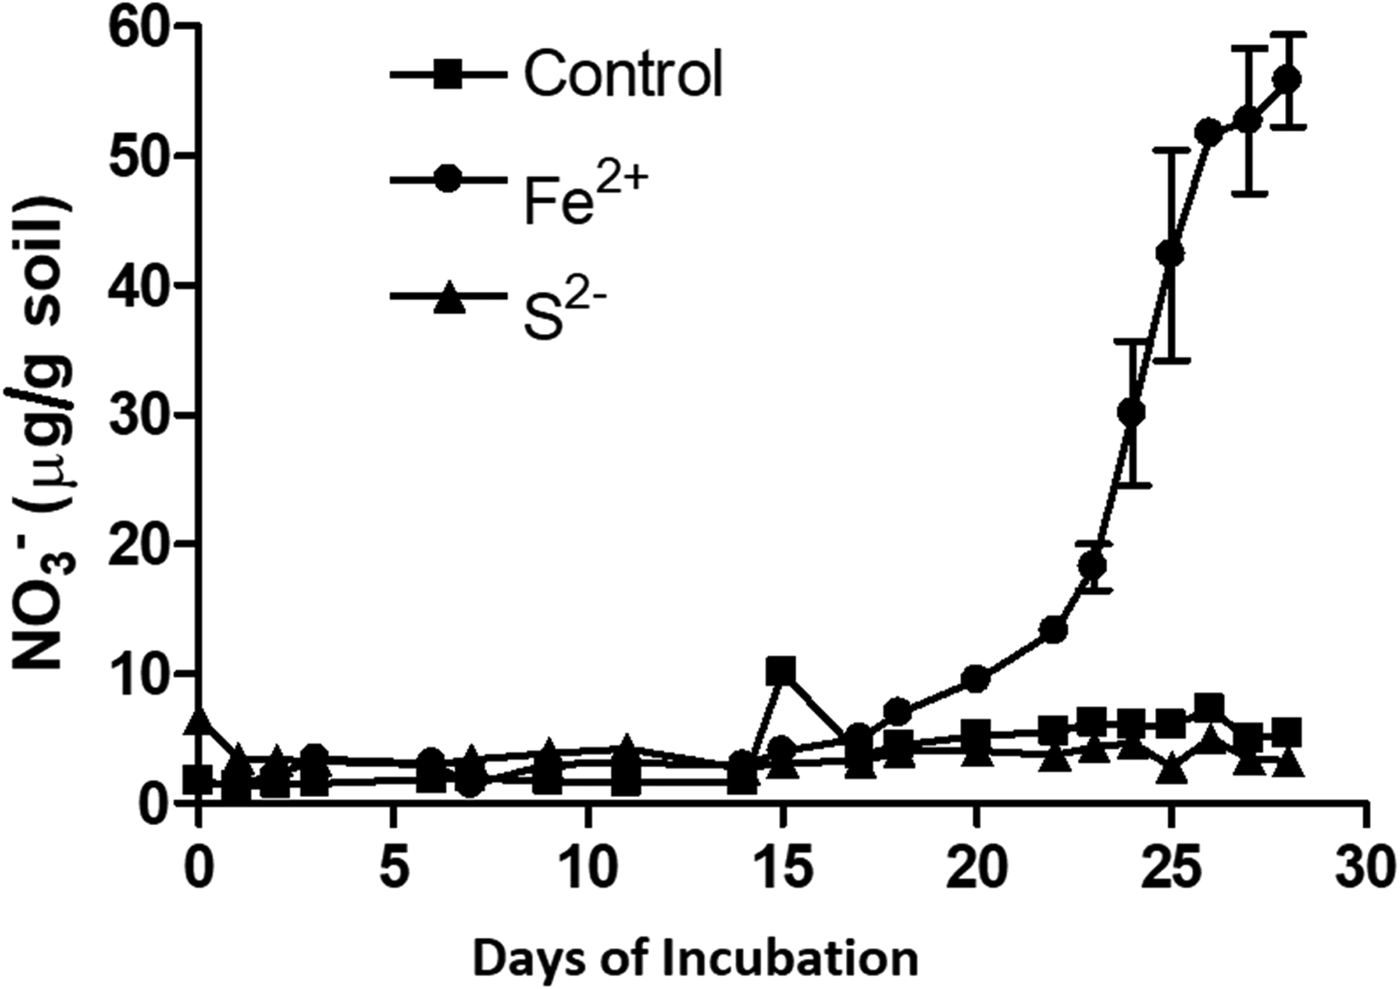
Presence of Fe2+ stimulated nitrification, while, S2− inhibited this process (Fig. 4). Nitrification was initiated 15 days after Fe2+ addition. A sum of 55 µm NO3−was produced in the soil amended with Fe2+. Potential nitrification rates of the un-amended control and Fe2+ amended soil were 0.196 and 1.63 µg NO3− produced/g soil/day, respectively. Soil amended with S2− exhibited the lowest nitrification activity as it failed to produce any measurable amount of NO3−. Potential nitrification rates with Fe2+ and S2− were 8.31 times higher and 13 times lower, respectively, than the un-amended control (Table 2). Production of CO2 was stimulated by addition of Fe2+ and was inhibited by S2− (P < 0.01) (Table 2).

Fig. 4. Effect of electron donors on nitrification in a vertisol. Slurry samples were incubated with NH4+ as NH4Cl (10 mm). The electron donor was either Fe2+ (sphere), or S2− (triangle) at 10 mm concentration. Soil without any amendment served as control (square). Y-axis represents NO3− concentration, X-axis represents incubation period in days. Each datapoint represents arithmetic mean of three replicated observations with standard deviation as error bar.
Table 2. Influence of electron donor on the potential nitrification rate (PNR) and cumulative CO2 production in soil (vertisol)
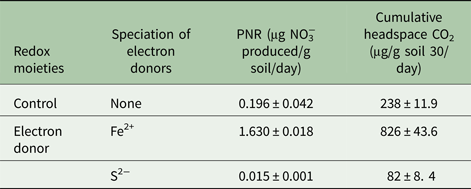
Soil samples were incubated with electron donors and PNR was determined from the rate of increase of NO3− over incubation period of 30 days. For all samples n = 3 and P < 0.01.
NO3−, nitrate; CO2, carbon dioxide.
Terminal-restriction fragment length polymorphism analysis of nitrifying microbial community
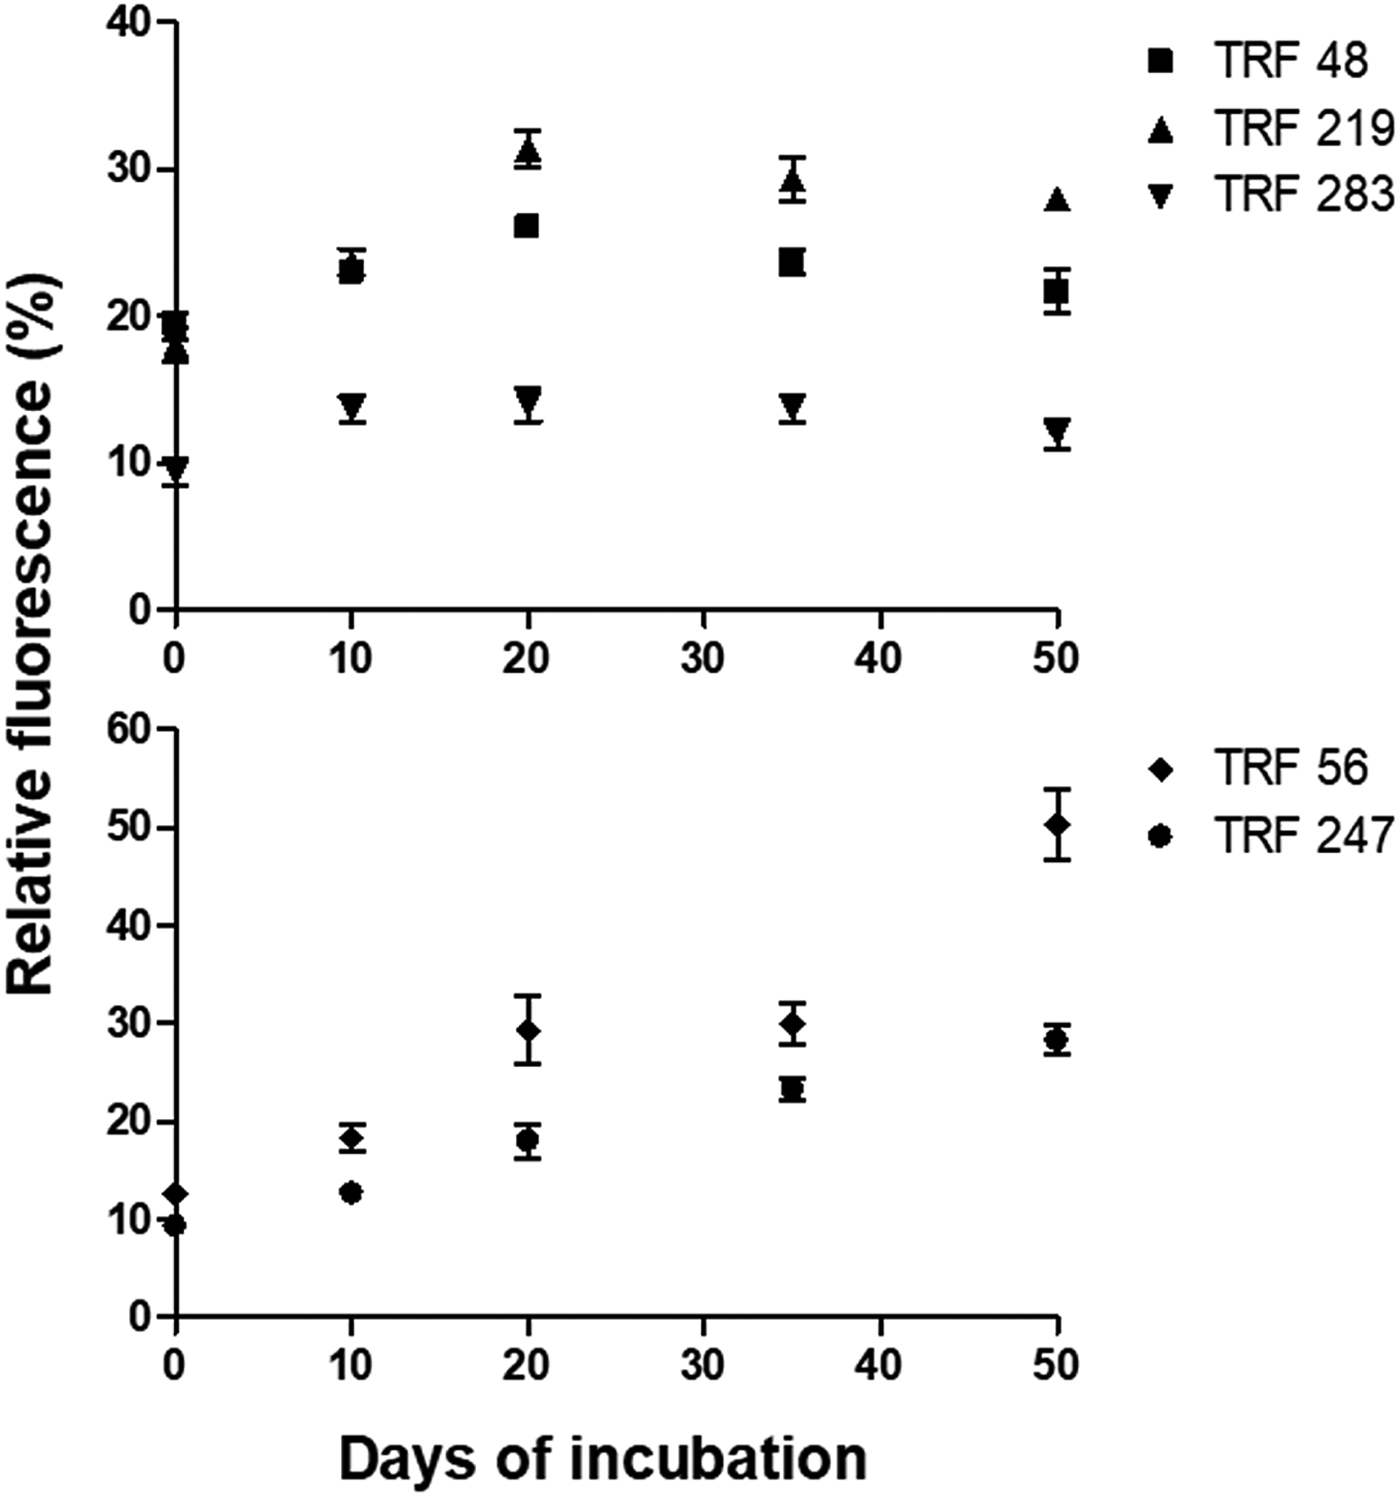
The AOB-specific TRFs were of 48 bp, 219 bp and 283 bp (Fig. 5). These TRFs were affiliated to Nitrosomonas, Nitrososcoccus and Nitrosospira. The AOA-specific TRFs were of 56 bp and 247 bp. These TRFs represented Crenarchaeota clade 1.1a and 1.1b (Ying et al. Reference Ying, Zhang and He2010). The in silico nomenclature was tentative because the TRFs were not confirmed through sequencing of the fragments. The relative fluorescence (%) of AOB was influenced by the oxygen reduction metabolism. It peaked during Fe3+ reduction. In unreduced soil, the relative fluorescence of these TRFs varied from 9.33 to 19.33%. The relative fluorescence of Nitrosospira was low and Nitrosomonas was high. During Fe3+ reducing phase, the relative fluorescence of Nitrosospira was 14%, while that of Nitrosomonas and Nitrososcoccus was 48 and 31.33%, respectively. Relative fluorescence of AOA varied significantly during the course of soil reduction. The Crenarchaeota clade 1.1a and Crenarchaeota clade 1.1b had relative fluorescence of 9.33 to 12.67% before initiation of redox process. The relative fluorescence of these two TRFs increased to 33.33 and 53.67%, respectively, during incubation.

Fig. 5. Relative fluorescence of terminal restriction fragments (TRFs) indicative of AOA gene (alpha subunit of amoA) in slurry samples during redox metabolism. The TRFs of 48 bp, 219 bp, and 283 bp represented ammonia oxidizing bacteria (top). TRFs of 56 bp and 247 bp represented ammonia-oxidizing archaea (bottom). Each datapoint is arithmetic mean and standard deviation as error bar of three replicated observation. Y-axis represents relative fluorescence of TRFs, X-axis represents sampling period in days.
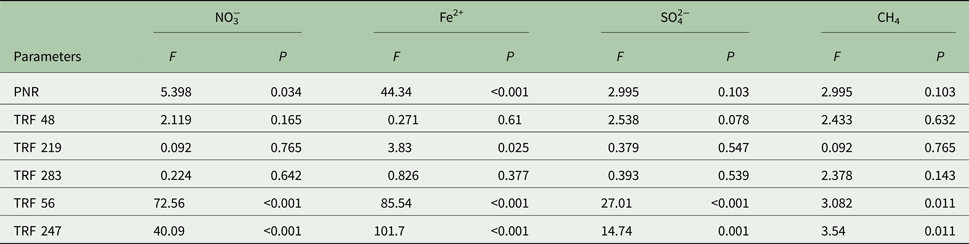
Statistical interpretation
The effect of redox species (NO3−, Fe2+, SO42−, CH4) on PNR and TRFs is shown in Table 3. Concentration of NO3−had a positive (P < 0.05) relationship with PNR, TRF 56 and TRF 247 (P < 0.001). Similarly, Fe2+was positively (P < 0.001) related to PNR, TRF 219, TRF 56 and TRF 247. Change in SO42− concentration was significantly (P < 0.05) related to TRF 56 and TRF 247. Headspace CH4 was significantly (P < 0.01) related to TRF 48. The relationship between PNR and the variables was analysed by linear regression model (Fig. 6). The model indicated a significant linear relationship between PNR and NO3− (P < 0.001), Fe2+ (P < 0.001), TRF 219 (P < 0.001), TRF 56 (P < 0.05) and TRF 247 (P < 0.05). However, the regression model was not significant with SO42−or CH4. A multiple regression analysis predicted PNR as 0.303 NO3− (μm/g) + 0.661 Fe2+ (μm/g) − 0.629 SO42− (μm/g) − 0.074 CH4 (μg/g). The predicted nitrification correlated significantly with the observed values (r 2 = 0.82, P < 0.001).
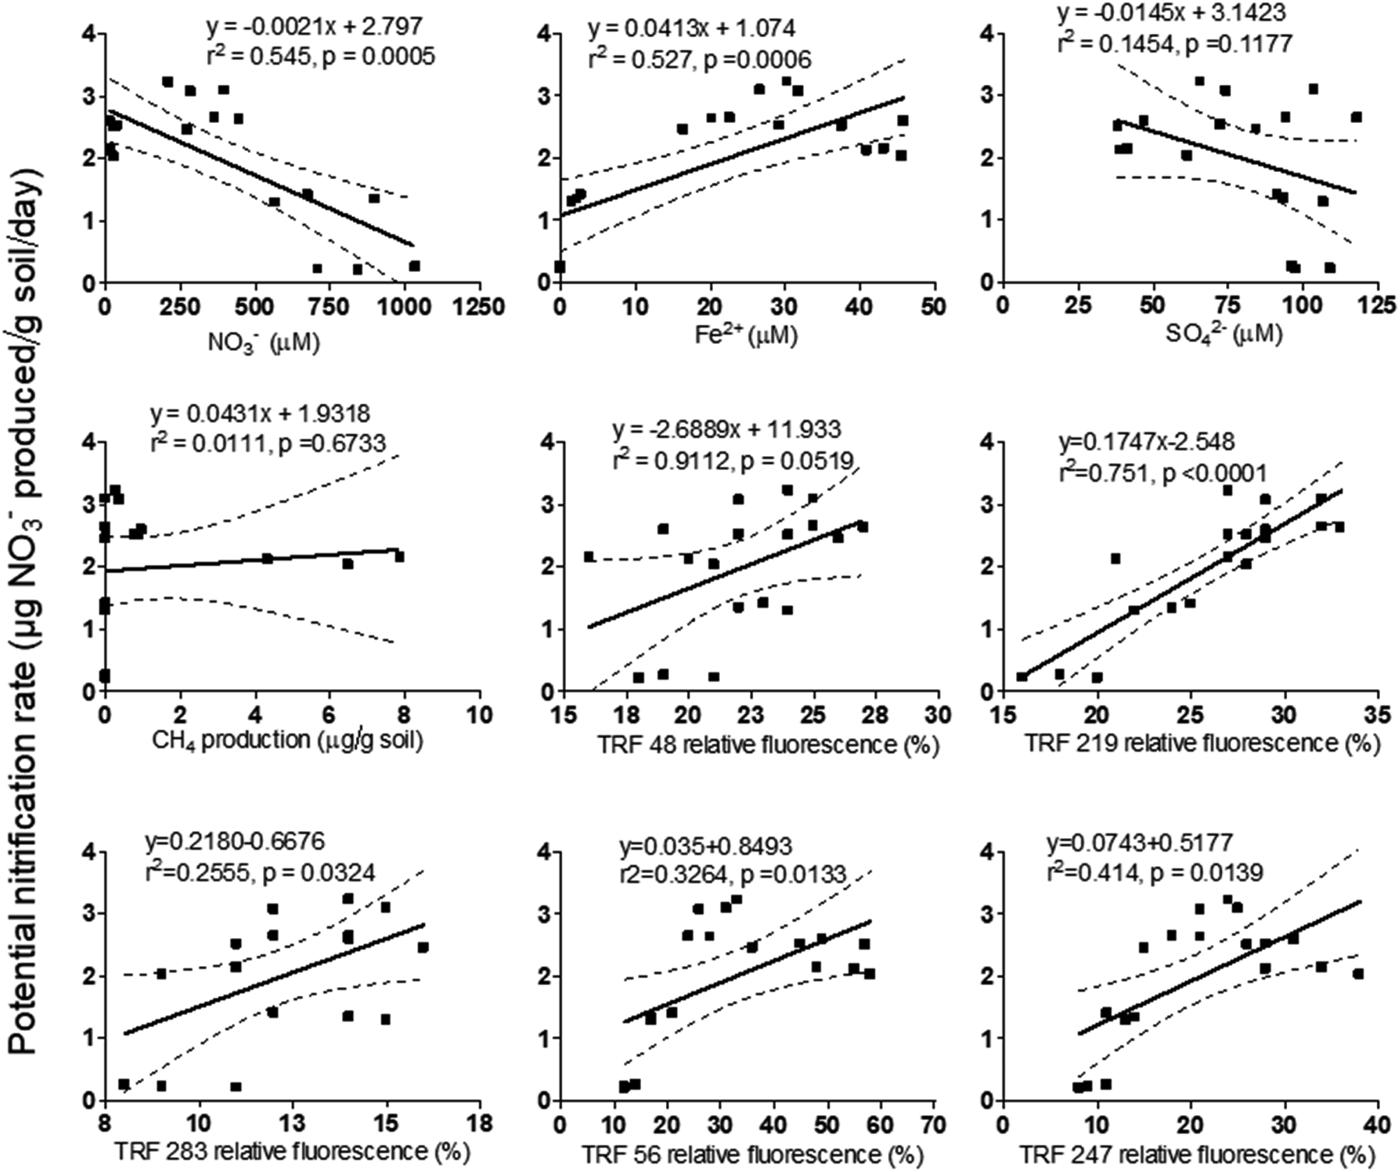
Fig. 6. Linear regression model (α 0.05) to predict potential nitrification rate from different parameters like concentration of terminal electron acceptors and microbial abundance. Y-axis represents potential nitrification rate and X-axis represents parameters corresponding to the plots.
Table 3. Effect of redox species (NO3−, Fe2+, SO42−, CH4) on potential nitrification rate (PNR), relative fluorescence of ammonia-oxidizing bacteria (TRF 48, TRF 219, TRF 283) and ammonia-oxidizing archaea (TRF 56, and TRF 247)

Analysis of variance (ANOVA) with F and P values were estimated using the aov (parameter~factor) command in the console of R statistical program. High F and low P values indicate a significant level of impact. For all samples n = 3.
NO3−, nitrate; Fe2+, ferrous iron; SO42−, sulphate; CH4, methane.
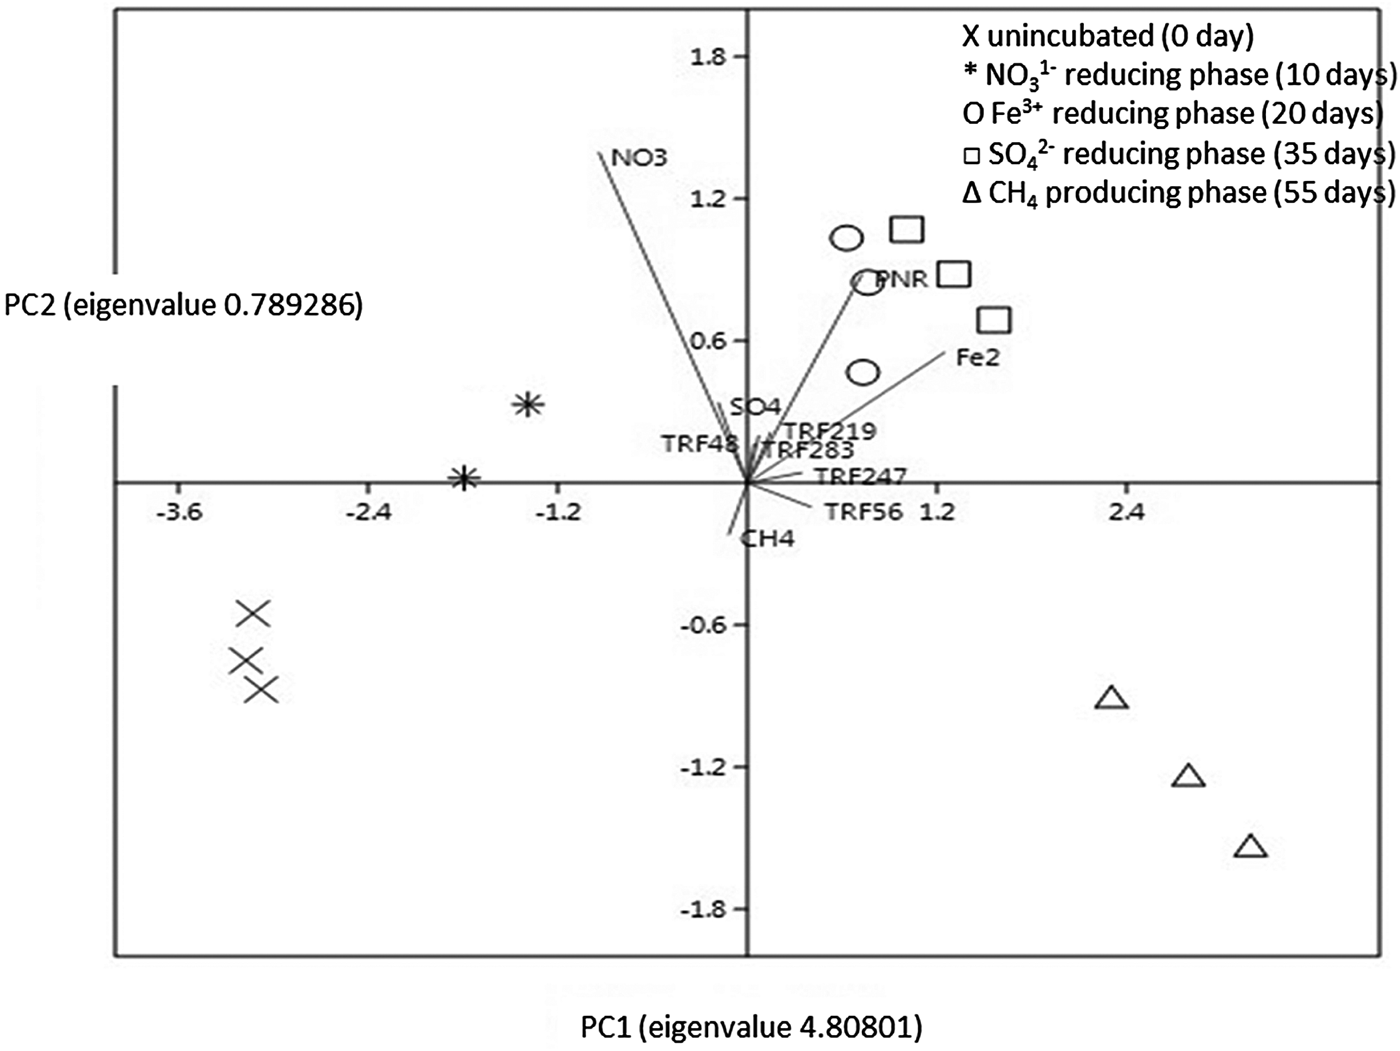
The relative interaction among the variables was evaluated by a PCA biplot (Fig. 7). Principle component analysis of the data matrix resulted in most of the data variance being explained by the first two principal components. The first component explained 72.90% of the total variance, while 19.52% of the variance was explained by the second component. The PCA revealed thats Fe2+, TRF 56 and TRF 247 were associated with PNR, while SO42− and CH4 exhibited the opposite interaction.

Fig. 7. PCA biplot with vectors of variables (lines) and factors. PC1 contributed 72.84% variation and PC2 contributed 19.45% variation. The factors are incubation period: 0 day (cross), 10 days (star), 20 days (circle), 35 days (square), and 55 days (triangle). The vectors (variables) are PNR, NO3−, Fe2+, SO42−, CH4, TRF 48, TRF 219, TRF 283, TRF 56, and TRF 247. Vectors with narrow angles are strongly correlated; arrows that are perpendicular show no correlation while those of in opposite directions indicate negative correlation. More confidence characterizes comparisons between variables with longer lines, as inferences made from variables located near the centre of the diagram are often imprecise.
Discussion
Terminal electron-accepting process
The TEAPs followed the classical sequence of reduction of terminal electron acceptors. The sequential reduction of soil is generally carried out by different soil microbial groups (Patrick & Delaune Reference Patrick and Delaune1972; Froelich et al. Reference Froelich1979). The consistency of sequential reduction indicated that soil samples were relatively homogeneous and inherent soil properties had a minimum contribution to the variations in reduction potentials (Gao et al. Reference Gao2002; Tanji et al. Reference Tanji2003). Sequential reduction of the NO3−, Fe2+, SO42− and CO2 overlapped during TEAPs. Microbial groups responsible for the reduction of different electron acceptors probably tend to overlap. Many anaerobes reduce more than one terminal electron acceptor. For example, many nitrate reducers are Fe3+ reducers and even some SO42− reducers are methanogenic and also are capable of reducing Fe3+ (Coleman Reference Coleman1993; Lovley et al. Reference Lovley1993).
Nitrification during terminal electron-accepting process
Multiple regression model indicated that PNR was positively associated with nitrate and Fe2+ concentrations, negatively associated with SO42− concentrations, and had no relationship with CH4 concentrations. Slurry undergoing simultaneous denitrification and Fe3+ reduction exhibited high PNR because the regression coefficients of both electron acceptors were positive. Similarly, at the time of overlapping Fe3+ reduction and SO42− reduction, nitrification proceeded because the coefficient of Fe2+ was higher than SO42−. In general, slurry undergoing active denitrification and Fe3+ reduction resulted in high nitrification. On the contrary, nitrification was inhibited by SO42− reduction and methanogenesis. It is likely that Fe2+ stimulated nitrification while S2− inhibited it. Iron pyrite (FeS2) has been found to inhibit nitrification in luvisols (Blaise et al. Reference Blaise, Amberger and von Tucher1997). This is consistent with the observation in the current study that the reduced state of S produced during SO42− reduction affected nitrification. Nitrification is a slow process compared to other aerobic microbial activities. Therefore, the nitrification progressed with a prolonged lag phase. The lag phase of autotrophic nitrifiers has been studied in water, aquatic plants, sediments and slimes. The lag phase of these samples varied from 20 to 55 days (Matulewich et al. Reference Matulewich, Strom and Finstein1975). Slow growth of nitrifiers and the rate-limiting factor for conventional biological removal of N compounds from water treatment plants has also been reported earlier (Zhou et al. Reference Zhou, Ye and Zhao2014a).
Effect of electron donors on nitrification
Stimulation of nitrification by Fe2+ can be explained by three mechanisms: (1) Fe3+ acts as an electron acceptor and mediates NH4+ oxidation. Slurries were incubated aerobically but the occurrence of microaggregates cannot be ruled out. These microaggregates probably acted as sites for Fe3+ reducing NH4+ oxidation. (2) High CO2 produced from the soil by amendment of Fe2+ stimulated nitrification. Carbon dioxide serves as the substrate for autotrophic nitrifiers and stimulates nitrification. The positive effect of CO2 on autotrophic nitrifiers has been reported earlier (Kox & Jetten Reference Kox, Jetten and Lugtenberg2015). In soil, CO2 is produced from organic matter decomposition. Soil micro-aggregates could be the source of CO2 originating from the Fe3+ reduction coupled organic matter oxidation. (3) A third hypothesis is based on the fact that Fe2+/Fe3+ cycling altered the soil physical properties. For example, conversion of Fe2+ to Fe3+ results in the formation of minerals of the high surface area (as Fe2O3). These minerals probably stimulated aerobic nitrification. In nature, iron oxides are ubiquitous reactive constituents of soils, sediments and aquifers. These minerals have extensive surface area and bind to an array of trace metals, nutrients and organic molecules (Li et al. Reference Li2014). The current results also revealed that nitrification was inhibited during SO42− reduction or in the presence of the electron donor S2−. This may have been due to competitive inhibition of nitrification by S2− for O2. The negative effect of S2− on nitrifiers has been observed in wastewater treatment. In previous studies, it has been observed that S2− at 0.5 mg/l inhibited nitrification by 30–40% (Kuenen & Robertson Reference Kuenen, Robertson and Rosenberg1993; Zhou et al. Reference Zhou2014b).
Terminal-restriction fragment length polymorphism analysis
Microbial diversity in different terrestrial ecosystems has been explored by TRFLP. The TRFs retrieved covered various groups of AOB and AOA. These groups have been reported in plant rhizospheres (Park & Noguera Reference Park and Noguera2004; Siripong & Rittmann Reference Siripong and Rittmann2007), meadow (Mintie et al. Reference Mintie2003), grassland (Horz et al. Reference Horz2000) and agricultural soils. A TRF of 48 bp and 219 bp has been identified as representative of Nitrososmonas lineage, while a TRF 283 bp as Nitrosospira lineage (Park & Noguera Reference Park and Noguera2004). Similarly, TRFs indicative of AOA have been found in temperate forest soil (Szukics et al. Reference Szukics2012). All three TRFs of AOB had similar relative fluorescence during the course of soil reduction. Relative fluorescence of AOB was high during NO3− and Fe3+ reduction and low during SO42− reduction and CH4 production. The reduced S molecules (S2−) could have inhibited AOB (Elliott et al. Reference Elliott, Ragusa and Catcheside1998; Rittle et al. Reference Rittle, Drever and Colberg1995). Under anaerobic conditions, metal sulphides (MS−) are precipitated and immobilized (Moore e t al. Reference Moore, Ficklin and Johns1988; Zhang & Millero Reference Zhang and Millero1994). These MS− inhibit many aerobic (Joye & Hollibaugh Reference Joye and Hollibaugh1995) and anaerobic microorganisms (McCartney & Oleszkiewicz Reference McCartney and Oleszkiewicz1991). Relative fluorescence of AOA indicative TRFs increased consistently, due to the predominance of archaeal populations during redox metabolism. Therefore, the current study highlighted that AOA probably carried out nitrification during redox metabolism. Secondly, the adverse conditions for AOB due to the accumulation of S2− resulting from SO42− reduction probably favoured AOA. Nitrification is generally carried out by both AOB and AOA, although nitrifying bacteria are more dominant than the archaea. Thus, when the abundance of AOB was inhibited by reduced S molecules, the abundance of AOA increased to carry out nitrification.
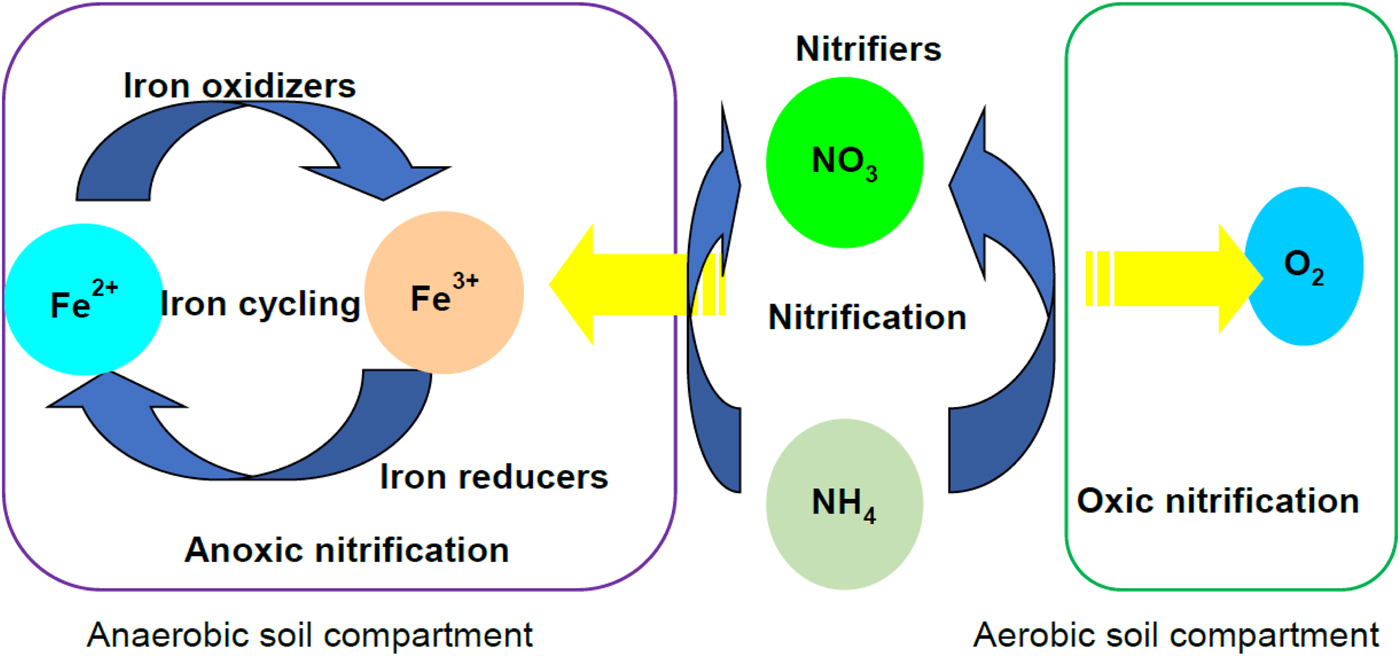
The ANOVA showed that NO3− and Fe2+AOA influenced PNR and archaeal TRFs positively, while SO42− and CH4 has a positive influence on the archaeal TRFs. Thus, AOB probably regulated nitrification during the initial reductive phases, while AOA carried out nitrification at the later stage of soil reduction (SO42− reduction and methanogenic). Regression models of PNR varied positively with Fe2+ and crenarchaeal population. Derivation of regression models with different soil types would provide a better prediction model for the PNR. Polymerase chain reaction defined the type and magnitude of relation among the variables. The results of the current study confirmed that nitrification in flooded soil ecosystems is a complex phenomenon, which is carried out by both nitrifying bacteria and archaea. Based on the results a hypothetical pathway is illustrated to depict the nitrification carried out by the nitrifying bacteria and nitrifying archaea in flooded soil ecosystem (Fig. 8). Dissolved oxygen concentration in the slurries as well as in the headspace of the microcosms varies with redox metabolism. For example, the oxygen level or the extent of anaerobiosis (redox potential or Eh) is higher in the later phase than the early phases of reduction. This could be the major factor that influenced nitrification. It is concluded that bacteria modulate nitrification during the early phase of soil reduction while archaea steer nitrification at the later stages of redox metabolism in vertisols.

Fig. 8. Nitrification pathways in the flooded soil ecosystem. Nitrification occurs aerobically in presence of O2 as the electron (e−) acceptor. Aerobic nitrification takes place in the oxic compartments of soil. In anaerobic soil, the anoxic compartments including microaggregates serve as sites for anaerobic NH4 oxidation. It is hypothesized that slurries undergoing Fe3+ reducing phase likely stimulate nitrification by coupling NH4 oxidation with Fe3+ reduction. Colour online.
Conclusion
Nitrification in flooded soil is a complex process governed by different microbial groups and terminal electron acceptors. The current experiment highlighted that nitrification is stimulated during reduction of NO3−and Fe3+ and inhibited during SO42− reduction and methanogenic phases. Multiple regression analysis predicted nitrification from the rates of redox metabolic processes. Thus, at the time of overlapping of NO3−/Fe3+ reduction and Fe3+/ SO42− reduction, nitrification proceeded in a forward direction. The Fe3+ reducing slurries enhanced nitrification. According to the results of the present study, it is predicted that slurries at the Fe3+ reducing phase have Fe3+ reduction dependent nitrification and probably both aerobic and anaerobic nitrification stimulate the net nitrification activity. This needs to be investigated further. The current study also revealed that nitrification in the flooded soil is likely to be driven by both AOB and AOA. Both actively nitrify during NO3− reduction and Fe3+ reduction. Archaea regulated nitrification at SO42− reduction and the methanogenic phase. However, the complex microbial interaction needs to be verified in other soil types. It is predicted that climate change is likely to increase atmospheric temperatures in the near future. This may lead to intensive precipitation in many areas in the tropics. Large upland areas will remain submerged depending on the precipitation intensity, which would create anoxic-oxic fluctuations in soils. Based on the current study, anoxic–oxic conditions are likely to enhance nitrification in tropical vertisols. High nitrification may aggravate N loss through N2O emission or leaching. This may complicate the problems affecting agriculture, climate and environment. Further studies are essential to exhibit the complex interaction between oxygen reduction metabolism and nitrification in agricultural field to better predict the N dynamics and influence on the ecosystem.
Acknowledgements
This manuscript is part of the project ‘Archaea and Actinobacteria in Vertisol of Central India – Diversity, Biogeochemical Processes and Bioinoculants’ funded by ICAR-AMAAS.
Conflict of interest
None.