


Introduction
Wheat (Triticum aestivum L.) is an important cereal crop in South Asia (FAO, 2017): it is grown extensively in the Indo-Gangetic plains (IGP) region, mainly under rice-wheat cropping systems, covering an area of ~12 m ha in India (Chauhan et al., Reference Chauhan, Mahajan, Sardana, Timsina and Jat2012). The IGP region contributes 0.15 of world wheat production (Bita and Gerats, Reference Bita and Gerats2013). By the year 2050, wheat production in developing countries must be increased by 77% if it is to meet rising demand (Sharma et al., Reference Sharma, Tyagi, Singh, Venkatesh and Gupta2015). However, the sensitivity of wheat to abiotic stress is a major hindrance in realizing its potential productivity (Gupta et al., Reference Gupta, Agarwal, Agarwal, Nathawat, Gupta and Singh2013; Asseng et al., Reference Asseng, Ewert, Martre, Rötter, Lobell, Cammarano, Kimball, Ottman, Wall, White, Reynolds, Alderman, Prasad, Aggarwal, Anothai, Basso, Biernath, Challinor, De Sanctis, Doltra, Fereres, Garcia-Vila, Gayler, Hoogenboom, Hunt, Izaurralde, Jabloun, Jones, Kersebaum, Koehler, Müller, Naresh Kumar, Nendel, O'Leary, Olesen, Palosuo, Priesack, Eyshi Rezaei, Ruane, Semenov, Shcherbak, Stöckle, Stratonovitch, Streck, Supit, Tao, Thorburn, Waha, Wang, Wallach, Wolf, Zhao and Zhu2015; Flohr et al., Reference Flohr, Hunt, Kirkegaard and Evans2017). According to Joshi et al. (Reference Joshi, Mishra, Chatrath, Ortiz Ferrara and Singh2007a) a large part of the rice-wheat growing area of south Asia is considered to be under heat-stress. Particularly in the eastern IGP region, a considerable wheat-growing area is heat-stressed due to delayed sowing of wheat, mainly because of the late harvest of long-duration rice cultivars (Joshi et al., Reference Joshi, Chand, Arun, Singh and Ortiz2007b). The wheat crop is very susceptible to high temperatures, especially during the reproductive stage (Wang et al., Reference Wang, Li, Sun and Yao2016). Studies have already quantified wheat yield losses up to 20% for South Asia and the eastern Gangetic plains (Aggarwal et al., Reference Aggarwal, Kumar and Pathak2010; Mondal et al., Reference Mondal, Singh, Crossa, Huerta-Espino, Sharma, Chatrath, Singh, Sohu, Mavi, Sukuru, Kalappanavar, Mishra, Hussain, Gautam, Uddin, Barma, Hakim and Joshi2013). Besides this, growing of long-duration wheat cultivars and its delayed sowing have made the phenomena of yield drop the norm rather than the exception due to terminal heat stress in the eastern IGP region.
Wheat is a temperate crop and requires a specific range of temperatures for optimum physiological function (Porter and Gawith, Reference Porter and Gawith1999). Late-sown wheat crops face terminal high-temperature stress during the period from anthesis to grain-filling (Pandey et al., Reference Pandey, Mamrutha, Tiwari, Sareen, Bhatia, Siwach, Tiwari and Sharma2015; Dwivedi et al., Reference Dwivedi, Basu, Kumar, Kumar, Prakash, Kumar, Mishra, Bhatt, Malviya, Singh and Arora2017). The major responses of wheat to heat stress include increased leaf senescence, reduction of photosynthesis, deactivation of photosynthetic enzymes and generation of oxidative damage to chloroplasts. Heat stress reduces grain number and size by affecting grain setting and translocation of assimilate to the grains (Ghaffari et al., Reference Ghaffari, Wahid, Saleem and Zia-ur-Rehman2015; Akter and Islam, Reference Akter and Islam2017). It is estimated that wheat yield decreases by 4% for every 1 °C rise in temperature above the optimum temperature of about 20 °C during anthesis to grain filling stage (Asseng et al., Reference Asseng, Ewert, Martre, Rötter, Lobell, Cammarano, Kimball, Ottman, Wall, White, Reynolds, Alderman, Prasad, Aggarwal, Anothai, Basso, Biernath, Challinor, De Sanctis, Doltra, Fereres, Garcia-Vila, Gayler, Hoogenboom, Hunt, Izaurralde, Jabloun, Jones, Kersebaum, Koehler, Müller, Naresh Kumar, Nendel, O'Leary, Olesen, Palosuo, Priesack, Eyshi Rezaei, Ruane, Semenov, Shcherbak, Stöckle, Stratonovitch, Streck, Supit, Tao, Thorburn, Waha, Wang, Wallach, Wolf, Zhao and Zhu2015; Dwivedi et al., Reference Dwivedi, Kumar and Prakash2015). Therefore, an effective strategy which alleviates terminal heat stress in late-sown wheat and sustains its productivity is required urgently.
With regard to maintaining yield under terminal heat stress in wheat, breeding for heat-tolerant cultivars is now a priority. However, the timely availability of quality seeds of these speciality cultivars at farmers’ doorsteps is an issue. Besides this, it is anticipated that ambient temperature will rise further and may severely affect wheat production in the IGP region. Hence, an effective crop management strategy for popularly grown cultivars, alongside whatever strategies already exist in the region, may be another option to combat the low productivity of wheat facing terminal heat stress. Among the several crop management options available, exogenous application of some synthetic compounds, such as inorganic salts like calcium chloride (CaCl2) (Tan et al., Reference Tan, Meng, Brestic, Olsovska and Yang2011) and plant signalling molecules like arginine (Hassanein et al., Reference Hassanein, El-Khawas, Ibrahim, El-Bassiouny, Mostafa and Abd el-Monem2013; Shi and Chan, Reference Shi and Chan2014), have been reported to have a beneficial role in protecting the crop from high-temperature stress, provided they are applied at the correct dose and crop growth stage (GS). The central role of these compounds was reported to restore photosynthetic effectiveness, influence metabolism of reactive oxygen species, nitrogen assimilation (Naeem et al., Reference Naeem, Naeem, Ahmad, Ihsan, Ashraf, Hussain and Fahad2018) and alter plant response to stress via different physico-chemical pathways such as enhancement of endogenous polyamine contents (Hassanein et al., Reference Hassanein, El-Khawas, Ibrahim, El-Bassiouny, Mostafa and Abd el-Monem2013). However, no extensive studies to assess the efficacies of these compounds under field conditions have been conducted thus far (Wakchaure et al., Reference Wakchaure, Minhas, Ratnakumar and Choudhary2016) and hence their use requires further field-level validation. Moreover, standardizing the dose of these compounds and time of application may provide optimum results.
Therefore, an experiment was conducted to evaluate the efficacy of synthetic compounds to alleviate the negative impact of terminal heat stress in wheat crop under field conditions in eastern India (Sabour). The objectives of the study were: (i) to assess the effect of synthetic compounds, specifically the dose and time of application, on yield and yield attributes of late-sown wheat in eastern India facing terminal heat stress and (ii) to assess the effect of foliar application of synthetic compounds on the physiological functions of wheat, which are sensitive to terminal high temperature. Thus, the strategy tested may be revealed as an effective crop management option, which can be readily adopted by the farmers to ward off the harmful effects of terminal heat stress and enhance the productivity of late-sown wheat.
Materials and methods
Experimental site characteristics
The study was conducted in the eastern IGP region of India at Sabour, Bihar (25°50′N, 87°19′E, 46 m a.s.l.) under field conditions for three consecutive years (2013–2014 to 2015–2016). The experimental plots were under conventionally tilled rice-wheat cropping system. The soil was moderately well-drained, very deep, silty-loam in texture, mixed hyperthermic and belongs to Fluvisols (IUSS Working Group WRB, 2015), with pH 6.7, total exchangeable salt 0.26 ds/m and soil organic carbon 4.2 g/kg. The soil had 125.4, 18.1 and 119.0 kg/ha available nitrogen (N), available phosphorus (P) and available potassium (K), respectively. The climate of the region is sub-humid sub-tropical. Daily mean maximum and minimum temperatures and rainfall data during the crop seasons (Fig. 1) were obtained from the meteorological observatory at the research farm of the Bihar Agricultural University, Sabour.
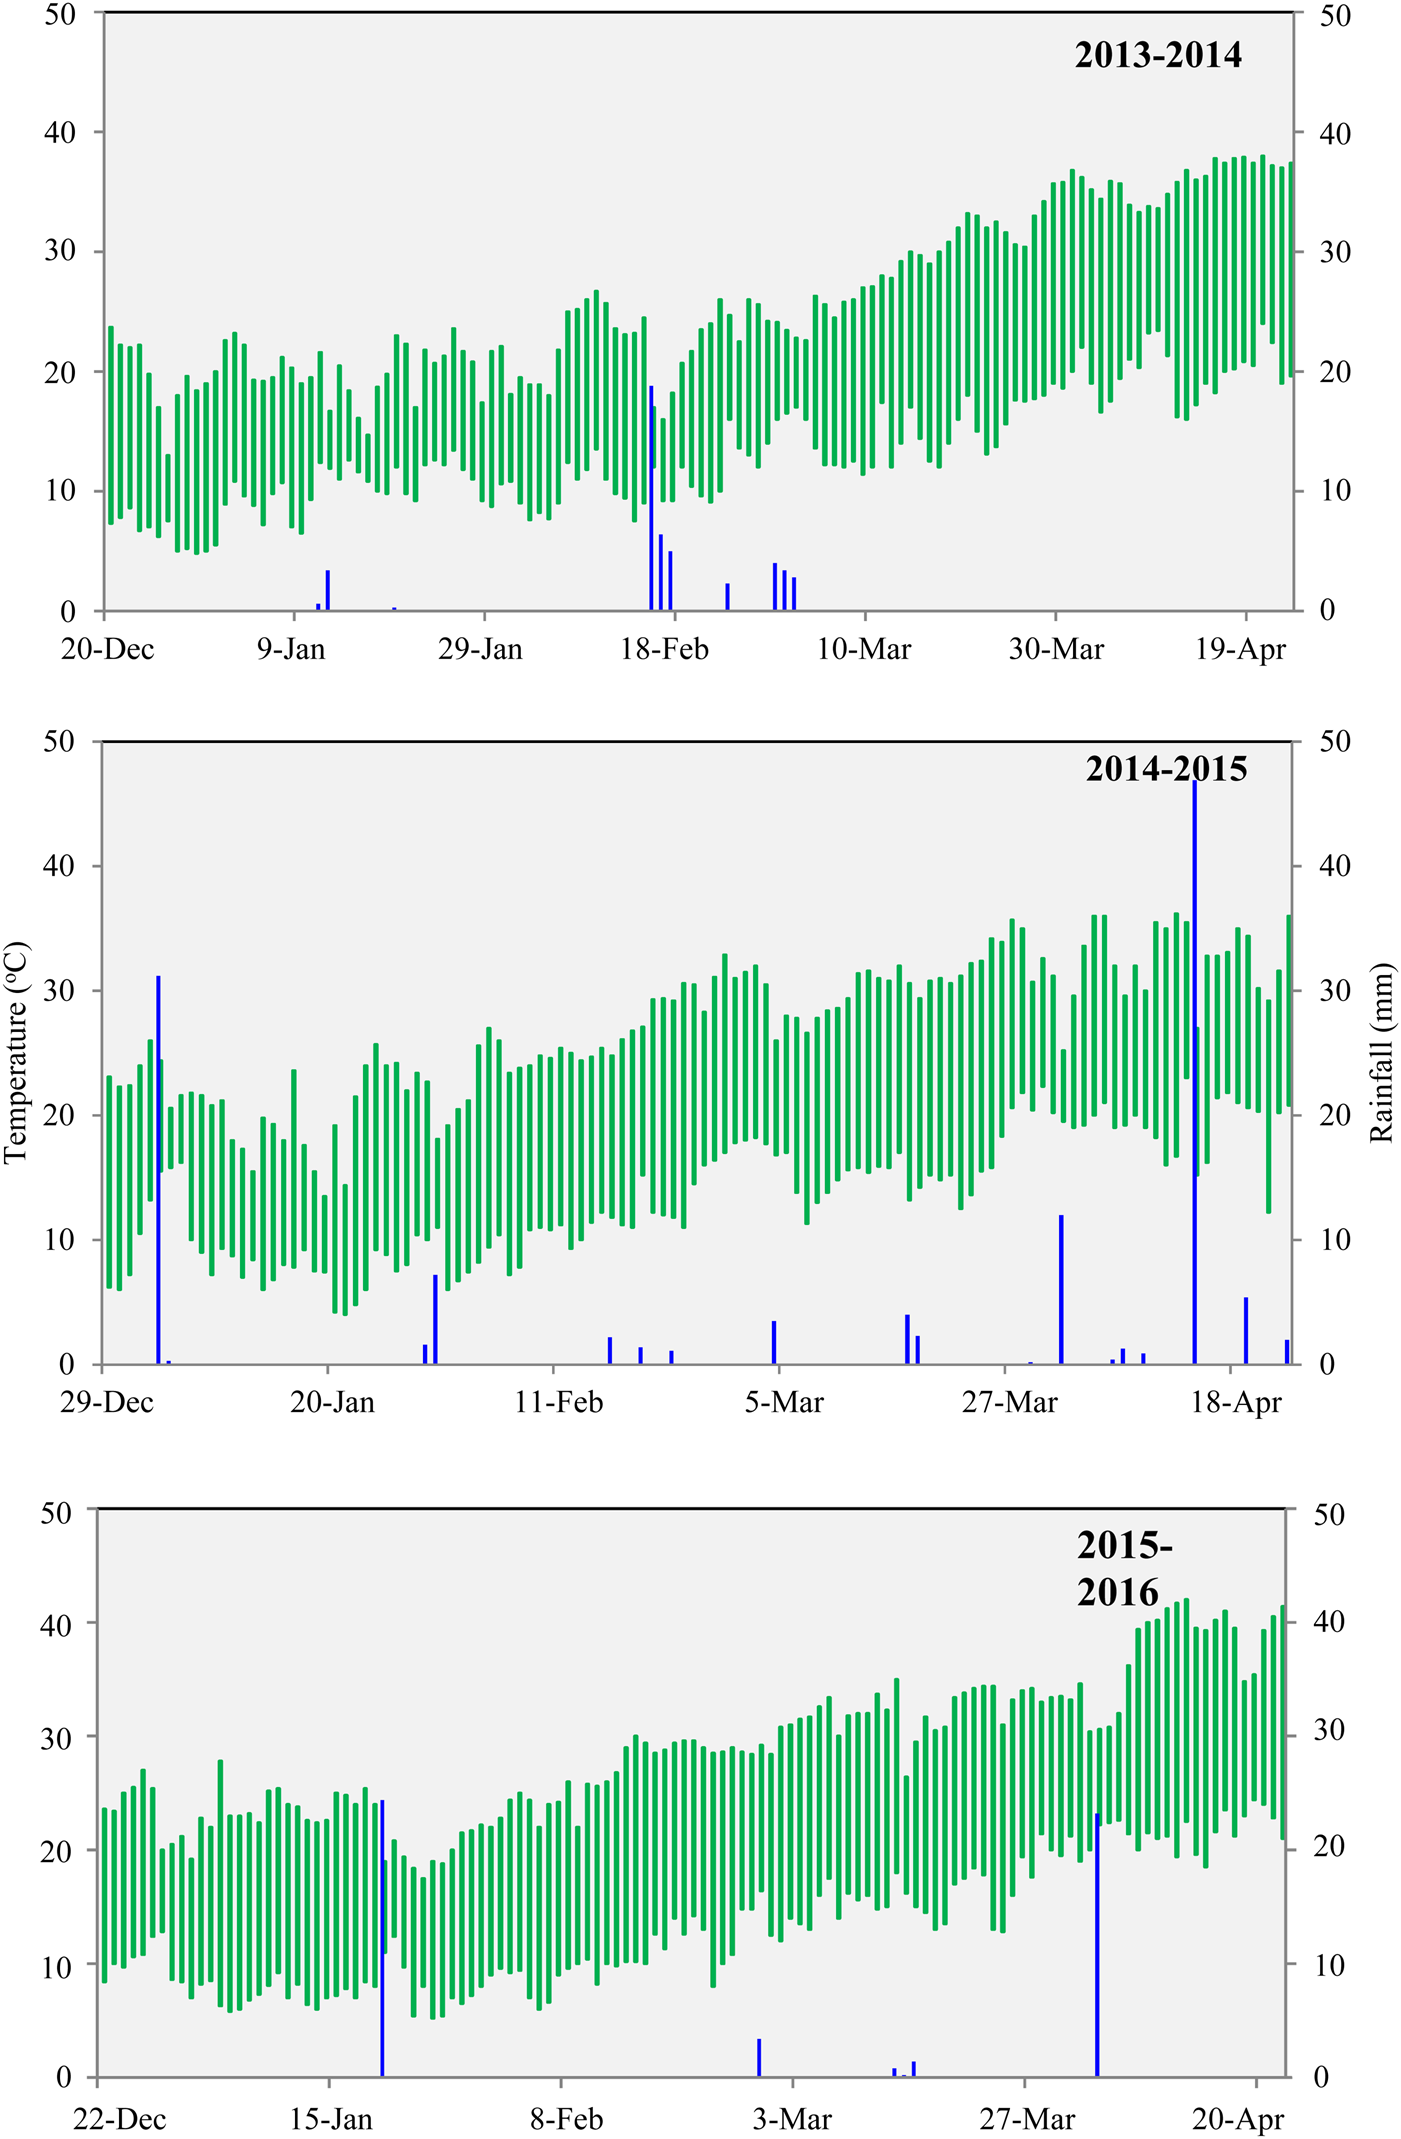
Fig. 1. The daily minimum and maximum temperature range (°C) and rainfall (mm) during the crop growing seasons (2013–2014 to 2015–2016).
Experimental detail
The experiment was laid out in a split-plot design replicated three times with a plot size of 2.5 × 4.0 m. The wheat crop was sown on 20, 29 and 22 December during 2013–2014, 2014–2015 and 2015–2016, respectively, which are considered as late-sown wheat in eastern IGP of India (Singh et al., Reference Singh, Singh, Baxla, Rathore, Singh, Dagar, Arunachalam and Shelat2015). Two wheat cultivars, viz., DBW 14 and K 307 and foliar application of synthetic compounds viz., CaCl2 and arginine were randomized in main plots and sub-plots, respectively. Treatments comprised of foliar spray of 0.2% CaCl2 at booting (CCB), 0.2% CaCl2 at anthesis (CCA), 0.1% CaCl2 at both booting and anthesis (CCB+A), 2.5 mM arginine at booting (ARGB), 2.5 mM arginine at anthesis (ARGA), 1.25 mM arginine at both booting and anthesis (ARGB+A), no-spray or spay control treatment (NSCT) and water-only spray at both booting and anthesis stages (WSB+A). In the current study, two different control treatments were investigated, i.e. no-spray or spay control treatment (NSCT) and water-only spray at both booting and anthesis stages (WSB+A) for precise assessment of the treatment effects. The ‘booting’ and ‘anthesis’ stages in wheat represent the GSs between 40 and 49, and 55 and 70, respectively (Zadoks et al., Reference Zadoks, Chang and Konaz1974). The crop duration for DBW 14 and K 307 is 115–120 days and 120–130 days, respectively. The treatment codes along with details of the treatments are tabulated in Table 1 and cultivar characteristics are presented in Table 2. Out of the two synthetic compounds, CaCl2 is an inorganic salt, acting as a secondary messenger to regulate plant response to stress (Hairat and Khurana, Reference Hairat and Khurana2015) and arginine is a multifunctional amino acid, governing stress adaptability of plants through the biosynthesis of polyamines (Nasibi et al., Reference Nasibi, Yaghoobib and Kalantari2011). Technical grades of CaCl2 (molecular weight 110.98 g/mol) and arginine (C6H14N4O2, molecular weight 174.204 g/mol) were used in the experiment. A manually operated knapsack sprayer fitted with flat fan nozzle, directed towards the flag-leaf of wheat, was used for foliar spraying of CaCl2 and arginine using a water volume of 200 l/ha.
Table 1. Treatment description and abbreviations used for different treatments

CaCl2, calcium chloride.
Table 2. Characteristics of the wheat cultivars used in the study

NEPZ, North Eastern Plain Zone; TGW, thousand-grain weight.
Crop management
A light pre-sowing irrigation (4000 m3/ha) was applied for land preparation. Plots were prepared by cultivating the field cross-wise four times with a tractor-drawn cultivator, followed each time by planking. Sowing of wheat was carried out by seed placement in shallow furrows opened using a hand-operated plough at 22.5 cm spacing using a seed rate of 125 kg/ha. Fertilizers were applied at the recommended rate of 120 kg N/ha, 40 kg phosphorus pentoxide (P2O5)/ha and 20 kg potassium oxide (K2O)/ha as urea, diammonium phosphate and muriate of potash, respectively. Half of the N and the full dose of P and K were applied as a basal dose while the remaining half dose of N was applied in two equal splits, one at first irrigation, 21 days after sowing (DAS), and the other at 60 DAS. The crop was well irrigated and five irrigations (each 6000 m3/ha) were applied at crown root initiation, tillering, late jointing, flowering and dough stages. The plots were kept weed-free by manual weeding. The crop was harvested on 8, 17 and 9 April in 2013–2014, 2014–2015 and 2015–2016, respectively.
Measurement of crop growth and yield attributes
Grain yield was measured after the crop attainted physiological maturity by harvesting and threshing the six inner rows of each plot, leaving 0.5 m at each end of the selected rows. Numbers of ears obtained in these six inner rows of each plot were converted to number of ear/m2. Prior to harvest, a random sub-sample of ten ear bearing culms were sampled from the inner six rows of the plots. Kernels from each of these ears were detached separately, counted and averaged to estimate grains/ear. Test weight (thousand-grain weight) was also estimated from these separated kernels by taking a sub-sample of 200 kernels, oven dried and weighed. A 100 g sample from the harvested grain was oven-dried at 65 °C for 48 h and grain moisture content (%) at harvest was estimated; finally, the grain yield of each plot was adjusted to 14% moisture content and expressed as t/ha.
Measurement of physiological parameters
Due to phenological differences between the two cultivars, DBW 14 and K 307, two approximate GSs were designated for the sampling of flag leaves and measuring physiological parameters like chlorophyll content and relative permeability. In wheat, ‘grain filling’ period represents the GS between GS 75 and 85 (Zadoks et al., Reference Zadoks, Chang and Konaz1974). Separate flag leaves from each plot were sampled for estimating chlorophyll content and relative permeability at 12:00 h. Chlorophyll content and relative permeability in each of these stages were estimated using the standard procedures described by Arnon (Reference Arnon1949) and Yang et al. (Reference Yang, Rhodes and Joly1996), respectively.
Flag leaf chlorophyll content
Flag leaves collected from each plot were kept at ~5 °C on moist filter paper, wrapped in aluminium foil and taken to the laboratory in an ice box. Six discs (11 mm diameter) were cut from each leaf; three were dried in a hot air oven at 65 °C for 48 h to estimate dry weight. Chlorophyll was extracted from the other three discs by crushing them in a mortar with 80% acetone–water solution (v/v) and a pinch of calcium carbonate. The extract was centrifuged at 3500 rpm for 7 min. The supernatant was made up to 5 ml with distilled water and absorbency was measured at 663 (A 663) and 645 (A 645) nm in an ultraviolet-visible spectrophotometer (model Shimadzu, Japan). Total chlorophyll was estimated using Harborne (Reference Harborne1973) equations.

Flag leaf relative permeability
Ten pieces (4 cm diameter) were cut from the middle section of flag leaves and placed in test tubes containing 10 ml of de-ionized water. After vigorous shaking for 10 s, the initial electrical conductivity (EC0) of each sample was measured using an electrical conductivity meter (Systronics digital conductivity meter 304, India). The samples were left for 24 h at room temperature, and conductivity (EC1) was measured again. The samples were autoclaved and then the final electrical conductivity (EC2) was estimated after cooling to 25 °C. The EC0 of the de-ionized water (blank) was subtracted from both EC1 and EC2. Heat injury of leaf tissues was measured in terms of relative permeability was calculated using the formula of Yang et al., as follows (Yang et al., Reference Yang, Rhodes and Joly1996):

Calculation of heat use efficiency (HUE)
Growing degree-days (GDD) were calculated from the date of sowing to harvesting of the crop using base-temperature of 0 °C (McMaster and Wilhelm, Reference McMaster and Wilhelm1997) and then summed up to estimate the cumulative GDD (°C days). Heat-use efficiency (HUE) was used to compare the relative performance of wheat crop under various treatments using the formula (Sastry et al., Reference Sastry, Charkravarty and Rajput1985)

Statistical analysis
Statistical analysis of the data was performed by applying the analysis of variance (ANOVA) technique of Split-plot design (Cochran and Cox, Reference Cochran and Cox1963), using the online statistical program OPSTAT (Sheoran et al., Reference Sheoran, Tonk, Kaushik, Hasija, Pannu, Hooda and Hasija1998). The significance of different sources of variations was tested by error mean square of Fisher Snedecor's ‘F’ test at probability level P = 0.05. The least significant difference (LSD) at 5% level of significance was worked out for each character to compare the difference between the treatment means. The principal component analysis (PCA) was performed using the window-based software PAST (version 3.14; Hammer et al., Reference Hammer, Harper and Ryan2001).
Results
Heat intensity at reproductive stage
In all 3 years of study (2013–2016), the wheat crop faced terminal heat stress of variable intensity. Terminal heat stress in wheat is characterized by exposure to supra-optimal temperature (above the optimal range of 12–22 °C) during anthesis to grain filling with increased frequencies and variable duration which hinders normal physiological activities of the crop (Farooq et al., Reference Farooq, Bramley, Palta and Siddique2011). Figure 2a illustrates that the appearance of pheno-phases in DBW 14 and K 307 was different and the anthesis time of DBW 14 was 7–10 days earlier than K 307. Meantime, the reproductive phase (anthesis to physiological maturity) of K 307 was comparatively extended over DBW 14. During the reproductive phase, average maximum temperatures were 28.3, 31.8 and 32.3 °C in 2013–2014, 2014–2015 and 2015–2016, respectively, for the cultivar DBW 14. Likewise, the corresponding values for cultivar K 307 were 31.9, 32.6 and 32.5 °C, respectively (Fig. 2b). Similarly, mean temperature during the reproductive phase of K 307 was higher than for DBW 14 (Fig. 2c). Total rainfall received during the crop seasons (i.e., late December to mid-April) of 2013–2014, 2014–2015 and 2015–2016 were 47, 124 and 53 mm, respectively.

Fig. 2. Temporal distribution of vegetative (green line) and reproductive phases (red line) of wheat crop during (2013–2016) (a). In each experimental year, the lower line represents the cultivar DBW 14 and the corresponding upper line represents the cultivar K 307. The box plots represent maximum (b) and minimum (c) temperatures faced by the cultivar DBW 14 and K 307 at the reproductive stage (anthesis to grain filling) during first, second and third year of the experiment. The lower whisker, green box, yellow box and upper whisker represent the first, second, third and fourth quartile range, respectively. The vertical line in between yellow and green box represents the mean value.
Flag leaf chlorophyll content
A significant reduction in flag leaf chlorophyll content was observed in both cultivars as the crop completed anthesis and approached the grain filling stage (Fig. 3). The effect of spray treatments on flag leaf chlorophyll content was prominent and significant at the grain filling stage. Treatment CCB+A maintained higher (18–23%, P < 0.05) flag leaf chlorophyll content over NSCT. The corresponding increases for treatments CCA and ARGB+A were 14–17% and 8–15% (P < 0.05), respectively. Results revealed that without any spray treatments (NSCT) the depletion of flag leaf chlorophyll content during anthesis to grain filling was 34, 37 and 35% for 2013–2014, 2014–2015 and 2015–2016, respectively. Application of chemicals reduced chlorophyll degradation over NSCT, being highest in CCB+A but followed closely by CCA and ARGB+A (Fig. 3). Pooled ANOVA results showed that chemical spray had a non-significant effect on chlorophyll content at the anthesis stage. However, a strong (P < 0.01) and consistent effect of chemical spray on flag leaf chlorophyll content at the grain filling stage was apparent. Meantime the interaction of cultivar × chemical spray was also found to be significant (P < 0.01) for chlorophyll degradation (Table 3).

Fig. 3. Flag leaf chlorophyll content (mg/kg) at anthesis and grain filling stages, and degradation of chlorophyll during anthesis to grain filling period (%) as influenced by different wheat cultivars and chemical spray treatments (2013–2014 to 2015–2016). Error bars represent ± standard error of mean. NS(CT), no-spray; CC(B), 18.0 mM CaCl2 at booting; CC(A), 18.0 mM CaCl2 at anthesis, CC(B + A), 9.0 mM CaCl2 at both booting and anthesis, ARG(B), 2.5 mM arginine at booting; ARG(A), 2.5 mM arginine at anthesis; ARG(B + A), 1.25 mM arginine at both booting and anthesis; WS(B + A), water-spray at both booting and anthesis.
Table 3. Pooled ANOVA of yield, yield attributing and physiological parameters (2013–2014 to 2015–2016)

ET, effective tillers; GPE, grains per ear; TGW, thousand-grain weight; RPGF, relative membrane permeability (grain filling); RPA, relative membrane permeability (anthesis); CHLA, chlorophyll content (anthesis); CHLGF, chlorophyll content (grain filling); CHDA-GF, chlorophyll degradation; ΔRPA-GF, change in relative membrane permeability (anthesis to grain filling).
*P < 0.05, **P < 0.01.
Relative membrane permeability of flag leaf
The effect of chemical spray on flag leaf relative membrane permeability was apparent in both cultivars at anthesis and grain filling stages (Fig. 4). At anthesis, 0.2% CaCl2 spray at the booting stage (CCB) reduced the relative permeability of flag leaves. At the grain filling stage, the effect of spray treatment was much more prominent on membrane permeability and also consistent during the study. Based on the 3-year mean data, the lowest value of relative permeability was registered for the treatment CCB+A (49%), followed by CCA (51%), ARGB+A (54%) and was maximum in NSCT (59%). Irrespective of cultivar, the increase in relative permeability from anthesis to grain filling in the no-spray treatment (NSCT) was 43% (3-year mean), decreasing in CCB+A (25%) and CCA (25%) treatments. Table 3 shows that cultivar × chemical spray interaction was significant for flag leaf relative permeability at anthesis (P < 0.05), grain filling (P < 0.05) and also for the percent increase in relative permeability from anthesis to grain filling (P < 0.01).

Fig. 4. Flag leaf relative permeability (%) at anthesis and grain filling stages, and increase in flag leaf relative permeability during anthesis to grain filling (%) as influenced by different chemical spray treatments (2013–2014 to 2015–2016). Error bars represent ± standard error of mean. NS(CT), no-spray; CC(B), 18.0 mM CaCl2 at booting; CC(A), 18.0 mM CaCl2 at anthesis, CC(B + A), 9.0 mM CaCl2 at both booting and anthesis, ARG(B), 2.5 mM arginine at booting; ARG(A), 2.5 mM arginine at anthesis; ARG(B + A), 1.25 mM arginine at both booting and anthesis; WS(B + A), water-spray at both booting and anthesis.
Yield attributes and grain yield
The treatment CCB+A increased the effective tiller, grains/ear and thousand grain weight by 6–9% (P < 0.05), 13–17% (P < 0.05) and 6–10% (P < 0.05) over spray control (NSCT) (Table 4). On the same line, the effect of CCA and ARGB+A was also significant (P < 0.05) and consistent over the years.
Table 4. Yield attributing parameters of wheat crop as influenced by different chemical spray treatments under late-sown condition

ET, effective tillers (nos/m2); GPE, grains/ear; TGW, thousand-grain weight (g); ns, non-significant (P > 0.05); s, significant (P ⩽ 0.05).
a See Table 1 for definitions of the abbreviations.
In parallel to the yield-attributing parameters, the grain yield of wheat was highest in the treatment CCB+A, which improved wheat grain yield by 13–18% over NSCT (P < 0.05) (Table 5). The corresponding increases in wheat grain yield for treatments CCA and ARGB+A were 8–14 and 8–12%, respectively. The foliar spray of CaCl2 or arginine at the booting stage only did not result in a significant yield increase in late-sown wheat. Pooled analysis ANOVA showed that the cultivar × chemical spray interaction was significant at P < 0.01 (Table 3).
Table 5. Grain yield of wheat (t/ha) as influenced by chemical spray treatments under late-sown condition of Eastern India

ns, non-significant (P > 0.05).
aSee Table 1 for definitions of the abbreviations.
Heat use efficiency and correlations
Foliar spray of the synthetic compounds increased HUE significantly (P < 0.05) (Fig. 5), with the highest HUE recorded in treatment CCB+A followed by CCA and then NSCT. The HUE of cultivar DBW 14 was higher (P < 0.05) than for cultivar K 307. A strong correlation between grain yield, plant yield attributes and physiological parameters was observed (Fig. 6). The correlation value (r) of grain yield with grains/ear, and thousand grain weight were 0.39–0.65 (P < 0.05) and 0.48–0.54 (P < 0.05), respectively. However, the correlation between grain yield and effective tillers was not significant. The correlations between grain yield and physiological attributes such as relative permeability and chlorophyll content of flag leaf at the grain filling stage were significant (P < 0.05) in all 3 years (Fig. 7). PCA revealed that chemical spray treatments had a variable effect on late shown wheat, which was primarily because of their impact on chlorophyll content in anthesis and grain filling, relative membrane permeability in grain filling stage, grains/ear and thousand-grain weight (Fig. 8).

Fig. 5. HUE (kg/ha/°C day) as influenced by different wheat cultivars and chemical spray treatments. NS(CT), no-spray; CC(B), 18.0 mM CaCl2 at booting; CC(A), 18.0 mM CaCl2 at anthesis, CC(B + A), 9.0 mM CaCl2 at both booting and anthesis, ARG(B), 2.5 mM arginine at booting; ARG(A), 2.5 mM arginine at anthesis; ARG(B + A), 1.25 mM arginine at both booting and anthesis; WS(B + A), water-spray at both booting and anthesis. Error bars represent ± standard error of means.

Fig. 6. Pearson correlation coefficient (r) between wheat grain yield and different plant growth, yield and physiological parameters during the experimental year 2013–2014 to 2015–2016. The dotted lines represent the critical (±) r value (P = 0.05, df = 46). ET, effective tillers; GPP, grains/panicle; TGW, thousand grain weight; RP(GF), relative permeability of flag leaf (grain filling); RP(A), relative permeability of flag leaf (anthesis); Chl(A), chlorophyll content (anthesis); Chl(GF), chlorophyll content (grain filling).

Fig. 7. Relationship between flag leaf relative permeability (RP) (grain filling) and chlorophyll content (Chl) (grain filling). Vertical and horizontal error bars represent ± standard error of means.

Fig. 8. Scatter plot of treatment combination on PCA coordinates based on all measures growth, yield and physiological parameters. C1, cultivar DBW 14; C2, cultivar K 307; ET, effective tillers; GPP, grains/panicle; TGW, thousand grain weight; RP(GF), relative membrane permeability of flag leaf at grain filling (%); RP(A), membrane permeability of flag leaf at anthesis (%); Chl(A), chlorophyll content (anthesis); Chl(GF), chlorophyll content (grain filling); CHLF, chlorophyll degradation during anthesis to grain filling (%); ΔRP change in membrane permeability of flag leaf during anthesis to grain filling (%).
Discussion
The current results showed that terminal heat stress in late-sown wheat crops in eastern IGP is the norm rather an exception. The maximum temperature during the grain filling period (anthesis to grain filling) was noticeably higher (>30 °C) for both cultivars investigated, while the mean average temperature during the crop season was 21–25 °C and 24–26 °C for cultivars DBW 14 and K 307, respectively. The optimum temperature for wheat during anthesis to grain filling has been reported as 20–21 °C by Porter and Gawith (Reference Porter and Gawith1999), while Dwivedi et al. (Reference Dwivedi, Basu, Kumar, Kumar, Prakash, Kumar, Mishra, Bhatt, Malviya, Singh and Arora2017) reported a wider range of 12–22 °C. The current results show that the wheat crop was exposed to a certain degree of supra-optimal temperature during its reproductive stage, commonly known as terminal heat stress. Obviously, this had a negative impact on the wheat crop physiology and yield (Farooq et al., Reference Farooq, Bramley, Palta and Siddique2011). In eastern IGP, wheat sown during mid-December is regarded as late-sown, which has been shown to expose the crop to temperatures 2.7 °C above the optimum during anthesis (Dwivedi et al., Reference Dwivedi, Basu, Kumar, Kumar, Prakash, Kumar, Mishra, Bhatt, Malviya, Singh and Arora2017). In the current study a comparable result was obtained, whereby wheat was sown during mid to late December and thus exposed to elevated temperatures, 4–5 °C above the optimum of around 20 °C, during the entire span of anthesis to grain filling.
The potential of synthetic compounds, especially CaCl2, in alleviating terminal-heat stress was very evident in the experiment. Among the different spray treatments, the highest improvement in grain yield was observed in the treatment CCB+A (>13%) closely followed by CCA. The positive effect of arginine was also apparently highest when sprayed at a concentration of 1.25 mM at both booting and anthesis stages (ARGB+A). In late-sown wheat of eastern IGP, 18–34% yield reduction has been reported when sowing is delayed from mid-December to the first week of January (Dwivedi et al., Reference Dwivedi, Basu, Kumar, Kumar, Prakash, Kumar, Mishra, Bhatt, Malviya, Singh and Arora2017). Therefore, the treatments CCB+A, CCA and ARG B+A, as apparent from the current study, could be a viable option to prevent yield drop in late-sown wheat, irrespective of variety, in eastern India. However, the current results demonstrated that the application of CaCl2 and arginine at the booting stage had low field efficacy in improving the grain yield of late-sown wheat crop. Hence, application of these chemicals at the booting stage, before the actual heat stress period, was not very effective. The increase in grain yield with application of CaCl2 and arginine was primarily attributed to increases in grains/ear and thousand-grain weight, which are sensitive to elevated temperatures (Farooq et al., Reference Farooq, Bramley, Palta and Siddique2011). Association between grain yield and these yield-attributing parameters was also confirmed by the higher correlation coefficients (r) values. This further indicates that terminal heat stress largely impacts sink formation and low source-sink translocation in the wheat crop, which was improved in the current study by the exogenous application of CaCl2 and arginine.
Although significant variation was observed in effective tillers with chemical spray treatment, no particular association was observed between grain yield and effective tillers. Notably, the effective tillers did not show any definite pattern of fluctuation in response to the application of CaCl2 and arginine, whereas the application of these compounds both at booting and anthesis (CCB+A and ARGB+A) contributed mainly towards higher grain yields. Therefore, the relationship between grain yield and effective tillers was non-significant.
Higher than optimum temperatures hinder normal physiological activities of plants in a myriad of processes. Photosynthesis is the physiological process most sensitive to elevated temperatures. The reduction in a net photosynthetic rate and crop yield is due mainly to impairment of chlorophyll biosynthesis, high-temperature-driven chlorophyll degradation, enhanced photorespiration and reduced transportability of photosynthates from source to sink (Dwivedi et al., Reference Dwivedi, Basu, Kumar, Kumar, Prakash, Kumar, Mishra, Bhatt, Malviya, Singh and Arora2017). Therefore, the protection of chlorophyll is of utmost importance to sustain yield under elevated temperatures. The flag leaf is regarded as the major contributor of photosynthates for developing grains. A positive correlation has been reported between yield and extended flag leaf photosynthesis (Borrill et al., Reference Borrill, Fahy, Smith and Uauy2015). Hence, delaying chlorophyll decay in flag leaves during the post-anthesis period is an effective strategy to retain uninterrupted supply of photosynthates to the developing grains under heat stress. The current results showed that during the period from anthesis to grain filling, chlorophyll in flag leaves was reduced from 5.01 to 3.23 mg/kg (34–37%) when no alleviation measure was taken. On the contrary, the decay of flag leaf chlorophyll was less intense under treatments CCB+A (5.19 to 3.89 mg/kg) and ARGB+A (5.15 to 3.59 mg/kg), and consequently improved grain yield of wheat substantially (by 8–10%). This proves the fact that foliar supplementation of CaCl2 and arginine at low concentrations both at booting and anthesis stages of wheat has a role in delaying chlorophyll degradation of the flag leaf under high temperature stress, though arginine had a less prominent effect under field conditions. Calcium (Ca+2) ions, exogenously supplemented through CaCl2 foliar spray, inhibit the loss of chlorophyll under heat stress, probably by reducing photo-oxidation via enhancing antioxidant enzyme activities, and also improve net photosynthetic rate under elevated temperatures by maintaining higher stomatal conductance (Tan et al., Reference Tan, Meng, Brestic, Olsovska and Yang2011). Arginine foliar spray, on the other hand, contributed towards the improvement of grain yield of wheat under stress by increasing contents of endogenous polyamines, as exogenously supplied arginine serves as a precursor of polyamines. Polyamines, under abiotic stress, protect plants through inhibition of ethylene evolution (Hassanein et al., Reference Hassanein, El-Khawas, Ibrahim, El-Bassiouny, Mostafa and Abd el-Monem2013) and delay senescence of actively photosynthesizing source organs. For both CaCl2 and arginine, it was apparent from the current results that split application of both chemicals had better efficacy in alleviating high temperature stress over single application at respectively higher concentration. This might be due to the fact that high temperature spells occurred under field conditions in a ‘staggered’ way, rather than in a single phase. So splitting application of the chemicals into lower concentrations before and after the crop passes its critical crop GSs, (i.e., before and after anthesis) might have imposed comparatively better results over a single application at a higher dose.
Electrolyte leakage is a fairly reliable indicator of high-temperature-induced membrane damage (Demidchik et al., Reference Demidchik, Straltsova, Medvedev, Pozhvanov, Sokolik and Yurin2014). It is measured in terms of electrical conductivity from tissues subjected to high temperature and serves as an estimate of heat stability of the cell membrane (Ibrahim and Quick, Reference Ibrahim and Quick2001). Cell membrane integrity of flag leaves is impaired as the crop advances from anthesis to grain filling stage in late-sown wheat crops and exhibited through higher relative permeability values. Indeed, a higher value of flag leaf relative permeability (33–47%) was noticed at anthesis as the ambient temperature at this stage was sufficiently high (19.6, 23.3 and 23.3 °C during the first, second and third year, respectively) over optimal. Therefore, application of CaCl2 and arginine (particularly in the treatments CCB+A, CCA and ARGB+A) substantially reduced the relative permeability. Therefore, to maintain membrane integrity, a split application of the chemicals at booting and anthesis is recommended. Calcium chloride exerts its beneficial role by reducing lipid peroxidation of cell membranes and increasing membrane integrity (Bhattacharjee, Reference Bhattacharjee2008), which is evidenced through reduction in relative membrane permeability values from anthesis to grain filling, thus imposing a higher degree of heat tolerance. Arginine also acts almost in the same way as CaCl2, through reducing lipid peroxidation of cell membranes under heat stress, via biosynthesis of polyamines. Polyamines, especially putrescine, modulate stress responses of plants by decreasing peroxidase, indoleacetic acid-oxidase and polyphenol oxidase and increasing catalase and superoxide dismutase activities (Khalil et al., Reference Khalil, El-Bassiouny, Hassanein, Mostafa, El-Khawas and Abd El-Monem2009). The current study further revealed that the effect of arginine on relative membrane permeability is marginal as compared to CaCl2. The correlation coefficient value indicates that an increase in the relative permeability value at the grain filling stage significantly affects the grain yield. The possible reason behind this is uninterrupted translocation of photosynthates to the developing grains is hampered by heat-induced membrane injury, as high temperature stress during grain filling promotes leaf senescence leading to decreased sugar reserves in plants (Farooq et al., Reference Farooq, Bramley, Palta and Siddique2011). Apart from the treatment effect, a strong association between flag leaf relative permeability and chlorophyll content was observed for all three years in the current study. It is due to the disruption of the integrity of thylakoid membranes, as these are most heat-labile cell structure, and associated loss of chlorophyll harboured by the thylakoids (Schreiber and Berry, Reference Schreiber and Berry1977). With an increase in heat at the terminal GS (anthesis to grain filling), HUE drops sharply. The higher values of HUE in CCB+A and ARGB+A were primarily attributed to the increase in grain yield over no spray treatment under late-sown conditions. The PCA graph also shows a parallel association of grain yield with flag leaf chlorophyll content at grain filling, thousand-grain weight and grains per ear.
Conclusions
Calcium chloride was revealed to have better efficacy, irrespective of variety, in the alleviation of terminal heat stress in late-sown wheat under field conditions than arginine foliar spray. The maximum improvement achieved in grain yield (13%) was obtained with split foliar application of 9 mM CaCl2 both at booting and anthesis stages. Multi-location trials across the IGP regions may further validate the results.
Acknowledgements
We are thankful to all the responsible field staff and laboratory technicians of the Bihar Agricultural University Sabour for supporting in implementation of field trials, data collection and assisting in laboratory analysis leading to the successful completion of this study.
Financial support
The authors are indebted to the Directorate of Research, Bihar Agricultural University Sabour, Bhagalpur for funding and providing infrastructural facilities.
Conflict of interest
The authors declare no conflict of interest.
Ethical standards
Not applicable.


