


Introduction
Nitrous oxide (N2O) is a potent greenhouse gas (GHG) with a global warming potential 265–298 times greater than carbon dioxide (CO2) (Wrage et al., Reference Wrage, Velthof, van Beusichem and Oenema2001). Atmospheric concentrations of N2O have increased substantially since 1750 and now exceed pre-industrial levels by 0.20 (IPCC, Reference Stocker, Qin, Plattner, Tignor, Allen, Boschung, Nauels, Xia, Bex and Midgley2013). Globally, agriculture is one of the most significant sources of N2O production, accounting for ~0.6 of N2O emissions in 2005 (Reay et al., Reference Reay, Davidson, Smith, Smith, Melillo, Dentener and Crutzen2012). In the context of increased demand for animal products and the intensification of agricultural ecosystems, there is an urgent need to understand the N2O mitigation potential of common agricultural practices.
In 2010, permanent grassland and meadows accounted for 0.92 of agricultural land use in Ireland, with the majority used as grazing for cows (CSO, 2016). The temperate climate supports a long grazing season for livestock (mainly cows, beef and sheep) which can run from February to November, with urine deposited throughout this period. Consequently, N2O emissions account for 0.36 of Irish agricultural emissions, which in turn comprise one-third of national GHG emissions (Duffy et al., Reference Duffy, Hanley, Hyde, O'Brien, Ponzi, Cotter and Black2014). Under the EU Climate and Energy Package, Ireland must reduce GHG emissions by 20% from 2013–2020, posing a considerable challenge to the agriculture sector (EPA, 2017).
The frequency of urine excretion for dairy cows is 8–12 times per day (Lantinga et al., Reference Lantiga, Keuning, Groenwold, Deenen, van der Meer, Unwin, Van Dijk and Enink1987), with an average urination volume of 1.5–3.5 litres, resulting in a total production of 12–42 litres of urine per day, with an estimated nitrogen (N) concentration of 6–15 g N/litre (Holmes, Reference Holmes1989). Cow urine can affect an area of 0.2–0.5 m2 (Hayes and Williams, Reference Haynes and Williams1993), with deposition potentially affecting herbage growth beyond the immediate cover area due to lateral uptake by roots (Whitehead, Reference Whitehead, Van der Meer, Ryden and Ennik1986). The amount of urine deposited also depends on the stocking rate and grazing rotation, as overlapping can occur (Dennis et al., Reference Dennis, Moir, Cameron, Hennessy and Richards2011). Depending on the diet and grazing regime of the cow, up to 0.70 of N in urine will be present as urea, with the remainder consisting of peptides and amino acids (Haynes and Williams, Reference Haynes and Williams1993). Intensively farmed dairy cows excrete 0.75–0.90 of N consumed in their diet in the form of dung and urine (van Vuuren and Meijs, Reference Van Vuuren, Meijs, Van Der Meer, Unwin, Van Dijk and Ennik1987; Whitehead, Reference Whitehead1995). An increase in soil N of between 20–80 g N/m2 can occur in urine patches (Oenema et al., Reference Oenema, Velthof, Yarnulki and Jarvis1997).
Following urine deposition in moist soils, the enzyme urease hydrolyses urea to produce ammonium (NH4+) (Jarvis and Pain, Reference Jarvis and Pain1990). Under aerobic conditions, NH4+ is subsequently converted to nitrate (NO3−) via nitrite (NO2−). Through denitrification, NO3− can be canonically reduced to N2O or N2, a process that generally occurs in water saturated soils where oxygen is depleted and bacteria use NO3− as an electron acceptor (Bolan et al., Reference Bolan, Saggar, Luo, Bhandral and Singh2004). Hydrolysis of urea to NH4+ also results in a rapid increase in pH of up to 3 units per day (van Groenigen et al., Reference van Groenigen, Kuikman, de Groot and Velthof2005) and subsequent nitrification of NH4+ to NO3− results in a decrease of pH over a period of ~2 weeks (Doak, Reference Doak1952). In general, between 0.001–0.038 of urine N is emitted as N2O (Oenema et al., Reference Oenema, Velthof, Yarnulki and Jarvis1997). In addition to N loss through N2O or N2 emissions, 0.04–0.44 of applied urine N may be lost due to ammonia (NH3) volatilization, which occurs at higher soil pH (Bussink and Oenema, Reference Bussink and Oenema1998).
The balance of nitrification and denitrification is influenced by changes in N availability. Clough et al. (Reference Clough, Sherlock, Mautner, Milligan, Wilson, Freeman and McEwan2003) found that a urine N concentration applied to soil at a rate of 1000 kg N/ha suppressed nitrification and proposed that inhibition was due to the accumulation of NH3/NH4+ (Malhi and McGill, Reference Malhi and McGill1982). Inhibition has subsequently been reported in other studies of soil N dynamics (van Groenigen et al., Reference van Groenigen, Kuikman, de Groot and Velthof2005), but the length of inhibition is variable (Baral et al., Reference Baral, Thomsen, Olesen and Petersen2014). Many studies do not observe inhibition of N2O fluxes or N transformation under high N input rates as they investigate changes over longer time periods with less intensive sampling following the initial N input (de Klein et al., Reference De Klein, Luo, Woodward, Styles, Wise, Lindsey and Cox2014). The extent of inhibition is also likely to vary between soil types due to a combination of contrasting soil textures, moisture, pH, temperature, oxygen and nutrient availability driving different N transformation rates (Parker and Schimel, Reference Parker and Schimel2011).
The objectives of the current study were to explicitly test the extent to which high urine N application inhibits nitrification/denitrification over the medium term (up to 80 days) and assess if nitrification to NO3− is inhibited by high concentrations of NH3/NH4+ and whether N losses are via NO2−. It was hypothesized that (i) high-urine N application rates would inhibit nitrification, resulting in reduced N2O production, (ii) high-urine N application rates would be associated with high-accumulated NH3/NH4+ and (iii) N transformation rates and N2O production would differ between different grassland soils.
Methods
Study sites
The current study was conducted using two soils collected from grassland sites in Johnstown Castle (JC), Co. Wexford, Ireland (52°18′01.7″N 6°30′10.8″W), and Moorepark (MP), Fermoy, Co. Cork, Ireland (52°09′27.4″N 8°14′40.4″W) in April 2014 (Table 1). Two grassland top soils (0–10 cm) were collected using a spade cleaned with ethanol. Soils were stored overnight in sealed bags. The soils were air dried for 1 week, sieved to 2 mm and mixed separately to form two homogeneous samples. Subsequent references to soil mass are expressed on a dry mass equivalent basis.
Table 1. Initial site and soil properties of JC and MP soils for soils 0–10 cm
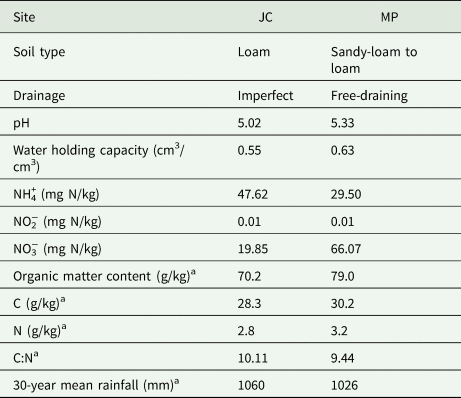
NH4+, ammonium; NO2−, nitrite; NO3−, nitrate; C, calcium; N, nitrogen.
a Additional site data from Harty et al. (Reference Harty, Forrestal, Watson, McGeough, Carolan, Elliot, Krol, Laughlin, Richards and Lanigan2016).
Experimental design
To investigate the effects of urine N application rates on nitrification and denitrification, fresh cow urine was collected from a dairy herd at the Johnstown Castle farm and analysed for N content. Urine N concentration was subsequently adjusted by adding urea or diluting urine accordingly to produce two urine concentrations for application rates equivalent to 300 and 1000 kg N/ha. These concentrations represent low-moderate and high-urine N application rates (Krol et al., Reference Krol, Carolan, Minet, McGeough, Watson, Forrestal, Lanigan and Richards2016; Minet et al., Reference Minet, Ledgard, Grant, Murphy, Krol, Lanigan, Luo and Richards2018). Deionized water was used as a control (0 kg N/ha).
Sieved soil (350 g) was placed into 24 replicate 1-litre acid-washed Kilner jars and packed to a depth of 4.5 cm. Soil was moistened with 59.68 and 89.88 ml of deionized water for JC and MP, respectively, and left for 5 days for acclimation. Then the cow urine treatments (47 ml for 1-litre jars and 9.54 ml for 0.1-litre jars) were pipetted across the soil surface ensuring equal distribution of urine which brought the moisture content to 0.7 cm3/cm3 water-filled pore space (WFPS). The urine application rate was equivalent to a moderate urine application volume of 6 litres/m2. The final weight of each jar was recorded and for the duration of the experiment, soils were maintained at 70 cm3/cm3 WFPS through weighing the jars and adding deionized water to maintain the moisture content. Water-filled pore space was calculated using the approach of Haney and Haney (Reference Haney and Haney2010) and following Eqn (1):

Concurrently, to assess the effects of addition on soil NH4+, NO2− and NO3− concentrations, 35 g soil was placed into 226 replicate 0.1-litre jars for destructive sampling at each time point. Soils were maintained at the same WFPS as the 1-litre jars.
Jars were arranged in a randomized block design in a temperature-controlled growth chamber maintained at 15 °C and 70% relative humidity for 80 days. Jars were left open when not being sampled to maintain aerobic conditions. Soils were monitored regularly and maintained at the initial soil water content by spraying deionized water onto the surface, returning to initial weight. Water spraying was carried out after N2O gas sampling to prevent rewetting affecting measured N2O fluxes.
Soil and gas sampling
Destructive soil sampling was carried out 1, 4, 7, 12, 15, 18, 21, 25, 28, 32, 35, 55, 63 and 80 days following urine addition to the 0.1-litre jars. Ammonium, total organic nitrogen (TON) and NO2− concentrations were determined following extraction with 185 ml 2 m potassium chloride (KCl; Mulvaney, Reference Mulvaney and Sparks1996) via colorimetric analysis (Aquakem 600A). Nitrate was calculated as TON minus NO2− concentration. A sub-sample of the KCl extract was allowed to return to room temperature (20 °C) and analysed for pH (1:5 ratio). Ammonium concentrations and pH were subsequently used to calculate concentrations of free NH3 (Watson et al., Reference Watson, Kilpatrick and Cooper1994; Smith et al., Reference Smith, Burns, Doyle, Lennox, Kelso, Foy and Stevens1997):

where [NH3] is the free NH3 concentration (mg N/kg), [NH4+] is the NH4+ concentration (mg N/kg), T is temperature (15 °C) and pH was measured using KCl extracts.
Headspace N2O concentrations were measured from the Kilner jars immediately after treatment and 3 h post-treatment on day 1, followed by daily sampling up to day 21 and thereafter ~5 days per week. On each sampling day, headspace gases were sampled between 14.00 and 17.00 h using a 20 ml syringe. The jars had a rubber seal on the lid ensuring an air tight seal. Headspace samples were collected immediately following lid closure and after 20 and 40 min through rubber septa. Two samples of air were measured to assess background N2O concentrations. Headspace gases were mixed twice before collection of a 10 ml sample, which was injected at overpressure into helium flushed and pre-evacuated 7 ml glass vials (Labco Ltd, UK). N2O concentration was analysed within 3 days using a Varian CP 3800 gas chromatograph (Agilent Inc., UK) equipped with a 63Ni electron capture detector and Combi-Pal auto-sampler (CTC Analysis, Switzerland). Daily atmospheric pressure was also recorded for N2O flux calculation. N2O fluxes were calculated assuming the linear accumulation of headspace gases and according to the ideal gas law (Hogg et al., Reference Hogg, Lieffers and Wein1992).
Statistical analysis
A two-way analysis of variance (ANOVA) was used to assess differences between the two grassland soils and the three treatments. Ammonium, NO2− and NO3− concentrations, and cumulative N2O fluxes were log10 transformed to meet test assumptions. A post-hoc Bonferroni test was used to test differences between treatments for cumulative N2O fluxes. Full ANOVA tables are presented in Tables 2 and 3. All statistical tests were carried out using Genstat v17.01. Figures were produced using GraphPad Prism v7.
Table 2. Results of two-way ANOVAs for pH, ammonium (NH4+), ammonia (NH3), nitrite (NO2−) and nitrate (NO3−) concentrations

Significance was assessed at P < 0.05.
Table 3. Results of two-way ANOVAs for cumulative N2O production

Significance was assessed at P < 0.05.
Results
Soil properties
The JC soil was a loam of imperfect drainage with a pH of 5.02, a water holding capacity of 0.55 cm3/cm3 and an initial NH4+ concentration of 47.62 mg N/kg (Table 1). The MP soil was a free draining sandy-loam to loam texture with a pH of 5.33, a water holding capacity of 0.63 cm3/cm3 and an NH4+ concentration of 29.5 mg N/kg. Both soils had low-nitrite concentrations ⩽0.01 mg N/kg. NO3− concentrations were greater in the MP soil compared to the JC soil.
Soil pH
Urine addition increased soil pH, with the magnitude of the change dependent on N concentration (P < 0.001, Fig. 1) and the 1000 kg N/ha addition associated with greatest increase. The pH varied significantly (P < 0.001) between soils, and was greater for MP soil (6.7) compared to JC soils (6.5). In addition, pH varied significantly over time (P < 0.001) and there was a significant (P < 0.001) difference in the interaction between treatments and time and between treatments, soils and time. On day 1, soil pH for both urine treatments and soils was similar with a mean pH of 7.5 and 7.6 for JC and MP urine treatments, respectively. For all treatments, pH peaked between day 4 and 7, followed by a steady and significant decrease over time. Between 55 and 80 days, differences in pH between treatments were minimal.

Fig. 1. The temporal effect of urine treatment on pH for (a) JC and (b) MP soils. Day 1 was sampled 1 h after urine treatment application. Means ± one s.e.. Note: error bars are included, but most are smaller than the symbols and therefore difficult to see.
Soil inorganic nitrogen
Ammonium concentrations varied significantly over time following urine application (P < 0.001, Figs 2(a) and (b)), and there were significant differences between treatments (P < 0.001), soils (P < 0.001) and for all levels of interaction (P < 0.001). Ammonium concentrations peaked on day 4 for both soils and treatments, with 753 and 1568 mg/kg for JC soils subject to 300 and 1000 kg N/ha treatments, whilst MP concentrations were 554 and 1565 mg/kg for the 300 and 1000 kg N/ha treatments, respectively. For both soils, NH4+ concentrations increased from day 4 to 12 and then decreased gradually up to day 80. Ammonium concentrations for JC soils were consistently higher than the MP soil throughout the experiment.

Fig. 2. Temporal trends in (a, b) ammonium (NH4+), (c, d) calculated ammonia (NH3), (e, f) nitrite (NO2−) and (g, h) nitrate (NO3−) concentrations for JC and MP soils following 0, 300 and 1000 kg N/ha urine addition. Day 1 was sampled 1 h after urine treatment application. Means ± one s.e..
Free NH3 concentrations (Figs 2(c) and (d)) calculated from NH4+ concentrations and pH exhibited similar temporal trends, with significant changes over time (P < 0.001), between treatments (P < 0.001), soils (P < 0.001) and for all levels of interaction (P < 0.001).
For both grassland soils, NO2− concentrations varied significantly over time following urine application (P < 0.001, Figs 2(e) and (f)) and varied significantly between treatments (P < 0.001) and for all levels of interaction (P < 0.001) except for between soils (P = 0.198). In general, NO2− concentrations were greatest for the 300 kg N/ha treatment and in MP soils compared to JC soils. Nitrite concentrations increased rapidly for both soils following 300 kg N/ha treatment from day 4 to 21, with gradual declines up to day 32. For the JC soil 1000 kg N/ha treatment, NO2− concentrations remained low up to day 35 of the experiment compared to the control, but began to increase from day 35, reaching a maximum of 1.33 mg/kg. For the MP soil, concentrations initially peaked at 2.00 mg/kg on day 4, returning to 0.38 mg/kg on day 7. Concentrations again peaked at 11.98 mg/kg on day 35 but declined to background concentrations by day 80.
For both grassland soils, NO3− concentrations also varied significantly over time (P < 0.001, Figs 2(g) and (h)), between treatments (P < 0.001), soils (P < 0.001) and for all levels of interaction (P < 0.001) except for between treatments and soils (P = 0.672). On day 1, NO3− concentrations in the controls were 19.85 and 66.07 mg/kg for JC and MP respectively, higher than both the 300 and 1000 kg N/ha treatments which were <13 mg/kg. The 1000 kg N/ha treatment remained low for the JC soil (<2.5 mg/kg) but increased to a peak of 324.35 mg/kg on day 55 before gradually decreasing. Nitrate concentrations for the MP soil 1000 kg N/ha treatment remained low (<1.75 mg/kg) until day 25 and then increased rapidly to a maximum of 467.80 mg/kg by day 55. The 300 kg N/ha treatment followed a similar pattern, with increases and peaks intermediate between the control and 1000 kg N/ha treatment. Nitrate concentrations were generally greater in MP soils compared to JC soils.
Nitrous oxide fluxes
N2O fluxes increased for all treatments following urine addition, with an initial peak in fluxes occurring on day 2 (Fig. 3). This peak was most pronounced for 300 kg N/ha treatment, particularly for the MP soil. Fluxes remained low until day 16 when they reached a maximum of 300 kg N/ha for the JC soil. Fluxes from 1000 kg N/ha started to increase from day 16 for both treatments, with the most rapid change occurring in the MP soil, which was followed by a gradual decline. In the JC soil, fluxes continued to increase until day 35. Cumulative fluxes, calculated as the net N2O emitted during 35 days incubation, varied significantly between treatments (P = 0.002, Fig. 4), soils (P = 0.009) and in the interaction term between treatments and soils (P = 0.013). Mean cumulative emissions were greatest from the 300 kg N/ha treatment, with the lowest fluxes (equivalent to 0.20–1.30 g N/ha) consistently occurring in the control treatments (0 kg N/ha). MP soils had higher cumulative fluxes across all treatments, with increasing N2O production with increasing urine N application rates, with greatest mean flux following the 1000 kg N/ha treatment. In contrast, JC soils had greatest N2O production during 35 day incubation under the 300 kg N/ha treatment.

Fig. 3. N2O fluxes over time following urine-N application for (a) JC and (b) MP soils. Day 1 was sampled 1 h after urine treatment application. Means ± one s.e..

Fig. 4. Cumulative N2O flux (a) per kg and (b) per/ha for JC and MP soils following 0, 300 and 1000 kg N/ha urine addition. Means ± one s.e.. Letters indicate significant differences from a post-hoc Bonferroni test.
Discussion
Soil nitrogen transformations
Following urea hydrolysis, pH in both soils increased, driving increased nitrification. In turn, changes in inorganic-N concentrations resulted in a subsequent decrease in pH (Doak, Reference Doak1952). While nitrification occurs within a narrow range of pH (6.6–8.0), with a significant decline below pH 5.5, the optimum pH for denitrification is 7–8 but can still occur at more acidic pH (Yamulki et al., Reference Yamulki, Harrison, Goulding and Webster1997).
In both soils, the 1000 kg N/ha treatment resulted in high NH4+ concentrations (1566 mg N/kg) on day 4, which subsequently stabilized at >400 mg N/kg. However, NO3− concentrations peaked at 325 and 468 mg N/kg, indicating a substantial missing pool of ~1100 mg N/kg. This pool was not accounted for by N2O emissions (130–960 mg N/kg). Part of this missing N was probably immobilized as soil microbial biomass (Silva et al., Reference Silva, Cameron, Di and Hendry1999) but may also have been stored as urea, emitted as NH3 (Bussink and Oenema, Reference Bussink and Oenema1998) or as N2. Previously, codenitrification, the production of a hybrid N2O/N2 molecule from nitric oxide (NO) or NO2− and a second from a co-substrate (including N3, NH3/NH4+) (Rex et al., Reference Rex, Clough, Richards, de Klein, Morales, Samad, Grant and Lanigan2018), has been proposed as the dominant driver of N2O/N2 fluxes in grassland soils (Selbie et al., Reference Selbie, Lanigan, Laughlin, Di, Moir, Cameron, Clough, Watson, Grant, Somers and Richards2015) and may account for the missing fraction. Chemodenitrification (abiotic nitrosation) is less likely, as this process is generally restricted to low pH (<5.2) (Clough et al., Reference Clough, Stevens, Laughlin, Sherlock and Cameron2001).
The formation of NO3− in the 1000 kg N/ha treatments for both soils was inhibited until after day 35. This either may have been caused by toxic levels of NH3/NH4+ (Clough et al., Reference Clough, Sherlock, Mautner, Milligan, Wilson, Freeman and McEwan2003) and/or increased levels of ammonium bicarbonate (NH4HCO3) driven by urea hydrolysis and nitrification (Malhi and McGill, Reference Malhi and McGill1982). The former mechanism is supported by calculated NH3 concentrations of ~730 mg N/kg across both soils for the 1000 kg N/ha treatment (Watson et al., Reference Watson, Kilpatrick and Cooper1994; Smith et al., Reference Smith, Burns, Doyle, Lennox, Kelso, Foy and Stevens1997). Clough et al. (Reference Clough, Sherlock, Mautner, Milligan, Wilson, Freeman and McEwan2003) found nitrification to be inhibited by a 1000 kg N/ha treatment, resulting in NO2− accumulation and subsequent N losses occurring as NO2−, rather than denitrification via NO3−. The gradual increase in NO2− by day 55 in the loam (JC) soil and the rapid increase in the sandy-loam (MP) soil would indicate the recovery of Nitrobacter and a resulting increase in nitrification rates. In contrast, the 300 kg N/ha treatment in both soils showed no inhibition as nitrification of NH4+ to NO3− occurred readily. Significantly higher concentrations of NO2− and NO3− accumulated in the sandy-loam in comparison with the loam soil for the 300 kg N/ha treatment, suggesting N loss or immobilization in the loam.
The initial N2O production between day 1 and 4 observed for all treatments, and in line with field observations by Krol et al. (Reference Krol, Carolan, Minet, McGeough, Watson, Forrestal, Lanigan and Richards2016), was most likely driven by utilization of native inorganic-N in the soil prior to urine application. N2O production at this point is likely to have been due to denitrification because of the addition of aqueous treatments, somewhat increasing soil WFPS (Linn and Doran, Reference Linn and Doran1984) and resulting in the formation of transient anaerobic microsites (Clough et al., Reference Clough, Sherlock, Mautner, Milligan, Wilson, Freeman and McEwan2003). Under the 300 kg N/ha treatment, nitrification to NO3− proceeded rapidly, with N2O production occurring as soon as NO3− became available. Although for the 1000 kg N/ha treatment NO3− levels in both soils remained very low up to day 55, NO3− concentrations for the sandy-loam (MP) soil began to increase from day 30 due to increasing concentrations of NO2−, albeit it at an impeded rate.
For the loam (JC) soil, the highest cumulative N2O emissions occurred for the 300 kg N/ha treatment over the 34-day experiment, which closely matched the lower end of annual N2O emissions from urine patches at the same application rate on the same soils (2.86 kg N/ha) (Krol et al., Reference Krol, Carolan, Minet, McGeough, Watson, Forrestal, Lanigan and Richards2016). At the end of the experiment, cumulative N2O fluxes from the 1000 kg N/ha treatment were increasing steadily and may have resulted in a greater flux than the 300 kg N/ha if the sampling had continued for 80 days. The 1000 kg N/ha treatment for the MP soil had a higher flux from day 20 than the 300 kg N/ha treatment resulting in significantly higher cumulative N2O emissions, suggesting nitrification and subsequent denitrification occurred at a faster rate in the sandy-loam (MP) soil. While NO2− concentrations increased by day 25, NO3− did not accumulate likely because it was denitrified as soon as it was produced (Davidson et al., Reference Davidson, Stark and Firestone1990).
Differences in nitrogen dynamics between grassland soils
N2O emissions from soils subjected to 0 kg N/ha were substantially higher for the sandy-loam (JC) soils, probably due to greater starting NO3− concentrations. Both soils demonstrated significant NH4+/NH3 inhibition at high-N addition rates, but subsequent N transformations varied significantly between soils. Differences in the extent of the inhibitory effect may partially be driven by temporary immobilization of N, which could reduce the accumulation of toxic levels of NH3 (Hansen and Bakken, Reference Hansen and Bakken1993; van Groenigen et al., Reference van Groenigen, Kuikman, de Groot and Velthof2005). Differences in N transformations between contrasting soil types have been reported extensively and are particularly important in the context of ecosystem scale fluxes of N2O and understanding the effects of different management practices (Li et al., Reference Li, Watson, Yan, Lalor, Rafique, Hyde, Lanigan, Richards, Holden and Humphreys2013). Moreover, emission factors for urine for both soils have previously been shown to be significantly different, ranging from 0.0009–0.0091, although these differences were largely ascribed to contrasting weather rather than inherent differences in soil properties (Krol et al., Reference Krol, Carolan, Minet, McGeough, Watson, Forrestal, Lanigan and Richards2016).
The N2O production potential has previously been found to be greater in loam compared to sandy soils (Maag and Vinther, Reference Maag and Vinther1996), with organic soils generally considered as more significant N2O sources than mineral soils (Duxbury et al., Reference Duxbury, Bouldin, Terry and Tate1982; Pihlatie et al., Reference Pihlatie, Syväsalo, Simojoki, Esala and Regina2004). Denitrification rates correlate significantly with the availability of labile carbon (McCarty and Bremner, Reference McCarty and Bremner1989), as denitrifiers are strict heterotrophs and use organic carbon as an electron donor (Groffman and Tiedje, Reference Groffman and Tiedje1989). In the current study, the sandy-loam (MP) had higher organic matter content and greater cumulative N2O fluxes than the loam (JC). Urine application can increase pH due to hydrolysis of organic matter, increasing both carbon and N turnover (Monaghan and Barraclough, Reference Monaghan and Barraclough1993; Selbie et al., Reference Selbie, Lanigan, Laughlin, Di, Moir, Cameron, Clough, Watson, Grant, Somers and Richards2015). Other differences between soils, such as P availability (Mehnaz and Dijkstra, Reference Mehnaz and Dijkstra2016) and soil structure (Li et al., Reference Li, Deng, Rensing and Zhu2014) have been suggested previously as significantly influencing N dynamics, particularly for in situ studies.
Conclusion
At higher rates of urine N addition, NH3/NH4+ toxicity or NH4HCO3 accumulation in the soil-inhibited nitrification and thereby reducing N2O emissions in the short term, although the extent varied between soil types. Prolonged inhibition of nitrification in the 1000 kg N/ha treatment may have resulted in increased NH3 volatilization, resulting in increased N loss. The significant differences in changes in N transformation between soil types may have been driven by differences in soil chemical properties, including carbon availability which can limit rates of denitrification. These findings are particularly important in understanding how N input rates can result in differences in N transformation in soils, and changes in net N2O production.
Acknowledgements
The authors would like to thank the laboratory staff at Teagasc Johnstown Castle for their assistance on this project. This work was supported by Teagasc.
Financial support
This research received no specific grant from any funding agency, commercial or not-for-profit sectors.
Conflicts of interest
The authors declare there are no conflicts of interest.
Ethical standards
Not applicable.


