


INTRODUCTION
Changing the milk fatty acid (FA) profile of dairy cows towards an increased proportion of unsaturated fatty acids (UFA) is considered an improvement of the dietary value of bovine milk (Jenkins & Bridges Reference Jenkins and Bridges2007). Milk FA are derived from two sources, viz., de novo synthesis from acetate and β-hydroxybutyrate originating from ruminal fermentation, and mammary uptake of FA available from absorption of dietary and microbial FA and FA from fat mobilization (Lock & Bauman Reference Lock and Bauman2004). FAs in the diet of dairy cows are mainly C18 FA from forages, cereals and oil seeds (Chilliard et al. Reference Chilliard, Glasser, Ferlay, Bernard, Rouel and Doreau2007). Oilseeds are used in diets of dairy cows to increase energy intake, increase efficiency of milk fat synthesis (Jones et al. Reference Jones, Mustafa, Christensen and Mckinnon2001), and alter the FA profile of milk fat. Feeding whole untreated sunflower seeds increases the proportion of UFA in milk fat from 0·29 to 0·42 (Petit et al. Reference Petit, Germiquet and Lebel2004), although extensive biohydrogenation normally occurs in the rumen (Harfoot & Hazlewood Reference Harfoot, Hazlewood, Hobson and Stewart1997). A reduction of this extensive biohydrogenation of UFA is required to increase the delivery of these UFA to the duodenum for absorption. The extent of biohydrogenation is affected by the technological form of the fat source (oil, seed, or protected; Chilliard et al. Reference Chilliard, Glasser, Ferlay, Bernard, Rouel and Doreau2007) and the characteristics of the basal diet (such as forage type and forage to concentrate ratio; Dewhurst et al. Reference Dewhurst, Shingfield, Lee and Scollan2006).
Fat sources for dairy cows differ in their FA profile and hence can result in changes in the profile of FA absorbed and secreted as part of the milk fat. Rapeseed sources contain oleic acid (cis-9-C18:1) as the most abundant FA, whereas soybean and sunflower sources are rich in linoleic acid (cis-9,cis-12-C18:2; C18:2n6), and linseed sources contain mainly linolenic acid (cis-9,cis-12,cis-15-C18:3; C18:3n3). Unprotected fat sources have only a limited use in dairy diets because they tend to upset fibrolytic activity and fibre digestion in the rumen (Harfoot & Hazlewood Reference Harfoot, Hazlewood, Hobson and Stewart1997). A number of studies and several reviews have been published on responses of milk FA profile to these fat sources when included in diets for dairy cows (Dewhurst et al. Reference Dewhurst, Shingfield, Lee and Scollan2006; Jenkins & Bridges Reference Jenkins and Bridges2007; Glasser et al. Reference Glasser, Ferlay and Chilliard2008). Glasser et al. (Reference Glasser, Ferlay and Chilliard2008) studied the responses of milk FA to several fat supplements and focused on the response to increasing amounts of the supplemental fat sources, but the effects of interfering dietary (e.g. technological form) or animal factors (e.g. lactation stage) were difficult to assess from their available dataset. In addition, Glasser et al. (Reference Glasser, Ferlay and Chilliard2008) excluded diets supplemented with fish oil or marine algae and combinations of fat sources including fish oil from the analysis. Due to the specific effects of fish oil on biohydrogenation routes (Shingfield et al. Reference Shingfield, Reynolds, Lupoli, Toivonen, Yurawecz, Delmonte, Griinari, Grandison and Beever2005; Fievez et al. Reference Fievez, Vlaeminck, Jenkins, Enjalbert and Doreau2007), the effects of addition of fish oil to diets supplemented with a fat source, such as rapeseed or linseed, are of interest. Consequently, the objective of the current meta-analysis was to study milk FA profile in response to changes in dietary FA composition in relation to different fat sources, their technological form and/or addition of fish oil, and characteristics of the basal diet (forage type and neutral detergent fibre (NDF) content).
MATERIALS AND METHODS
Data collection
A database was built from studies investigating the effects on milk FA profile in lactating dairy cows in response to different fat sources, with or without rumen lipid protection technology, with or without addition of fish oil, and supplied with different basal rations. Data were obtained from scientific publications published between 1995 and 2009 (listed in online appendix: go to http://journals.cambridge.org/AGS). A prerequisite for inclusion of an experiment in the database was that proportions of all the major feedstuffs in the diet, dietary ether extract (EE) or total FA content (g/kg dry matter (DM)), dietary NDF content (g/kg DM), dietary FA composition (g/kg DM), DM intake (kg/d), milk yield (kg/d), milk protein and milk fat yield (g/d), and FA profile of milk fat (g/100 g FA) were reported. Publications reporting several experiments were given a specific code for each experiment. This resulted in a database of 47 publications reporting 50 experiments with a total of 151 treatments (online Appendix: go to http://journals.cambridge.org/AGS). The experiments contained, on average, four experimental treatments (range 2–8) and each observation included in the dataset corresponded to the mean of a treatment group.
Animals, feeding and housing
All studies in the database used lactating dairy cows and each treatment group consisted of, on average, nine cows (±5 cows; means±s.d.), which were on average 110 days in milk (±54 days). Most experiments were conducted as Latin square designs with 21–28 day experimental periods. Duration of experiments set up as complete block designs was at least 6 weeks. Cows used in the experiments were Holstein cows, however, in the experiments of Franklin et al. (Reference Franklin, Martin, Baer, Schingoethe and Hippen1999), Whitlock et al. (Reference Whitlock, Schingoethe, Hippen, Kalscheur, Baer, Ramaswamy and Kasperson2002, Reference Whitlock, Schingoethe, AbuGhazaleh, Hippen and Kalscheur2006) and AbuGhazaleh & Jenkins (Reference AbuGhazaleh and Jenkins2004), Holsteins and Brown-Swiss cows were used. Cows in most experiments were multiparous or a mixture of primiparous and multiparous. Jones et al. (Reference Jones, Mustafa, Christensen and Mckinnon2001) and AbuGhazaleh et al. (Reference AbuGhazaleh, Schingoethe, Hippen, Kalscheur and Whitlock2002, Reference AbuGhazaleh, Schingoethe, Hippen and Kalscheur2003) used only primiparous cows in their experiments. Cows were housed individually in tie-stalls or housed in free-stall barns with Calan Broadbent feeding doors (American Calan Inc., Northwood, NH). Cows were fed individually either a total mixed ration (TMR) or a ration with haylage and concentrates fed separately (Loor et al. Reference Loor, Ferlay, Ollier, Ueda, Doreau and Chilliard2005).
Grouping of experimental factors
In most experiments, one treatment group received a control diet and the other treatment groups received the control diet plus a substantial amount of a fat source. The fat sources in the dataset were classed as: unsupplemented, rapeseed, soybean+sunflower, linseed and fish. Within fat sources, the technological form of the fat source, addition of fish oil and main forage type were distinguished. However, for fish oil as the main fat source, the number of treatment means was too low to be used in the analysis per fat source. For rapeseed, technological form was grouped as oil (all oil types included), seed (sources fed as whole seed, ground seed, heat treated seed, or extruded seed) and protected (sources fed as FA amides, or Ca-salts of FA). For soybean+sunflower sources, technological form was grouped as oil (all oil types included), seed (sources fed as whole seed, ground seed, heat treated seed, extruded seed, or micronized seed), protected (sources fed as FA amides or Ca-salts of FA) and added fish oil (additional supply of fish oil to a diet containing soybean or sunflower). For linseed, technological form was grouped as oil (all oil types included), seed (sources fed as whole seed, ground seed, extruded seed and micronized seed), protected (formaldehyde treated) and added fish oil. Main forage type in the diets was either lucerne silage, barley silage, maize silage, a combination of maize silage and haylage (maize/haylage), grass silage, or haylage. Haylage was defined as hay or haylage as termed in the ration compositions in the experiments. Unsupplemented diets contained barley silage, maize silage, maize/haylage, grass silage, or haylage as main forage type. For rapeseed sources, diets contained lucerne silage, barley silage, maize silage, or grass silage as main forage type. For soybean+sunflower sources, diets contained maize silage, maize/haylage, grass silage, or haylage as main forage type. For linseed sources, diets contained lucerne silage, maize silage, grass silage, or haylage as main forage type.
FA analysis methodology
Different FA analysis methods were used across the 47 publications. Differences among these methods would contribute to the experiment effect in the regression models developed. For many FA, the precise isomer description was not reported. FAs that were only described by C18:1 were assumed to be cis-9-C18:1, trans-C18:1 was assumed to be trans-11-C18:1, C18:2 was assumed to be C18:2n6 and C18:3 was assumed to be C18:3n3. Identification of specific C18:1 isomers was limited to publications reporting several cis- and trans-C18:1 isomers.
Statistics
Principal component analysis (PCA) was carried out using SPSS software (version 17; SPSS Inc., Chicago, IL) to evaluate the relationships within fat sources between milk FA profile (saturated FA (SFA), UFA, C18:0, cis-9-C18:1, trans-11-C18:1, C18:2n6 and C18:3n3), transfer efficiency for C18:2n6 and C18:3n3 from feed to milk, and diet characteristics (technological form of the fat source, main forage type, forage to concentrate ratio and dietary contents of NDF, total FA, UFA, cis-9-C18:1, C18:2n6 and C18:3n3 (DM basis)). The results of the PCA were represented graphically in two-dimensional plots, showing relationships among these variables. An example of the plot for the soybean and sunflower supplemented diets for principal component 1 v. 2 is presented in Fig. 1. Using the results of the PCA, independent variables that showed negative or positive relationships with the dependent variables were selected and with these variables multiple regression models were fitted.
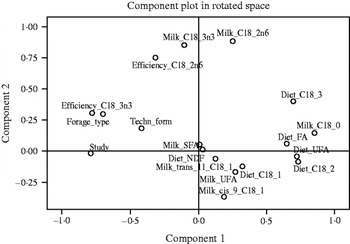
Fig. 1. PCA describing relationships among dietary variables and milk FA profile. The plot is based on the first two principal components (component 1: 0·44; component 2: 0·16).
The statistical methods used to adjust the data for the random effect of experiment and unequal variance among experiments have been described by St-Pierre (Reference St-Pierre2001). Dependent variables included milk fat content and milk FA profile (SFA, UFA, C18:0, cis-9-C18:1, trans-11-C18:1, C18:2n6 and C18:3n3) and transfer efficiencies for C18:2n6 and C18:3n3 from feed to milk. Independent continuous variables included the dietary contents of NDF, total FA, UFA, cis-9-C18:1, C18:2n6 and C18:3n3. Independent class variables included fat source, technological form and forage type. Multiple regression models were fitted using PROC MIXED (SAS Institute Inc., Cary, NC) with inclusion of both class variables and continuous variables within a mixed model analysis as described by Firkins et al. (Reference Firkins, Eastridge, St-Pierre and Noftsger2001) and St-Pierre (Reference St-Pierre2001). Variables were included in the models when P<0·10. In the first models, fat source was used as fixed-effect class variable, while the dietary FA contents were used as the fixed-effect continuous variables and experiment was the random-effect variable. The regression models were weighted for the unequal variance among studies using the milk C18:0 standard error of the mean (s.e.m.) reported in the experiments. In the second analysis, within fat source classes, technological form and main forage type were used as the fixed-effect class variables in the model. Non-significant (P>0·10) main effects remained in the model when they were contained in an interaction effect. Assessment of the best fit model was conducted by calculation of the root mean square prediction error (RMSPE) (Bibby & Toutenburg Reference Bibby and Toutenburg1977). Expressed as a proportion of the observed mean, the RMSPE was used as a measure for accuracy of prediction. The MSPE was decomposed into three error components according to Bibby & Toutenburg (Reference Bibby and Toutenburg1977) and all developed models showed the random error to be the most important source of error. The concordance correlation coefficient (CCC) was calculated to evaluate the precision and accuracy of predicted values (Lin Reference Lin1989). The best fit model was chosen based on the lowest RMSPE, highest CCC value and biologically logical intercepts and coefficients. The presented models per fat source contain seed as technological form or maize silage as main forage type when technological form or main forage type, respectively, were used as class variables in the regression models. Regression intercepts and slopes were adjusted for other technological forms or forage types, respectively, when the effects of these class variables (main effect: adjustment of intercept, interaction: adjustment of slope) were significant (P<0·10). Least squares means for different fat sources, technological form including added fish oil and main forage type in the diet were calculated from the best fit models and were adjusted for the random experiment effect and the means of all continuous variables in the final models. Pairwise differences were tested using the Tukey adjustment.
RESULTS AND DISCUSSION
Meta-analysis approach
The animal and diet characteristics and performance variables for the dataset are summarized in Table 1, whereas the milk FA profile including transfer efficiencies for C18:2n6 and C18:3n3 is presented in Table 2. Despite the large number of studies evaluating the response of milk FA to several fat sources, it was difficult to obtain a large and solid database with results for different fat sources, technological forms and diet compositions. To conduct a meta-analysis with these factors, a database containing diet characteristics as well as FA intake and specified milk FA profiles is required. Glasser et al. (Reference Glasser, Ferlay and Chilliard2008) pooled several forms of fat supplementation to quantify relationships on milk FA profile. In the current meta-analysis, the number of publications that met the selection criteria was limited and therefore it was necessary to pool technological form to the four classes used (oil, seed, protected and added fish oil) and main forage type to the six classes used (lucerne silage, barley silage, maize silage, grass silage, maize/haylage and haylage). Using the multiple regression technique, taking into account the random effect of experiment and unequal variances among experiments as applied previously for other research questions (Firkins et al. Reference Firkins, Eastridge, St-Pierre and Noftsger2001), it was possible to obtain models that upon application result in least squares means for technological form or main forage type within each fat source.
Table 1. Mean, standard deviation (s.d.) and number of treatments for animal characteristics, diet characteristics and performance for the total dataset (50 studies with 151 treatment means)

Table 2. Mean, s.d. and number of treatments for milk FA profile and transfer efficiency for cis-9,cis-12-C18:2 and cis-9,cis-12,cis-15-C18:3 for the total dataset (50 studies with 151 treatment means)
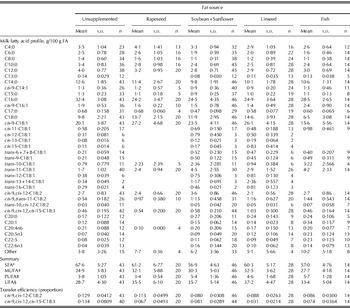
* SFA: Σ (C4:0, C6:0, C8:0, C10:0, C11:0, C12:0, C13:0, C14:0, C15:0, C16:0, C17:0, C18:0, C20:0).
† MUFA: Σ (cis-9-C14:1, cis-9-C16:1, cis-9-C18:1, cis-11-C18:1, cis-12-C18:1, cis-13-C18:1, cis-15-C18:1, trans-6+7+8-C18:1, trans-9-C18:1, trans-10-C18:1, trans-11-C18:1, trans-12-C18:1, trans-13+14-C18:1, trans-16-C18:1, C20:1).
‡ PUFA: Σ (cis-9,cis-12-C18:2, cis-9,trans-11-C18:2, trans-10,cis-12-C18:2, cis-9,cis-12,cis-15-C18:3, C20:4n6, C20:5n3, C22:5, C22:6n3).
§ UFA: Σ (MUFA, PUFA).
Fat sources
Table 3 presents the final models for the total dataset, standardized to diets not supplemented with a fat source. Fat source had a significant effect on milk fat content, selected milk FA proportions and efficiencies, except for milk UFA proportion. The intercepts in the final models therefore need to be adjusted for the different fat sources. In addition, the regression slope for the proportion of C18:3n3 in milk fat and the transfer efficiencies for C18:2n6 and C18:3n3 should also be adjusted for the different fat sources. The proportion of UFA in milk fat showed a quadratic response to increasing dietary UFA content, which was not affected by fat source. The relationship between observed and predicted UFA proportions and residuals (observed–predicted UFA) are presented in Fig. 2. Least squares means for milk fat content and FA proportions are presented in Table 4. Increasing dietary FA content reduced milk fat content resulting in lower least squares means for the diets supplemented with a source of rapeseed, soybean, sunflower and fish compared with the unsupplemented diets. However, diets supplemented with a source of linseed showed the highest fat content, in agreement with the observed changes in the milk FA profile as discussed later.
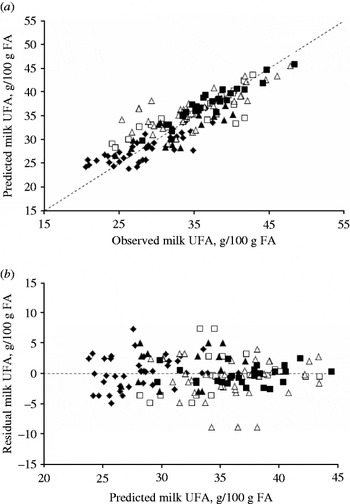
Fig. 2. Observed and predicted milk UFA proportion (a), and residuals (i.e. observed–predicted; b) for milk UFA proportion, adjusted for the random effect of experiment and weighted for unequal variance. Predicted milk UFA proportion (g/100 g FA): 17·80+0·72×UFA−0·006×UFA2 (RMSPE: 0·087 of observed mean; CCC: 0·859). Data are for unsupplemented (⧫), rapeseed (□), soybean+sunflower (△), linseed (▪) and fish (▲) sources.
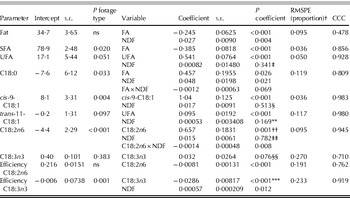
Table 3. Regression models to predict milk fat content (g/kg), proportions of milk SFA, UFA, C18:0, cis-9-C18:1, trans-11-C18:1, cis-9,cis-12-C18:2 (C18:2n6), and cis-9,cis-12,cis-15-C18:3 (C18:3n3; all in g/100 g), and transfer efficiencies from intake to milk for C18:2n6 and C18:3n3 (proportion) from dietary FA contents (g/kg DM) and responses to fat source standardized to diets not supplemented with a fat source*
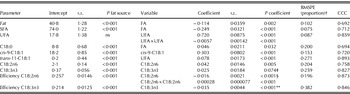
ns: not significant.
* Data are adjusted for the random effect of experiment and weighted for unequal variance. The equations are standardized for diets not supplemented with a fat source. Both intercept and coefficient would be adjusted for fat source. Class and continuous variables are included when P<0·10.
† RMSPE: root mean square prediction error as a proportion of the observed mean; CCC: concordance correlation coefficient.
‡ The interaction between fat source×C18:3n3 was P=0·010; estimates for rapeseed: intercept=0·43, slope=0·029; estimates for soybean+sunflower: intercept=0·40, slope=0·056; estimates for linseed: intercept=1·15, slope=–0·0033; estimates for fish: intercept=0·43, slope=0·0010.
§ The interaction between fat source×C18:2n6 was P=0·012; estimates for rapeseed: intercept=26·4, slope=–1·829; estimates for soybean+sunflower: intercept=29·0, slope=–1·617; estimates for linseed: intercept=17·9, slope=–1·070; estimates for fish: intercept=21·4, slope=–1·303.
** The interaction between fat source×C18:3n3 was P<0·001; estimates for rapeseed: intercept=10·2, slope=–1·294; estimates for soybean+sunflower: intercept=13·0, slope=–1·009; estimates for linseed: intercept=8·9, slope=–0·261; estimates for fish: intercept=16·4, slope=–2·301.
Table 4. Least squares means of milk fat content (g/kg) and proportions of milk SFA, UFA, C18:0, cis-9-C18:1, trans-11-C18:1, cis-9,cis-12-C18:2 (C18:2n6), and cis-9,cis-12,cis-15-C18:3 (C18:3n3; all in g/100 g) for Holstein cows fed unsupplemented diets or diet supplemented with different fat sources*

* All least squares means are adjusted for the random effect of experiment and for the mean of the continuous variables in the final models (see Table 2).
† Number of treatment means.
‡ Effect of fat source was not significant (ns) in the model (P>0·10).
The response in milk FA profile to lipid supplements integrates both rumen metabolism of substrates and post-absorptive metabolism of nutrients. In the current meta-analysis, higher least squares means of C18:0 were observed for diets supplemented with a source of rapeseed, soybean, sunflower and linseed. An increased proportion of C18:0 in milk fat can originate either from increased body fat mobilization, from increased C18:0 intake, or from dietary supplementation with cis-9-C18:1, C18:2n6, or C18:3n3, resulting in an increased rumen outflow of C18:0 due to complete biohydrogenation to C18:0 (Chilliard et al. Reference Chilliard, Glasser, Ferlay, Bernard, Rouel and Doreau2007). In the current meta-analysis, diets supplemented with fish oil showed the lowest C18:0 and highest trans-11-C18:1 proportions in milk fat. When fish oil or marine algae were included in the diet, a notable reduction in the conversion of trans-11-C18:1 to C18:0 in the rumen has been shown in vitro (Boeckaert et al. Reference Boeckaert, Vlaeminck, Mestdagh and Fievez2007; Vlaeminck et al. Reference Vlaeminck, Mengistu, Fievez, De Jonge and Dijkstra2008; Sterk et al. Reference Sterk, Hovenier, Vlaeminck, Van Vuuren, Hendriks and Dijkstra2010) or in vivo (Boeckaert et al. Reference Boeckaert, Vlaeminck, Fievez, Maignien, Dijkstra and Boon2008a), and markedly decreased and increased milk fat proportions of C18:0 and trans-11-C18:1, respectively (Boeckaert et al. Reference Boeckaert, Vlaeminck, Dijkstra, Issa-Zacharia, Van Nespen, Van Straalen and Fievez2008b). Several studies suggested that docosahexaenoic acid (C22:6n3; DHA) was responsible for the inhibitory effects on ruminal FA biohydrogenation (AbuGhazaleh & Jenkins Reference AbuGhazaleh and Jenkins2004; Boeckaert et al. Reference Boeckaert, Vlaeminck, Mestdagh and Fievez2007), which were modulated through changes in the rumen microbial population (Boeckaert et al. Reference Boeckaert, Vlaeminck, Fievez, Maignien, Dijkstra and Boon2008a).
In the current meta-analysis, supplementation of rapeseed, soybean or sunflower and linseed increased cis-9-C18:1 proportion. This is in agreement with the origin of cis-9-C18:1 in milk fat coming either directly from an increased uptake of cis-9-C18:1 or from desaturation of C18:0 in the mammary gland (Jacobs et al. Reference Jacobs, Van Baal, Smits, Taweel, Hendriks, Van Vuuren and Dijkstra2011). Thus, a decreased rumen outflow of C18:0 in diets containing fish oil (Shingfield et al. Reference Shingfield, Ahvenjärvi, Toivonen, Ärölä, Nurmela, Huhtanen and Griinari2003) or marine algae (Boeckaert et al. Reference Boeckaert, Vlaeminck, Fievez, Maignien, Dijkstra and Boon2008a) can reduce cis-9-C18:1 secretion, as confirmed in the current analysis. The proportion of C18:2n6 generally varies from 1·0–3·0 g/100 g FA (Chilliard et al. Reference Chilliard, Glasser, Ferlay, Bernard, Rouel and Doreau2007; Heck et al. Reference Heck, Van Valenberg, Dijkstra and Van Hooijdonk2009) and was significantly higher when diets were supplemented with a source of soybean or sunflower high in C18:2n6 compared with unsupplemented diets or diets supplemented with a source of rapeseed, linseed, or fish oil.
The proportion of C18:3n3 in milk fat for unsupplemented diets is generally 0·5 g/100 g FA (Heck et al. Reference Heck, Van Valenberg, Dijkstra and Van Hooijdonk2009) and can increase to c. 1·2 g/100 g FA when unprotected linseed is supplemented to the diet (Glasser et al. Reference Glasser, Ferlay and Chilliard2008). In the current meta-analysis, the unsupplemented diet showed a least squares mean of 0·55 g C18:3n3/100 g FA, whereas the linseed supplemented diets showed a least squares mean of 1·13 g C18:3n3/100 g FA. Least squares means for transfer efficiencies for C18:2n6 and C18:3n3 could not be determined, because they were calculated using the means of the continuous variables in the model according to Firkins et al. (Reference Firkins, Eastridge, St-Pierre and Noftsger2001). This resulted in negative transfer efficiencies for C18:2n6 and C18:3n3 due to the difference in dietary C18:2n6 and C18:3n3 contents among unsupplemented diets and diets supplemented with the fat sources. Transfer efficiencies for C18:2n6 and C18:3n3 decreased when the dietary contents of these FA increased.
Diet composition
Forage to concentrate ratio and the content of starch and available UFA are important factors regulating the extent of ruminal biohydrogenation (Palmquist et al. Reference Palmquist, Lock, Shingfield and Bauman2005; Dewhurst et al. Reference Dewhurst, Shingfield, Lee and Scollan2006; Sterk et al. Reference Sterk, Johansson, Taweel, Murphy, Van Vuuren, Hendriks and Dijkstra2011). In the current meta-analysis, variation in forage to concentrate ratio was small, with only a few treatments (n=10) with a proportion of concentrates higher than 0·60. Chilliard et al. (Reference Chilliard, Glasser, Ferlay, Bernard, Rouel and Doreau2007) concluded that the effect of increasing the proportion of concentrates in the diet depends on the range of increase, with a strong effect above 0·60 concentrates. In the current meta-analysis dietary NDF content (339±56 g/kg DM) rather than dietary forage proportion was used as the independent variable representing the fibrousness of the diet.
The dietary content of physical effective fibre required to stabilize rumen pH and maintain milk fat content depends on various other factors, including degradability of non-fibre carbohydrates (notably starch; Zebeli et al. Reference Zebeli, Dijkstra, Tafaj, Steingass, Ametaj and Drochner2008). Since rumen pH is an important factor in biohydrogenation processes in the rumen, such findings indicate that the effect of level of fibre may depend on the type of forage and the levels of easily degradable carbohydrates in the forage. Sterk et al. (Reference Sterk, Johansson, Taweel, Murphy, Van Vuuren, Hendriks and Dijkstra2011) showed that both forage to concentrate ratio and forage type influenced the effect of crushed linseed supplementation on milk FA profile.
Final models for unsupplemented diets are shown in Table 5. Regression intercepts and slopes are adjusted for main forage type to calculate the least squares means for milk fat content, milk FA and transfer efficiencies per main forage type (Table 6). Dietary FA content had a negative effect and dietary NDF content a positive effect on milk fat content, whereas the main forage type in the diet had no effect on milk fat content. The UFA proportion in milk fat was affected by the UFA and NDF content in the diet, whereas the effect of the NDF content depends on the main forage type in the diet. When the diet contained haylage or barley silage, NDF content had a negative effect on the UFA proportion in milk fat, whereas when the diet contained maize silage, maize silage in combination with haylage, or grass silage as the main forage type, NDF content had a positive effect on the UFA proportion in milk fat. However, no significant differences in the least squares means between the different main forage types were detected. The difference in effect of fibre on milk UFA proportion when the diet contains different forages might be related to the presence of C18:1 isomers in the UFA proportion. A lower fibre content is related to less complete biohydrogenation (Palmquist et al. Reference Palmquist, Lock, Shingfield and Bauman2005), which explains a higher UFA proportion in milk fat. However, the positive effect of NDF content on UFA proportion for diets containing maize silage, maize silage combined with haylage, or grass silage remains difficult to explain.
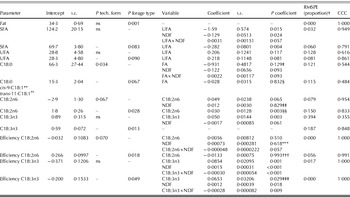
Table 5. Regression models to predict milk fat content (g/kg), proportions of milk SFA, UFA, C18:0, cis-9-C18:1, trans-11-C18:1, cis-9,cis-12-C18:2 (C18:2n6), and cis-9,cis-12,cis-15-C18:3 (C18:3n3; all in g/100 g), and transfer efficiencies from intake to milk for C18:2n6 and C18:3n3 (proportion) from diet characteristics (dietary FA and NDF contents; all in g/kg DM) and responses to forage type standardized to diets containing maize silage as main forage type for diets not supplemented with a fat source*
ns: not significant.
* Data are adjusted for the random effect of experiment and weighted for unequal variance. The equations are standardized for diets containing maize silage as the main forage type. Both intercept and coefficient would be adjusted for different forage types. Class and continuous variables are included when P<0·10.
† RMSPE: root mean square prediction error as a proportion of the observed mean; CCC: concordance correlation coefficient.
‡ The interaction between forage type×NDF was P=0·063; estimates for barley silage: intercept=25·7, slope=−0·0027; estimates for maize silage/haylage: intercept=13·6, slope=0·018; estimates for grass silage: intercept=3·7, slope=0·039; estimates for haylage: intercept=56·4, slope=−0·121.
§ The interaction between forage type×NDF was P=0·005; estimates for barley silage: intercept=19·42, slope=−0·010; estimates for maize silage/haylage: intercept=15·31, slope=−0·009; estimates for grass silage: intercept=0·75, slope=0·040; estimates for haylage: intercept=41·70, slope=–0·085.
** The interaction between forage type×NDF was P=0·056; estimates for barley silage: intercept=0·29, slope=−0·0014; estimates for maize silage/haylage: intercept=4·50, slope=−0·016; estimates for grass silage: intercept=0·33, slope=−0·0019; estimates for haylage: intercept=0·29, slope=–0·0014.
†† The interaction between forage type×C18:2n6 was P<0·001; estimates for barley silage: intercept=13·78, slope=−0·128; estimates for maize silage/haylage: intercept=3·35, slope=0·388; estimates for grass silage: intercept=−4·50, slope=0·704; estimates for haylage: intercept=4·30, slope=0·834.
‡‡ The interaction between forage type×NDF was P=0·008; estimates for barley silage: intercept=13·78, slope=−0·018; estimates for maize silage/haylage: intercept=3·35, slope=−0·002; estimates for grass silage: intercept=−4·50, slope=−0·013; estimates for haylage: intercept=4·30, slope=–0·018.
§§ The interaction between forage type×C18:3n3 was P=0·098; estimates for barley silage: intercept=0·73, slope=−0·194; estimates for maize silage/haylage: intercept=0·69, slope=−0·113; estimates for grass silage: intercept=0·51, slope=−0·007; estimates for haylage: intercept=0·68, slope=−0·033.
*** The interaction between forage type×C18:3n3 was P=0·006; estimates for barley silage: intercept=13·1, slope=−11·033; estimates for maize silage/haylage: intercept=14·6, slope=−8·602; estimates for grass silage: intercept=−6·0, slope=−1·849; estimates for haylage: intercept=21·6, slope=−11·033.
Table 6. Least squares means of milk fat content (g/kg), proportions of milk SFA, UFA, C18:0, cis-9-C18:1, trans-11-C18:1, cis-9,cis-12-C18:2 (C18:2n6), and cis-9,cis-12,cis-15-C18:3 (C18:3n3; all in g/100 g), and transfer efficiencies from intake to milk for C18:2n6 and C18:3n3 (proportion) for Holstein cows fed different fat sources with different technological forms, addition of fish oil, or main forage type in the diet*

ns: not significant.
* All least squares means are adjusted for the random effect of experiment and for the mean of all continuous variables remaining in the final models (see Tables 5, 7, 8 and 9).
† Number of treatment means.
‡ ne: not estimated in the model because of a limited number of treatment means.
§ Effect of technological form or forage type was not significant in the model (P>0·10).
The proportion of C18:0 in milk fat was affected positively by total FA and NDF content in the diet and negatively by the interaction between the total FA and NDF content. Forage type significantly (P=0·033) affected C18:0 proportion in milk fat, with the highest proportion achieved when the diet contained haylage compared with a combination of maize silage and haylage as the main forage type. Thus, the conclusion of Palmquist et al. (Reference Palmquist, Lock, Shingfield and Bauman2005) that complete biohydrogenation to C18:0 is most extensive when animals are fed diets containing high amounts of ensiled forages could not be confirmed in the current meta-analysis. Proportions of trans-11-C18:1 and C18:2n6 were higher for diets containing maize silage as the main forage type compared with those containing a combination of maize silage and haylage. Proportions of trans-11-C18:1 and C18:2n6 were affected differently by NDF and C18:2n6 content when the main forage type in the diet changed (Table 5). Proportion of C18:3n3 in milk fat was also affected differently by dietary C18:3n3 content when the main forage type in the diet changed, but no significant differences in the least squares means for the C18:3n3 proportion in milk fat could be determined (Tables 5 and 6). Kliem et al. (Reference Kliem, Morgan, Humphries, Shingfield and Givens2008) showed increased proportions of many trans isomers and C18:2n6 and a decreased proportion of C18:3n3 in milk for diets with increasing proportion of maize silage at the expense of grass silage. In contrast to the results of Kliem et al. (Reference Kliem, Morgan, Humphries, Shingfield and Givens2008), the current study showed only numerically increased proportions of trans-11-C18:1 and C18:2n6 and no differences in the proportion of C18:3n3 for diets containing maize silage compared with grass silage as the main forage type. In general, cows on hay-based diets can have a higher proportion of C18:3n3 in milk fat compared with grass silage based diet because of a higher transfer efficiency from diet to milk (Chilliard et al. Reference Chilliard, Glasser, Ferlay, Bernard, Rouel and Doreau2007). In this respect, Boufaïed et al. (Reference Boufaïed, Chouinard, Tremblay, Petit, Michaud and Bélanger2003) showed a higher ruminal bypass of C18:3n3 for Timothy hay compared with silage. In the current meta-analysis, only a numerical increase in transfer efficiency and proportion of C18:3n3 was observed for diets containing haylage as the main forage type compared with silages. Transfer efficiency for C18:3n3 decreased with increasing dietary C18:3n3 content influenced by main forage type and increased with increasing NDF content in the diet. Transfer efficiency for C18:2n6 was negatively affected by dietary C18:2n6 content and not influenced by main forage type.
Rapeseed
Final models for diets supplemented with rapeseed are shown in Table 7. Besides effects of the nutrient composition of the diet, the technological form of fat supplementation is known to have an effect on rumen metabolism and milk FA profile. However, rumen protected fats currently provide inconsistent and limited rumen protection responses (Jenkins & Bridges Reference Jenkins and Bridges2007). Analysing the response of milk FA to dietary FA and NDF contents for different technological forms of fat sources may help to explain the inconsistent responses between experiments.
Table 7. Regression models to predict milk fat content (g/kg), proportions of milk SFA, UFA, C18:0, cis-9-C18:1, trans-11-C18:1, cis-9,cis-12-C18:2 (C18:2n6), and cis-9,cis-12,cis-15-C18:3 (C18:3n3; all in g/100 g), and transfer efficiencies from intake to milk for C18:2n6 and C18:3n3 (proportion) from diet characteristics (dietary FA and NDF contents; all in g/kg DM) and responses to technological form standardized to seed, and forage type standardized to diets containing maize silage as main forage type for diets supplemented with rapeseed fat*
ns: not significant.
* Data are adjusted for the random effect of experiment and weighted for unequal variance. The equations are standardized for diets containing rapeseed as seed or containing maize silage as the main forage type. Both intercept and coefficient would be adjusted for different technological forms or forage types. Class and continuous variables are included when P<0·10.
† RMSPE: root mean square prediction error as a proportion of the observed mean; CCC: concordance correlation coefficient.
‡ The interaction between technological form×FA was P=0·032; estimates for oil: intercept=34·84, slope=–0·342; estimates for protected: intercept=70·50, slope=–1·063.
§ The interaction between forage type×FA was P=0·042; estimates for lucerne silage: intercept=1·30, slope=0·300; estimates for barley silage: intercept=19·32, slope=–0·175; estimates for grass silage: intercept=24·64, slope=–0·175.
** No significant model could be fitted.
†† No significant model could be fitted.
‡‡ The interaction between technological form×NDF was P=0·080; estimates for oil: intercept=3·78, slope=–0·007; estimates for protected: intercept=2·16, slope=–0·00005.
§§ The interaction between forage type×C18:2n6 was P=0·023; estimates for lucerne silage: intercept=1·89, slope=0·044; estimates for barley silage: intercept=–17·68, slope=2·138; estimates for grass silage: intercept=0·22, slope=0·135.
*** The interaction between technological form×NDF was P=0·061; estimates for oil: intercept=27·6, slope=–0·032; estimates for protected: intercept=17·3, slope=0·018.
††† The interaction between forage type×C18:2n6 was P=0·042; estimates for lucerne silage: intercept=18·9, slope=–0·725; estimates for barley silage: intercept=–5·7, slope=1·993; estimates for grass silage: intercept=3·3, slope=0·103.
‡‡‡ The interaction between forage type×diet C18:3n3 content was P=0·021; estimates for lucerne silage: intercept=–19·1, slope=6·550; estimates for barley silage: intercept=–101·2, slope=21·366; estimates for grass silage: intercept=–84·1, slope=14·620.
The proportion of UFA in milk fat was significantly increased by dietary UFA content, whereas the technological form of rapeseed did not affect the proportion of UFA in milk. Protected rapeseed showed a numerically higher transfer efficiency for C18:2n6 compared with rapeseed oil and a significantly (P=0·050) higher milk fat proportion of C18:2n6 compared with rapeseed fed as seed. The proportion of C18:2n6 increased with increasing dietary C18:2n6 content, whereas technological form interacted with NDF content, resulting in a positive relationship with NDF for rapeseed fed as seed and negative relationships with NDF for rapeseed oil and protected rapeseed. Two of the protected rapeseed treatments were oleamides and Loor et al. (Reference Loor, Herbein and Jenkins2002) concluded that oleamides showed a lower extent of biohydrogenation of cis-9-C18:1, but in the present meta-analysis none of the independent variables affected cis-9-C18:1 significantly. The proportion of C18:0 did not differ between different technological forms. However, the effect of dietary total FA content on milk fat C18:0 proportion was influenced by technological form with a stronger negative relationship when rapeseed was supplied as seed or as a protected source. Rapeseed sheaths appear to have a less protective effect than soybean or sunflower sheaths (Chilliard & Ferlay Reference Chilliard and Ferlay2004), which was confirmed by the numerically higher C18:0 content of rapeseed fed as seeds compared with oil. Fat content and proportions of SFA and C18:3n3 in milk fat and transfer efficiency for C18:3n3 were not affected by form of rapeseed supply.
Milk fat content was lower for diets containing barley silage as the main forage type compared with diets containing lucerne silage, maize silage, or grass silage as the main forage type. This might be related to differences in starch content and to the faster degradation of starch from barley compared with maize silage. Whether this was in agreement with a higher level of biohydrogenation intermediates (trans-11-C18:1) could not be modelled significantly. Transfer efficiency for C18:2n6 and milk fat proportion of C18:2n6 were significantly affected by main forage type in the diet. This resulted in higher transfer efficiency for C18:2n6 when the diet contained barley silage (P=0·068), lucerne silage, or maize silage compared with grass silage, and a higher C18:2n6 proportion in milk fat for barley silage compared with lucerne silage, maize silage or grass silage. In addition, proportion of C18:3n3 in milk fat was lower for barley silage-based diets compared with grass silage-based diets. The higher transfer efficiency for C18:2n6, higher milk fat proportion of C18:2n6 and lower milk fat proportion of C18:3n3 probably reflect the difference in FA composition of these forages with higher C18:2n6 proportions in barley silage and higher C18:3n3 proportions in grass silage. The relationship between C18:0 in milk fat and dietary FA content was significantly affected by main forage type, but this did not result in significant differences in milk C18:0 proportion between the main forage types in a diet supplemented with a source of rapeseed.
Soybean and sunflower
Final models for diets supplemented with soybean or sunflower are shown in Table 8. The proportion of UFA in milk fat was significantly increased with dietary UFA content, with a more pronounced effect when soybean or sunflower oil was used compared with a protected source. In addition, the dietary NDF content also affected milk UFA proportion showing different effects when technological form changed. The effect of dietary NDF content on milk UFA proportion was most negative when soybean or sunflower was fed as oil. In contrast, when soybean or sunflower were fed in a protected form, the effect of dietary NDF content on milk UFA proportion was positive. Fibre stimulates rumen biohydrogenation of free UFA (Harfoot & Hazlewood Reference Harfoot, Hazlewood, Hobson and Stewart1997), which explains the negative effect of NDF when fed as oil, but the reason for the positive effect of NDF when protected sources are fed remains unclear. However, the effects of technological form, including addition of fish oil, on the relationships with dietary UFA and NDF contents did not result in significant differences in milk UFA proportion (Table 6).
Table 8. Regression models to predict milk fat content (g/kg), proportions of milk SFA, UFA, C18:0, cis-9-C18:1, trans-11-C18:1, cis-9,cis-12-C18:2 (C18:2n6), and cis-9,cis-12,cis-15-C18:3 (C18:3n3; all in g/100 g), and transfer efficiencies from intake to milk for C18:2n6 and C18:3n3 (proportion) from diet characteristics (dietary FA and NDF contents; all in g/kg DM) and responses to technological form standardized to seed, and forage type standardized to diets containing maize silage as main forage type for diets supplemented with soybean or sunflower fat*
ns: not significant.
* Data are adjusted for the random effect of experiment and weighted for unequal variance. The equations are standardized for diets containing soybean and sunflower as seed or containing maize silage as the main forage type. Both intercept and coefficient would be adjusted for different technological forms or forage types. Class and continuous variables are included when P<0·10.
† RMSPE: root mean square prediction error as a proportion of the observed mean; CCC: concordance correlation coefficient.
‡ The interaction between technological form×UFA was P=0·087; estimates for oil: intercept=23·2, slope=1·133; estimates for protected: intercept=–59·2, slope=1·004; estimated for added fish oil: intercept=21·1, slope=0·272.
§ The interaction between technological form×NDF was P=0·054; estimates for oil: intercept=23·2, slope=–0·117; estimates for protected: intercept=–59·2, slope=0·212; estimated for added fish oil: intercept=21·1, slope=0·021.
** The interaction between technological form×FA was P=0·011; estimates for oil: intercept=13·57, slope=0·007; estimates for protected: intercept=6·99, slope=0·096; estimated for added fish oil: intercept=3·68, slope=0·125.
†† The interaction between forage type×NDF was P<0·001; estimates for maize silage/haylage: intercept=−48·58, slope=0·207; estimates for grass silage: intercept=−149·16, slope=0·521; estimates for haylage: intercept=–80·55, slope=0·329.
‡‡ The interaction between technological form×NDF was P=0·051; estimates for oil: intercept=1·84, slope=−0·185; estimates for protected: intercept=−25·43, slope=0·538; estimated for added fish oil: intercept=–11·63, slope=0·091.
§§ The interaction between technological form×NDF was P=0·090; estimates for oil: intercept=16·1, slope=0·0031; estimates for protected: intercept=36·2, slope=−0·077; estimated for added fish oil: intercept=–13·4, slope=0·094.
Supplementing soybeans and sunflower as seed resulted in the highest milk fat content, transfer efficiencies and milk fat proportions of C18:2n6 and C18:3n3, which were similar to the effects of the addition of fish oil to a diet containing soybean or sunflower. Protected soybean and sunflower sources did not increase milk fat content or C18:2n6 proportion compared with the other supplement forms. The data originated mainly from the study of Lundy et al. (Reference Lundy, Iii, Block, Bridges, Bertrand and Jenkins2004), in which only a slightly decreased extent of C18:2n6 biohydrogenation was found for the amides and Ca-salts compared with the soybean oil. However, the milk fat proportion of C18:2n6 in the current study did not differ between the protected form and oil. The increase in milk fat content and proportion of C18:2n6 when soybean and sunflower sources were fed as seed confirms the protective effects of the seed coat restricting bacterial access to the FA (Chilliard et al. Reference Chilliard, Glasser, Ferlay, Bernard, Rouel and Doreau2007).
The addition of fish oil to a diet containing soybean or sunflower resulted in the lowest proportions of C18:0 and cis-9-C18:1, and a higher proportion of trans-11-C18:1 in milk fat compared with supplementation as seed. These results confirm the inhibiting effect of fish oil on the final step of biohydrogenation (Shingfield et al. Reference Shingfield, Ahvenjärvi, Toivonen, Ärölä, Nurmela, Huhtanen and Griinari2003) and consequently the lower supply of C18:0 available for desaturation to cis-9-C18:1. The proportion of C18:0 in milk fat was increased with increasing dietary total FA content and this effect was most pronounced when soybean or sunflower were supplied as seed. Proportion of trans-11-C18:1 in milk fat was affected by dietary UFA and NDF contents, whereas the form of supplementation influenced the effect of dietary UFA with increased proportions of trans-11-C18:1 in milk fat when soybean or sunflower were supplied as oil or seed and decreased proportions when soybean or sunflower were supplied as a protected source, or when fish oil was added to the diet. Biohydrogenation of UFA seems to be most extensive in the oil form, due to the easy accessibility of the FA in oil compared with whole or processed seeds or protected sources (Chilliard et al. Reference Chilliard, Glasser, Ferlay, Bernard, Rouel and Doreau2007).
Milk fat content and UFA proportion were not affected by the main forage type in the diet, whereas proportions of SFA, cis-9-C18:1 and C18:2n6 were highest when the diet contained haylage as the main forage type. Transfer efficiency for C18:3n3 and proportion of C18:3n3 were lowest with maize silage as the main forage type. Maize silage as the main forage type showed a higher proportion of trans-11-C18:1 in milk fat compared with grass silage, which was in agreement with Chilliard et al. (Reference Chilliard, Glasser, Ferlay, Bernard, Rouel and Doreau2007) who concluded that rumen biohydrogenation appears to be less complete when adding linseed or sunflower oil to a diet containing maize silage compared with grass silage. This may be related to the higher level of fibre required to stabilize rumen pH when a higher amount of degradable starch is present (Zebeli et al. Reference Zebeli, Dijkstra, Tafaj, Steingass, Ametaj and Drochner2008) and the effects of rumen pH on the rate of biohydrogenation.
Linseed
Final models for diets supplemented with linseed are shown in Table 9. Milk fat content was positively affected by dietary NDF content and the intercept was adjusted for the form of linseed supply or addition of fish oil. However, this did not lead to significant differences in milk fat content. Proportion of UFA in milk was affected by the UFA content in the diet, whereas the form of linseed supply did not affect the UFA proportion. Transfer efficiency for C18:3n3 decreased with increasing dietary C18:3n3 content and decreasing NDF content and was not affected by form of linseed supply or addition of fish oil. However, proportion of C18:3n3 in milk fat was higher for protected linseed compared with linseed supplied as seed. Form of linseed supply or addition of fish oil affected the relationship between dietary C18:3n3 content and C18:3n3 proportion in milk fat with a more pronounced effect for protected linseed (higher intercept and more negative slope). Protection was obtained by formaldehyde treatment (Petit et al. Reference Petit, Dewhurst, Scollan, Proulx, Khalid, Haresign, Twagiramungu and Mann2002; Petit Reference Petit2003) and the effectiveness of this protection is based on chemical or technological pre-treatment to allow formation of cross-links between formaldehyde and protein (Fievez et al. Reference Fievez, Vlaeminck, Jenkins, Enjalbert and Doreau2007; Sterk et al. Reference Sterk, Hovenier, Vlaeminck, Van Vuuren, Hendriks and Dijkstra2010). Increasing dietary NDF content decreased C18:3n3 proportion in milk fat and, in addition, there was a positive interaction between dietary C18:3n3 and NDF content.
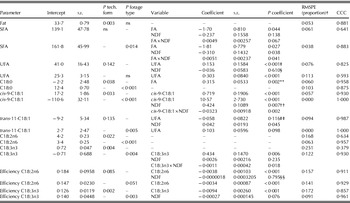
Table 9. Regression models to predict milk fat content (g/kg), proportions of milk SFA, UFA, C18:0, cis-9-C18:1, trans-11-C18:1, cis-9,cis-12-C18:2 (C18:2n6), and cis-9,cis-12,cis-15-C18:3 (C18:3n3; all in g/100 g), and transfer efficiencies from intake to milk for C18:2n6 and C18:3n3 (proportion) from diet characteristics (dietary FA and NDF contents; all in g/kg DM) and responses to technological form standardized to seed, and forage type standardized to diets containing maize silage as main forage type for diets supplemented with linseed fat*

ns: not significant.
* Data are adjusted for the random effect of experiment and weighted for unequal variance. The equations are standardized for diets containing linseed as seed or containing maize silage as the main forage type. Both intercept and coefficient would be adjusted for different technological forms or forage types. Class and continuous variables are included when P<0·10.
† RMSPE: root mean square prediction error as a proportion of the observed mean; CCC: concordance correlation coefficient.
‡ The interaction between technological form×FA was P=0·012; estimates for oil: intercept=3·2, slope=0·820; estimates for protected: intercept=90·7, slope=−0·515; estimated for added fish oil: intercept=75·4, slope=−0·319.
§ The interaction between technological form×FA was P=0·062; estimates for oil: intercept=0·84, slope=0·198; estimates for protected: intercept=4·90, slope=0·224; estimated for added fish oil: intercept=–14·29, slope=0·522.
** The interaction between forage type×NDF was P=0·029; estimates for lucerne silage: intercept=−153·65, slope=0·421; estimates for grass silage: intercept=−199·97, slope=0·554; estimated for haylage: intercept=−199·20, slope=0·538.
†† The interaction between technological form×NDF was P=0·028; estimates for oil: intercept=−53·19, slope=0·177; estimates for protected: intercept=31·50, slope=−0·032; estimated for added fish oil: intercept=–45·65, slope=0·198.
‡‡ The interaction between forage type×cis-9-C18:1 was P=0·034; estimates for lucerne silage: intercept=57·44, slope=−0·293; estimates for grass silage: intercept=20·93, slope=0·065; estimated for haylage: intercept=30·63, slope=−0·101.
§§ The interaction between technological form×UFA was P<0·001; estimates for oil: intercept=62·96, slope=−1·234; estimates for protected: intercept=43·14, slope=−0·914; estimated for added fish oil: intercept=36·79, slope=−0·790.
*** The interaction between technological form×C18:3n3 was P=0·015; estimates for oil: intercept=2·74, slope=−0·124; estimates for protected: intercept=7·03, slope=−0·276; estimated for added fish oil: intercept=3·24, slope=−0·109.
††† The interaction between forage type×C18:3n3 was P=0·087; estimates for lucerne silage: intercept=5·11, slope=−0·238; estimates for grass silage: intercept=5·40, slope=−0·238; estimated for haylage: intercept=–3·71, slope=−0·183.
‡‡‡ The interaction between forage type×C18:3n3 was P=0·033; estimates for lucerne silage: intercept=2·7, slope=−0·230; estimates for grass silage: intercept=2·9, slope=−0·207; estimated for haylage: intercept=−0·319, slope=−0·111.
The proportion of trans-11-C18:1 in milk fat was higher when linseed was supplied as oil compared with linseed fed as seed or fed with an additional supply of fish oil. Form of linseed supply affected the relationship between dietary UFA content and trans-11-C18:1 proportion in milk fat with a higher intercept and more negative slope when linseed was supplied as oil. Increasing NDF content decreased trans-11-C18:1 proportion, and a positive interaction was found between dietary UFA and NDF content. Because of the easy accessibility of the FA from oil compared with whole or processed seeds or protected sources, biohydrogenation is most extensive (Chilliard et al. Reference Chilliard, Glasser, Ferlay, Bernard, Rouel and Doreau2007), but seems incomplete in the current meta-analysis as shown by the highest proportion of trans-11-C18:1 in milk fat. The proportion of C18:0 in milk fat was not affected by linseed form, whereas the relationship between dietary total FA content and C18:0 proportion was more pronounced for linseed supplied with fish oil (negative intercept, more positive slope). The addition of fish oil did not result in a significant reduction of C18:0 in the current analysis, which was caused by the inclusion of a linseed supplemented diet with added fish meal containing a relatively low amount of oil (Ward et al. Reference Ward, Wittenberg and Przybylski2002). However, fish oil added to a diet containing formaldehyde-treated linseed showed a significantly lower proportion of C18:0 in milk fat (Petit et al. Reference Petit, Dewhurst, Scollan, Proulx, Khalid, Haresign, Twagiramungu and Mann2002). The lower proportion of trans-11-C18:1 for cows fed linseed in combination with added fish oil, compared with linseed fed as oil, was not expected. However, in combination with increased proportions of trans-11-C18:1 the proportion of trans-10-C18:1 is often increased as rumen micro-organisms shift their biohydrogenation pathway accordingly (Shingfield et al. Reference Shingfield, Ahvenjärvi, Toivonen, Ärölä, Nurmela, Huhtanen and Griinari2003, Reference Shingfield, Reynolds, Hervás, Griinari, Grandison and Beever2006). The effect on trans-10-C18:1 could not be determined in the current meta-analysis, due to the low number of studies reporting this biohydrogenation intermediate.
Milk fat content and proportion of UFA in milk fat were not affected by the main forage type in the diet, whereas proportions of SFA, cis-9-C18:1, and C18:3n3 (P=0·060) were highest when grass silage was the main forage type in the diet. Fat content and proportion of C18:0 were affected by dietary total FA and NDF content and their interaction, and proportion of cis-9-C18:1 was affected by dietary cis-9-C18:1 content. The effect of NDF on proportion of C18:0 in milk fat was more pronounced when grass silage or haylage were the main forage type, compared with maize silage or alfalfa silage. For diets based on lucerne silage or haylage, a higher intercept and a negative relationship with dietary cis-9-C18:1 content was shown, whereas for diets based on maize silage or grass silage a lower intercept and a positive relationship with dietary cis-9-C18:1 content was found. Glasser et al. (Reference Glasser, Ferlay and Chilliard2008) reported for linseed-supplemented diets an effect of forage type for milk fat cis-9-C18:1 proportion only, with the greatest increase for lucerne-based diets, followed by maize silage, grass hay and grass silage-based diets. In the current meta-analysis, the cis-9-C18:1 proportion was indeed high for linseed-supplemented diets based on lucerne silage. However, the proportion was comparable to the cis-9-C18:1 proportion achieved on grass silage-based diets and maize silage-based diets, whereas haylage-based diets showed a lower cis-9-C18:1 proportion in milk fat.
The proportion of C18:3n3 was significantly affected by dietary contents of C18:3n3, NDF and their interaction, with an interaction between main forage type and dietary C18:3n3 content (Table 9). Lucerne silage- or grass silage-based diets showed higher intercepts and more negative relationships with dietary C18:3n3 content compared with maize silage and haylage. Sterk et al. (Reference Sterk, Johansson, Taweel, Murphy, Van Vuuren, Hendriks and Dijkstra2011) found an interaction between crushed linseed proportion in the diet and forage to concentrate ratio and a linear effect of forage type (grass silage v. maize silage) on the proportion of C18:3n3 in milk fat. The proportion of trans-11-C18:1 showed negative regression slopes for dietary UFA and NDF contents and a positive regression slope for their interaction. The intercept was adjusted for main forage type in the diet, resulting in a higher trans-11-C18:1 proportion in milk fat when haylage was the main forage type compared with maize silage or grass silage. The conclusion by Palmquist et al. (Reference Palmquist, Lock, Shingfield and Bauman2005) that complete biohydrogenation to C18:0 is most extensive when high amounts of ensilaged forages are fed seems to be confirmed for linseed-supplemented diets. However, feeding haylage as the main forage type did not result in higher transfer efficiency for C18:3n3 and C18:3n3 proportion in milk fat compared with grass silages.
In conclusion, the form of supply of FA or the addition of fish oil to dairy cows fed rapeseed, soybean, sunflower or linseed significantly affected the relationships between the dietary nutrient composition (FA and NDF contents) and milk FA profile. This resulted in significant differences in several milk FA for fat sources supplied as oil, seed or a protected source, or supplied in combination with fish oil. The main forage type in the ration also had a significant effect on the relationship between dietary FA and NDF contents and milk FA profile, which resulted in significant differences in several milk FA for cows fed alfalfa silage, barley silage, grass silage, maize silage, maize/haylage or haylage as the main forage type in diets not supplemented with a fat source or diets supplemented with FA from rapeseed, soybean, sunflower, or linseed. The current meta-analysis showed that the effect of dietary nutrient composition on several milk FA proportions is dependent on the type and form of fat supplementation, addition of fish oil, and main forage type in the basal diet.
Jennifer Ellis (Animal Nutrition Group, Wageningen University) and Hassan Taweel (Agrifirm Innovation Center) are gratefully acknowledged for their contribution to the statistical analysis. The financial support of the Food and Nutrition Delta program of Senter Novem (Den Haag, the Netherlands), Royal FrieslandCampina (Amersfoort, The Netherlands), Agrifirm Group (Apeldoorn, The Netherlands), Agrifirm Innovation Center (Apeldoorn, The Netherlands), Barenbrug Holland B.V. (Oosterhout, The Netherlands) and the Animal Nutrition Group of Wageningen University (Wageningen, The Netherlands) is gratefully acknowledged.
Supplementary Material Reference
Supplementary Material 1. Sterk, A., Van Vuuren, A. M., Hendriks, W. H. & Dijkstra, J. Appendix 1.pdf Journal of Agricultural Science, Cambridge 2012; Suppl. Mat1 (http://journals.cambridge.org/AGS).


