Introduction
Forage is the main source of nutrients for ruminants in tropical and sub-tropical regions. ‘Marandu’ palisade grass (Brachiaria brizantha cv. Marandu Syn. Urochloa brizantha cv. Marandu) is the most sown forage in Brazil, representing 0.50 of the market for tropical pasture seeds (ABRASEM 2014). It is used in intensive livestock production systems for pasture and silage (Bernardes et al., Reference Bernardes, Reis and Moreira2005; Valle et al., Reference Valle, Fonseca and Martuscello2010).
In the presence of light, forage crop physiological processes include water loss and gain of primary products through photosynthesis. When synthesis of sugars exceeds their use, the surplus is temporarily stored in leaves and conductor tissues (Lechtenberg et al., Reference Lechtenberg, Holt and Youngberg1971). The type of carbohydrate stored depends on the phylogenetic and geographical origins of the species. Forage species from the sub-family Panicoideae contain mainly free glucose and starch while species from sub-family Pooideae, which occur mainly in temperate regions, accumulate fructans (Moraes et al., Reference Moraes2012).
In ruminant nutrition, carbohydrates in the cell, such as glucose, fructose, sucrose, starch and fructans, are called non-structural carbohydrates (NSC) and considered readily available energy sources for rumen microorganisms (Hall, Reference Hall2003). Morin et al. (Reference Morin2012) showed that the maximum concentration of NSC in Phleum pratense was achieved from 12.8 to 13.2 h after sunrise. This increase in the concentration of NSC was associated with a decrease in neutral detergent fibre (NDF), acid detergent fibre and nitrogen (N) concentrations. De Oliveira et al. (Reference De Oliveira2014) reported an 85% increase in ethanol-soluble carbohydrate (ESC) and a 12% decrease in N from 06.00 to 18.00 h in Pennisetum purpureum cv. Napier. In addition, silage made from forage harvested in the afternoon showed lower pH, greater NSC concentrations and better fermentation patterns, especially when ensiled without wilting (Owens et al., Reference Owens, Albrecht and Muck2002; Guo et al., Reference Guo2014; Tremblay et al., Reference Tremblay2014).
In pastures, when rotational stocking is used with 1-d grazing periods, animals can change grazing patterns, feeding behaviour and the nutritive value of ingested forage (Orr et al., Reference Orr2001; Gregorini et al., Reference Gregorini2006). However, forage species differ in diurnal partition and accumulation of carbon (C) assimilated, and the positive impact of this increased nutritive value of forage in the afternoon may vary according to plant species. Souza et al. (Reference Souza2005) showed differences in concentration and accumulation of water-soluble sugars (glucose, sucrose and fructose) and starch in the shoots of warm-season grasses. In Melinis minutiflora, starch concentration increased linearly from 08.00 to 12.00 h, exceeding the sugar concentration during the afternoon (~85 v. ~60 mg/g), and sugar concentration was approximately twice that of Echinolaena inflexa. In Echinolaena inflexa, the concentration of sugars was greater than starch from 08.00 to 16.00 h, without showing an accumulation pattern. In addition to the variation between hours of the day and species, there may be significant variation in NSC concentration between morphological parts of the plant. Lechtenberg et al. (Reference Lechtenberg, Holt and Youngberg1971) showed that there were greater glucose and fructose concentrations in the leaves than stems of Medicago sativa. Moraes et al. (Reference Moraes2012) observed that in native warm-season grasses from the Brazilian savannahs (cerrado), glucose and starch were found in many parts of the plant. However, sucrose was only detected at high levels in stems.
Most data concerning the concentration of sugars and starch in forages was generated in temperate climates and information about diurnal variation effects on NSC concentration in warm-season grasses are scarce. This information is essential to optimize harvest and grazing management of warm-season forages. The objective of the current study was to determine the primary site of sugar and starch storage and verify the seasonal accumulation of these nutrients on vertical canopy layers of palisade grass.
Materials and Methods
Study in plots (Experiment 1)
Experimental site and design
The experiment was conducted at the College of Animal Science and Food Engineering, University of São Paulo (FZEA-USP), Campus Fernando Costa, Pirassununga, SP, Brazil (21°57′ S, 47°28′ W, 650 m a.s.l.) from October 2013 to March 2014 (spring and summer), totalling 157 d. The climate is sub-tropical with dry winters (CEPAGRI 2014), an average annual temperature of 21.5 °C and total annual average rainfall of 1395 mm. The climatic data of the experiment (Fig. 1(a)) was recorded every 10 min by a computerized weather station located ~1700 m from plots. Rainfall in the experimental period was 665 mm (463 mm in the spring and 202 mm in the summer), 465 mm less than the long-term average for the last 67 years (Fig. 1(b)).

Fig. 1. Average monthly data of (a) maximum and minimum temperatures and solar radiation, and (b) monthly and accumulated rainfall compared with the historical average for the spring and summer in Pirassununga, SP, Brazil.
Treatments were the factorial arrangement of two harvest times 06.00 or 15.00 h and two vertical canopy layers, 0.30–0.20 (upper) and 0.20–0.13 m (intermediate) distributed in a completely randomized design with five replicates. Ten plots of 4 × 3 m2 (length × width) were allocated in an established pasture of Marandu palisade grass. Soil at the research site was a Eutric Nitisol (EMBRAPA 2006). The upper 0.0–0.2 m layer of the soil was sampled for analysis of fertility, showing the following chemical characteristics: pH (calcium chloride [CaCl2]) 5.4; organic matter (OM) 36 g/dm3; phosphorus (P; ion-exchange resin extraction method) 9 mg/dm3; sulphur (S) 16 mg/dm3; potassium (K) 2.6 mmolc/dm3; calcium (Ca) 22 mmolc/dm3; magnesium (Mg) 8 mmolc/dm3; H + Al 23 mmolc/dm3; aluminium (Al) trace mmolc/dm3; boron (B) 0.39 mg/dm3; copper (Cu) 2.4 mg/dm3; iron (Fe) 33 mg/dm3; manganese (Mn) 23.1 mg/dm3; zinc (Zn) 2.0 mg/dm3.
Sampling procedures
Plots were clipped at 30 mm stubble height before the beginning of each season (spring: 4 October 2013, summer: 17 December 2013). Forage was harvested when the canopy height reached 0.30 m, according to Giacomini et al. (Reference Giacomini2009). Forage height was measured at five points per plot with a graduated ruler. This harvest procedure resulted in regrowth intervals of 34 and 22 d (spring) and 24 and 59 d (summer). The sampling was conducted on 7, 8, 29 and 30 November 2013 (spring) and 10 and 11 January and 10 and 11 March 2014 (summer). After each harvest, plots were fertilized with 50 kg of N and potassium oxide (K2O)/ha in the forms of ammonium nitrate and potassium chloride, respectively.
All sampling was preceded by at least 1 d with full sunlight during daylight. Average solar radiation was 477 w/m2 and average maximum solar radiation was 1128 w/m2. Five plots were sampled at 15.00 h and another five the next morning at 06.00 h. Stratification into two vertical canopy layers (0.20–0.30 and 0.13–0.19 m) was achieved using a ruler and an HS 45-sickle bar mower (STIHL Ltda, São Leopoldo, RS, Brazil). The samples were immediately cooled and stored in a cooler containing ice until taken to the laboratory.
The samples from each experimental unit were divided into two equal portions (~300 g each): one for NSC analysis and the other for analysis of the remaining nutritive value response variables. Before drying, the NSC sub-sample received a microwave pre-treatment (Pelletier et al., Reference Pelletier2010b). The pre-treatment consisted of heating the sample (~75 °C) in a microwave at 600 Watts for 1 min in order to stop enzymatic activity, preventing the respiratory processes from using NSC as an energy source. The other forage sub-sample was dried directly at 55 °C for 72 h in a forced-air oven (AOAC International 2012) without undergoing microwave heating. One sample per replicate was used for chemical analysis.
Chemical composition and digestibility analysis
Samples were ground in a Tecnal TE-650/1 stationary mill (Tecnal Lab equipment, Piracicaba, SP, Brazil) to pass through a 1-mm sieve. Dry matter, ash and N concentrations were determined according to AOAC International (2012), methods 934.01, 942.05 and 2001.11, respectively, and NDF concentrations according to Van Soest et al. (Reference Van Soest, Robertson and Lewis1991), without the thermostable alpha-amylase and sodium sulphite treatment. The NDF ash and N free (NDFaNf), ash and N concentration in NDF (ashNDF and NNDF, respectively) were determined according to AOAC International (2012). The NDFaNf was calculated as: NDFaNf = NDF–(ashNDF + NNDF).
Carbohydrates were separated into starch and ethanol-soluble sugars in 80% ethanol, which represents mono and disaccharides, according to the method described by Hall (Reference Hall2000). The starch concentration was determined from the ethanol-insoluble residue using the gelatinization technique and enzymatic hydrolysis, followed by a colorimetric determination of glucose according to Hall (Reference Hall2000). The sum of ESC and starch fractions was considered as the total NSC (Hall, Reference Hall2003).
The in vitro true digestible dry matter (IVDDM) was determined after 48 h of incubation using the Tecnal TE-150 in vitro Incubator (Tecnal Lab equipment, Piracicaba, SP, Brazil), according to Robinson et al. (Reference Robinson, Campbell-Matthews and Fadel1999). Rumen fluid was collected from three castrated Nelore (Bos indicus) steers (400 ± 4.7 kg body weight) fistulated in the rumen, grazing Marandu palisade grass with no supplementation. After 48 h of incubation, the indigestible residue was treated with a neutral detergent (Van Soest et al., Reference Van Soest, Robertson and Lewis1991). All analyses were performed in duplicate, except ESC, which was made in triplicate. All results are expressed on a dry matter (DM) basis. Samples were chemically analysed by harvest date and the data pooled and statistically analysed by season.
Statistical analysis
The response variables were DM, N, NDFaNf, ESC, starch, NSC and IVDDM concentration. Data were analysed using the PROC MIXED of SAS software (SAS Institute, 2008) considering the time of day, canopy layer, season and their interactions as fixed effects. Replications and their interactions were considered random effects. Canopy layer and season were analysed as repeated measurements. The assay data were initially subjected to analysis of variance after modelling the heterogeneity of existing variances among canopy layer levels and season factors. The covariance structure (Littell et al., Reference Littell, Henry and Ammerman1998) choice was based on the results of likelihood ratio tests and the value of the Akaike Information Criterion. Covariance structures tested were Unstructured, Compound Symmetry (CS), Heterogenous CS (CSH), Toeplitz (TOEP) and Heterogenous Toeplitz (TOEPH). The treatment means were estimated using LSMEANS and considered different when P < 0.050.
Greenhouse study (Experiment 2)
Experimental site and design
The experiment was conducted in a greenhouse located at the FZEA-USP, ~1700 m from the Experiment 1 site, in the summer of 2013 (7 January to 4 March, 56 d). The climate is described in Experiment 1. The soil had the following chemical composition: pH (CaCl2) 5.2; OM 36 g/dm3; P (ion-exchange resin extraction method) 19 mg/dm3; S 11 mg/dm3; K 3.8 mmolc/dm3; Ca 27 mmolc/dm3; Mg 12 mmolc/dm3; H + Al 41 mmolc/dm3; Al trace mmolc/dm3; B 0.44 mg/dm3; Cu 4.0 mg/dm3; Fe 21 mg/dm3; Mn 0.9 mg/dm3; Zn 2.7 mg/dm3.
Treatments were a time of day at which the sampling was made (06.00, 09.00, 12.00, 15.00, 18.00 and 21.00 h) and the morphological fractions of plants (leaf blade or pseudostem) distributed in a completely randomized design with three replicates. Each experimental unit had four pots, resulting in 72 pots. The pot size was 5 litres and filled with 2.5 kg of sieved and air-dried soil. Irrigation was carried out daily to keep the soil saturated with 0.8 of its weight as water (Soria et al., Reference Soria2003). Temperature and moisture in the greenhouse were recorded with a digital thermo-hygrometer model 7429.02 (Incoterm, Porto Alegre, RS, Brazil). Solar radiation was recorded every 10 min by a computerized weather station located ~30 m from the site. The average temperature and humidity during the experimental period were 28 °C and 49%, respectively. On sampling days, the variation in temperature and solar radiation was recorded every 10 min. The maximum solar radiation occurred at 12.10 h (1204 w/m2), and the air temperature increased from 20 °C at 06.00 h to 33 °C at 16. 00 h. The photoperiod of the sampling day was 12.6 h.
Sampling procedures
Marandu palisade grass was seeded on 7 January 2013. Thinning was performed after the appearance of the second leaf, leaving six seedlings of uniform size per pot. On 30 January 2013, N fertilizer was diluted in water and fertilization (urea) was conducted with 25 mg N/kg of soil. Harvest occurred 52 d after seedling germination. The senescence of the first leaf was used as an indicator of harvest time and plants were clipped at soil level with scissors. Separation of the morphological components leaf blade and pseudostem was performed manually immediately after harvest. Samples were placed in paper bags, weighed and subjected to a microwave pre-treatment (Pelletier et al., Reference Pelletier2010b) before drying in a forced-air oven at 55 °C for 72 h (AOAC International, 2012). After drying, leaf blade and pseudostem herbage mass (HM) was measured.
Chemical composition and digestibility analysis
The chemical composition and digestibility analysis were the same as described in Experiment 1.
Statistical analysis
Response variables were HM, DM, N, NDFaNf, ESC, starch, NSC and IVDDM concentrations. Data were analysed using the PROC MIXED of SAS version 9.2 (SAS Institute, 2008), aiming to model the existing heterogeneity of variances between fraction levels (leaf blade and pseudostem). The factors time and fraction and their interaction were considered fixed effects. Replicate and its interactions were considered random effects. The data were subjected to analysis of variance with a further study of regression using orthogonal contrasts when P < 0.050. The covariance structure was selected as described in Experiment 1.
Results
Experiment 1
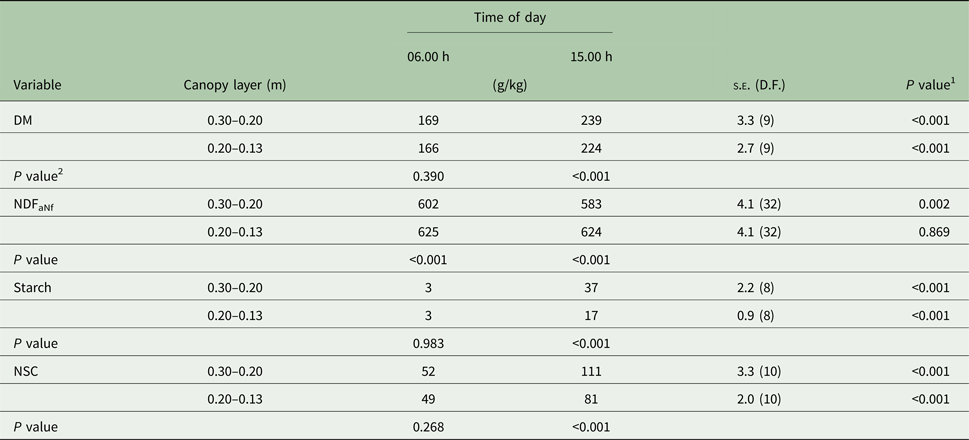
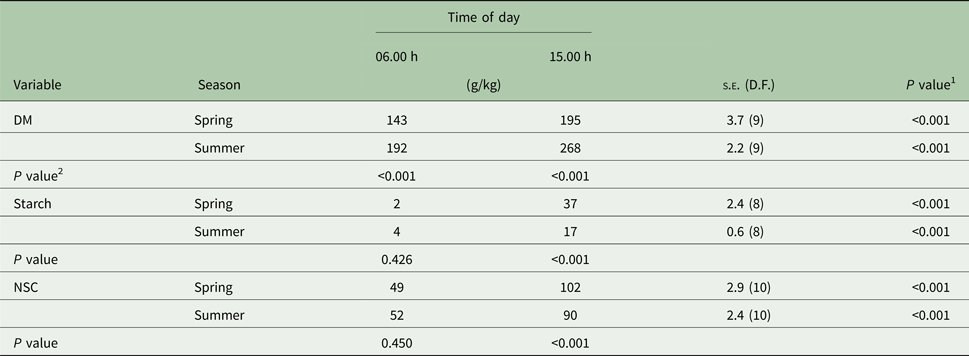
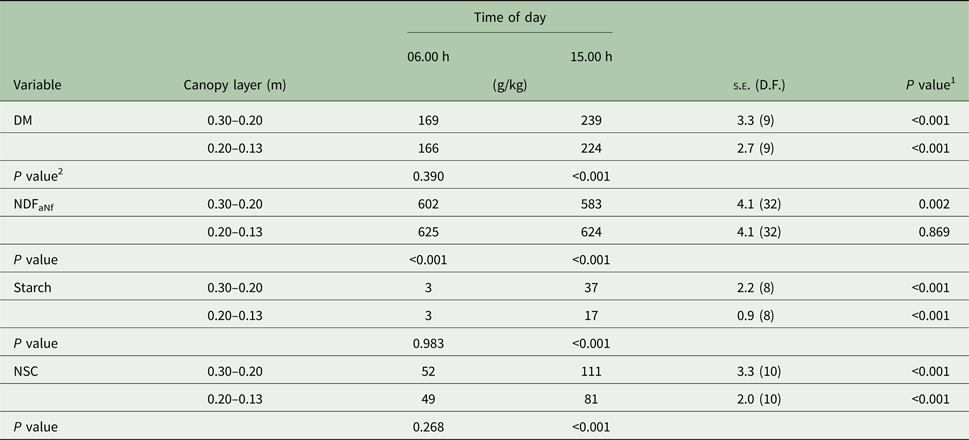
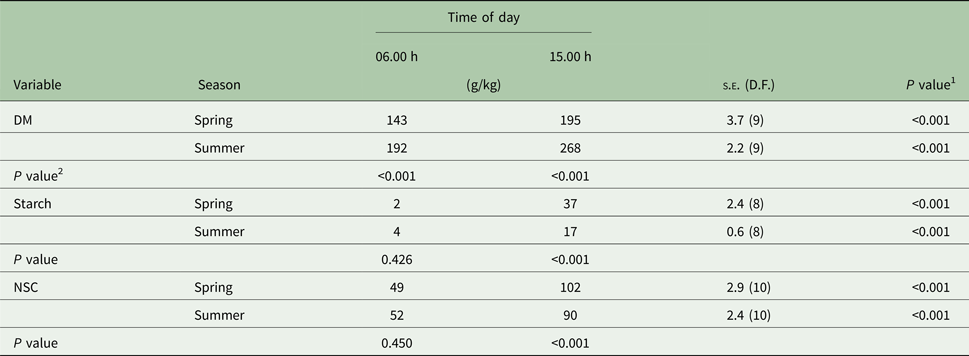
There were significant (P < 0.001) time × layer and time × season interactions for DM concentration. The interactions occurred because at 15.00 h, DM concentration was greater on the upper than in the intermediate layer (P < 0.001), but similar at 06.00 h (Table 1). In addition, the extent of DM accumulation from 06.00 to 15.00 h was greater in summer (+76 g/kg) than spring (+52 g/kg; Table 2).
Table 1. Dry matter (DM), neutral detergent fibre, ash, nitrogen-free (NDFaNf), starch, and non-structural carbohydrates (NSC) concentrations in two canopy layers (upper 0.30–0.20 m, and intermediate 0.20–0.13 m) of Marandu palisade grass harvested in the morning and in the afternoon (Experiment 1)
Means are considered different when P < 0.050.
1 P value refers to the effect of time of day treatments within each canopy layer (row).
2 P value refers to the effect of canopy layer treatments within each time of day (column).
Table 2. Dry matter (DM), starch and non-structural carbohydrates (NSC) in Marandu palisade grass harvested in the morning and afternoon during spring and summer (Experiment 1)
Means are considered different when P < 0.050.
1 P value refers to the effect of time of day treatments within each canopy layer (row).
2 P value refers to the effect of canopy layer treatments within each time of day (column).
Independent of canopy layer and time of day, there was no variation in ESC concentration between seasons. There was no interaction between canopy layer and time of day. Forage had greater ESC concentration in the afternoon than the morning (66 v. 48 g/kg; s.e. = 1.1; 32 D.F.; P < 0.001). Independent of time of day, ESC concentration in the upper canopy layer was greater than in the intermediate layer (60 v. 54 g/kg; s.e. = 1.1; 32 D.F.; P = 0.001).
There were significant (P < 0.001) interactions between time × layer and time × season for starch concentration. The time × layer interaction occurred because at 15.00 h the starch concentration was greater in the upper canopy layer than the intermediate layer (P < 0.001), but similar at 06.00 h (Table 1). In addition, the starch concentration was similar between seasons at 06.00 h but was greater (P < 0.001) in the spring than summer at 15.00 h (Table 2). The extent of the starch concentration from 06.00 to 15.00 h was greater in upper (+34 g/kg) than intermediate layer (+14 g/kg; Table 1) and in the spring (+35 g/kg) than summer (+13 g/kg; Table 2).
The NSC was influenced by starch concentrations, thus NSC and starch had the same pattern. There were significant interactions between time × layer (P < 0.001) and time × season (P = 0.002). The time × layer interaction occurred because at 15.00 h, NSC concentration was greater in the upper canopy than intermediate (P < 0.001), but similar at 06.00 h (Table 1). The time × season interaction occurred because, at 06.00 h, NSC concentration was similar between seasons, but at 15.00 h the NSC concentration was greater during the spring than summer (102 v. 90 g/kg; s.e. = 2.6; 10 D.F.; P < 0.001; Table 2). Also, the extent of the NSC concentration from 06.00 until 15.00 h was greater in the upper (+59 g/kg) than the intermediate layer (+32 g/kg; Table 1) and in spring (+53 g/kg) than summer (+38 g/kg; Table 2).
Forage harvested in the afternoon had greater IVDDM than in the morning (718 v. 709 g/kg; s.e. = 1.7; 13 D.F.; P = 0.002) and the upper canopy layer had greater IVDDM than the intermediate layer (721 v. 707 g/kg; s.e. = 1.6; 8 D.F.; P < 0.001). In addition, forage IVDDM was greater during spring than summer (739 v. 689 g/kg; s.e. = 1.9; 13 D.F.; P < 0.001).
There was no effect of time of day on N concentration; however, N concentration was greater (P < 0.001) in the spring (24 and 22 g/kg; s.e. = 0.3; 32 D.F. in the upper and intermediate layer, respectively) than in the summer (19 and 15 g/kg; s.e. = 0.3; 32 D.F. in the upper and intermediate layer, respectively) for both layers (P < 0.001). The N concentration was greater in the upper layer than intermediate in spring (P < 0.001) and summer (P < 0.001), but with greater magnitude in summer than in spring (+4 v. +2 g/kg, respectively).
The NDFaNf concentration was lower in the spring than summer months (588 v. 629 g/kg; s.e. = 2.9; 32 D.F.; P < 0.001). However, there was a time × layer interaction (P = 0.034) for NDFaNf concentration (Table 1). The intermediate canopy layer had greater NDFaNf concentration than the upper layer at 06.00 h (P < 0.001) and 15.00 h (P < 0.001). The interaction occurred because the NDFaNf concentration in the upper canopy layer was lower (P = 0.002) at 15.00 than 06.00 h but was similar in the intermediate layer (Table 1).
Experiment 2
There was a time × fraction interaction effect (P = 0.007) for herbage mass. The interaction occurred because there was no variation in pseudostem herbage mass (3.5 g/pot; s.e. = 0.12; 20 D.F.). However, leaf blade herbage mass varied during the day. A quadratic regression model was the best fit (s.e. = 0.08; 20 D.F.; P < 0.001) and the regression equation is as follows:
where T = time (h) after 06.00 h.
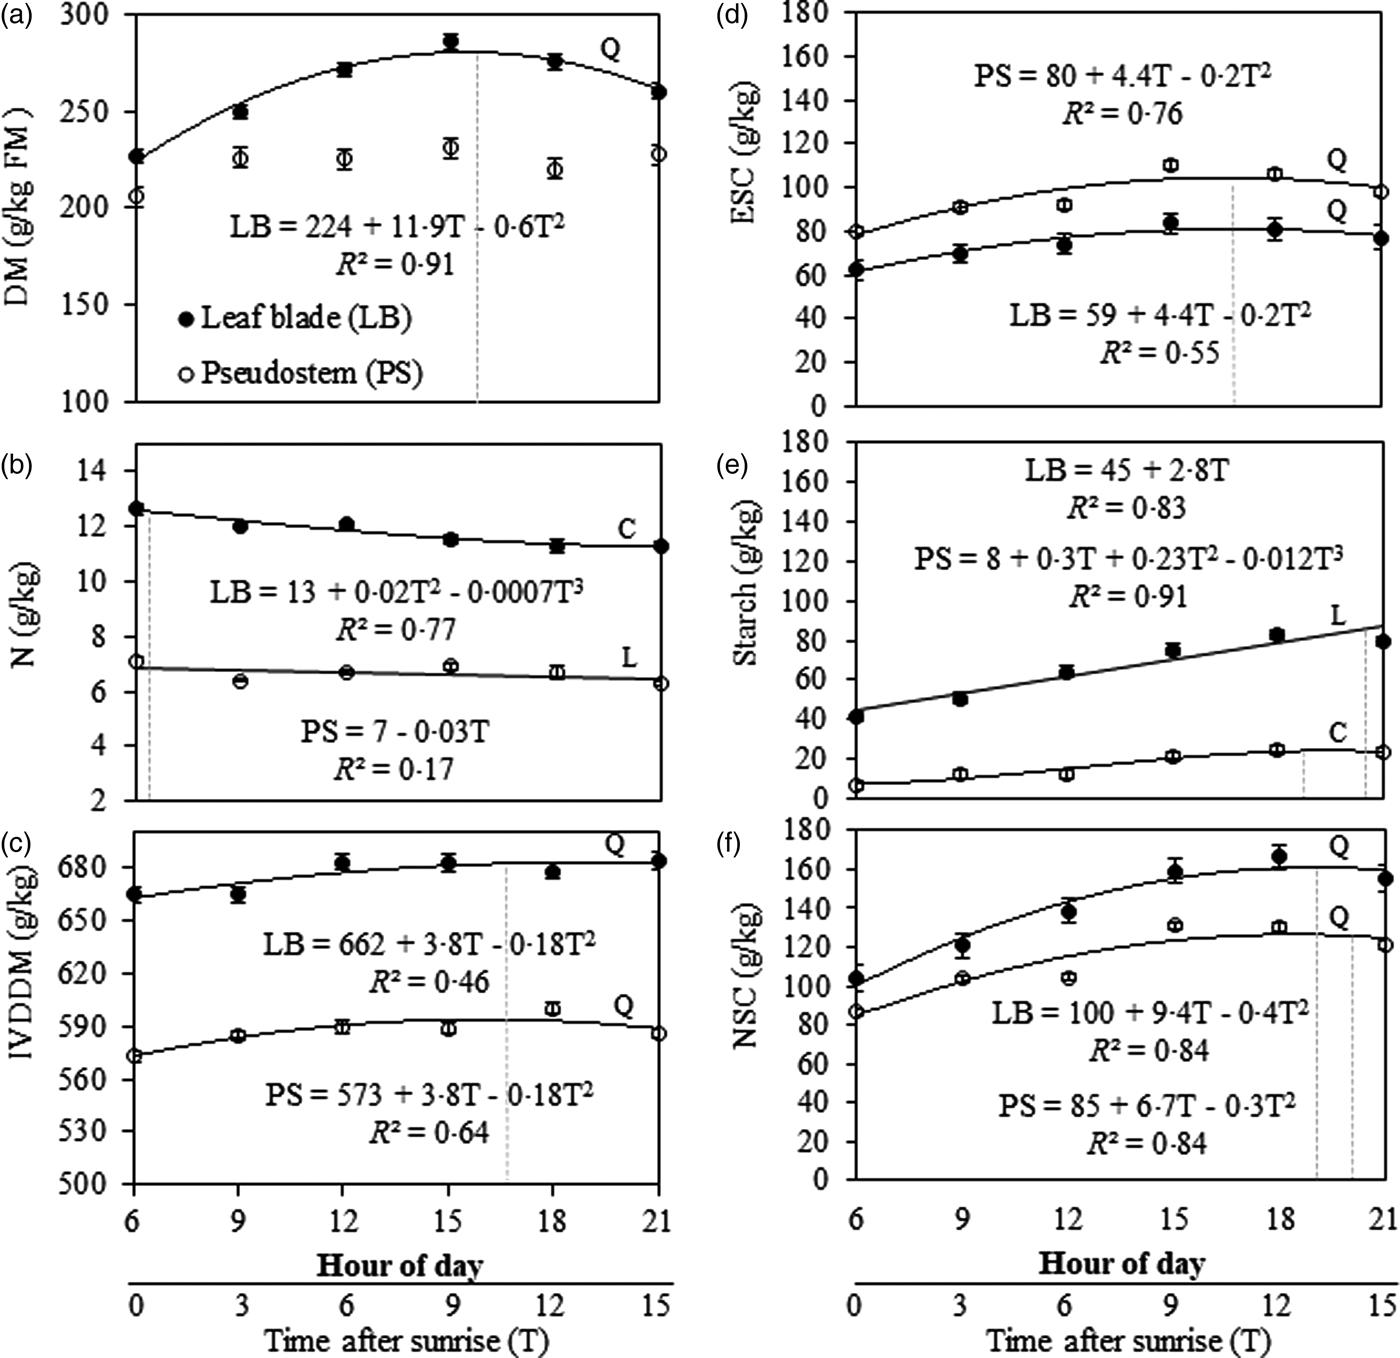
There was a time × fraction interaction (P = 0.009) effect on DM concentration. The interaction occurred because leaf blade DM concentration varied during the day; however, there was no variation in pseudostem DM concentration (223 g/kg; s.e. = 5.2; 10 D.F.; P = 0.066). There was an increase (P < 0.001) of DM concentration in the leaf blade at a rate of 5.9 g/kg/h (R 2 = 0.91) ranging from 224 g/kg; s.e. = 3.7; 10 D.F.; at 06.00 h to maximum values of 280 g/kg; s.e. = 3.7; 10 D.F.; at 15.30 h (Fig. 2(a)).
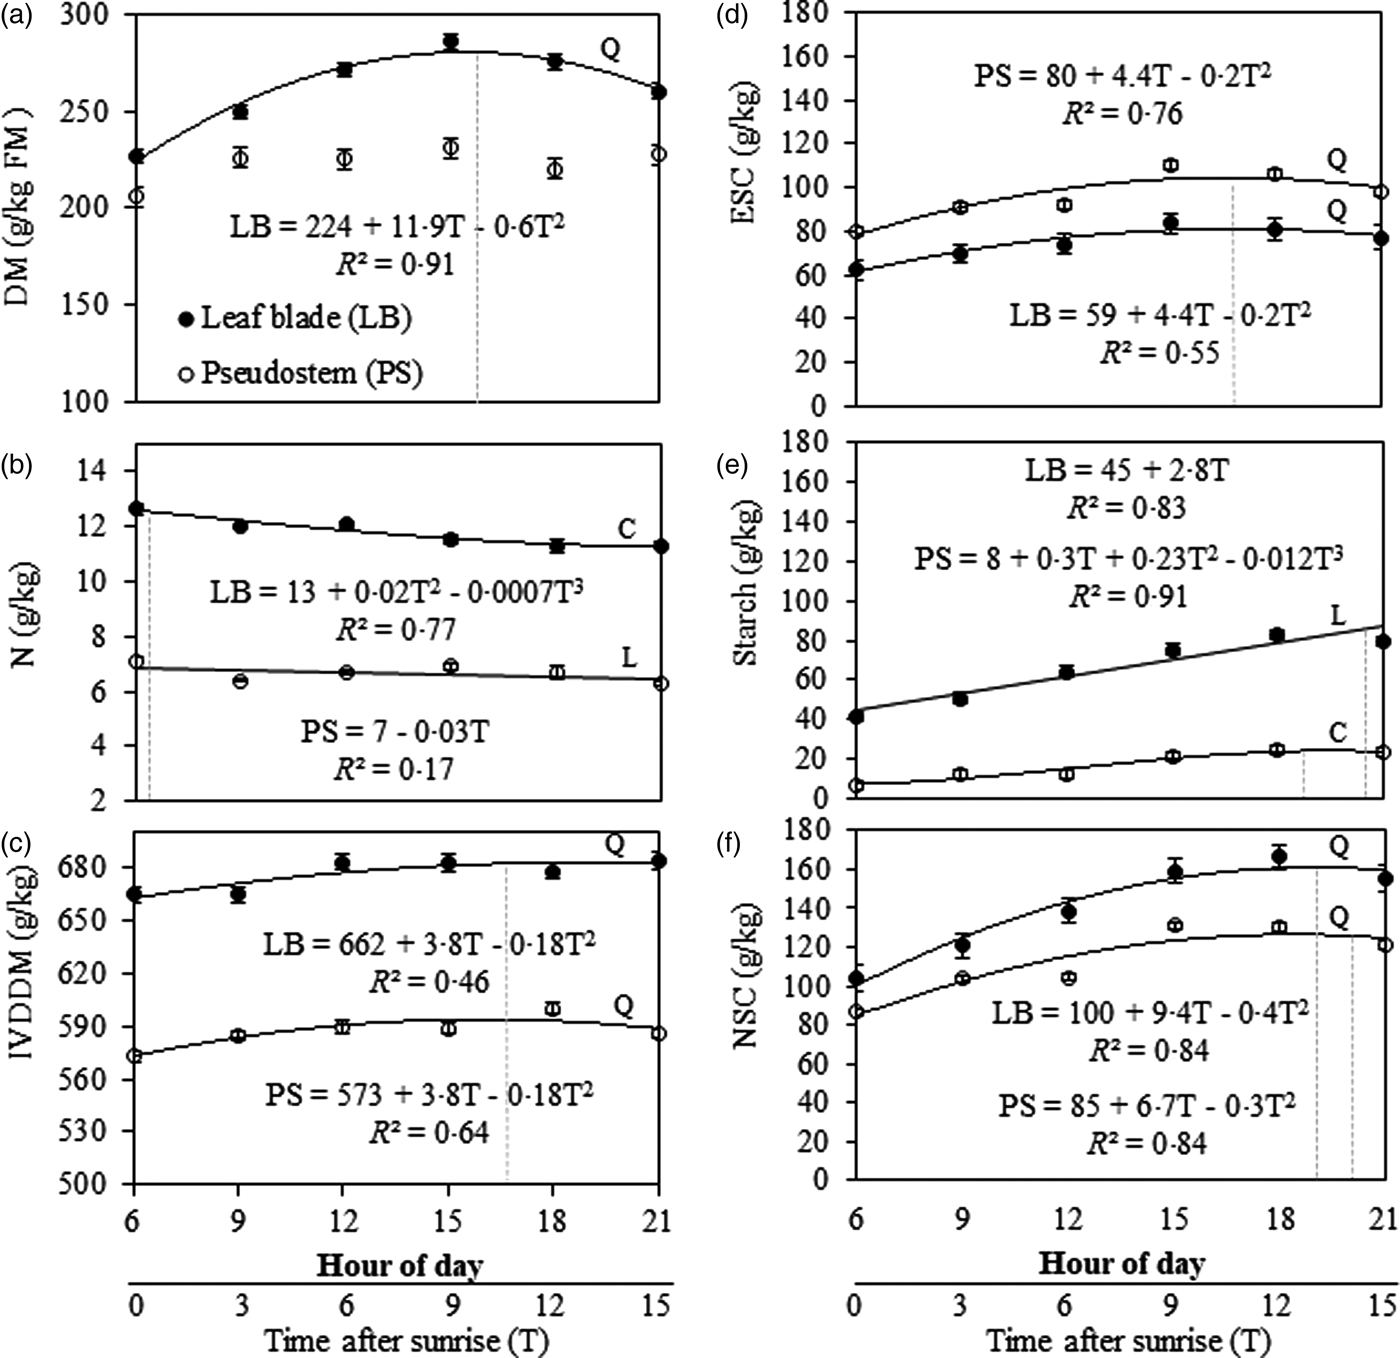
Fig. 2. Chemical composition variation patterns and digestibility of Marandu palisade grass up to 15 h after sunrise in Pirassununga, SP, Brazil (Experiment 2). (a) Dry matter concentration, (b) nitrogen, (c) in vitro digestible dry matter, (d) ethanol-soluble carbohydrates, (e) starch and (f) non-structural carbohydrates. Solid [●] and open [○] symbols indicate the response for leaf blade (LB) and pseudostem (PS), respectively. Dotted vertical lines represent the time after sunrise when the nutrient concentration reached its maximum value based on regression equations. Regressions curves were plotted when the time of cutting was significant (P < 0.050) and curves types were chosen based on the significance of linear (L), quadratic (Q), and cubic (C) components. Error bars at each dot indicate the standard error of mean.
There was a time × fraction interaction (P = 0.002) effect on N concentration. Nitrogen concentration in the pseudostem decreased (P < 0.001) slightly from 06.00 h (7 g/kg; s.e. = 0.2; 9 D.F.) to 21.00 h (6 g/kg; s.e. = 0.1; 9 D.F.); but in leaf blade there was a cubic pattern variation throughout the day (P = 0.012; Fig. 2(b)). Leaf blade N concentration decreased from 06.00 h (13 g/kg; s.e. = 0.2; 9 D.F.) to 09.00 h (12 g/kg; s.e. = 0.03; 9 D.F.) before increasing again until 12.00 h, then finally decreasing until 21.00 h (11 g/kg; s.e. = 0.1; 9 D.F.).
The IVDDM was greater in leaf blade than pseudostem (P = 0.007) from 06.00 to 21.00 h (Fig. 2(c)). In addition, IVDDM varied throughout the day (P = 0.002) in leaf blade (P = 0.010) and pseudostem (P = 0.041) with the same pattern (quadratic regression model). Digestible DM increased at a rate of 1.8 g/h (R 2 = 0.46 and 0.64 for leaf blade and pseudostem, respectively) from 06.00 until ~ 16.40 h, when the maximum IVDDM was observed (Fig. 2(c)).
There were time (P < 0.001) and fraction (P < 0.001) effects on ESC concentration. The variation of leaf blade and pseudostem followed the same pattern (quadratic regression model, Fig. 2(d)): there was an increase of ESC concentration from 06.00 until 16.40 h (10.7 h after sunrise) at a rate of 1.9 g/kg/h (R 2 = 0.76 and 0.55 for pseudostem and leaf blade, respectively). In this elapsed time, ESC concentration in leaf blade (P < 0.009) and pseudostem (P < 0.017) ranged from 59 g/kg (s.e. = 2.6; 22 D.F.) to 83 g/kg (s.e. = 2.6; 22 D.F.) and from 80 g/kg (s.e. = 2.4; 22 D.F.) to 104 g/kg (s.e. = 2.4; 22 D.F.) (Fig. 2(d)).
There was a time × fraction interaction (P = 0.002) for starch concentration: in the leaf blade, it increased linearly (P < 0.001) from 06.00 to 21.00 h at a rate of 2.8 g/kg/h. However, in the pseudostem, the best-fit adjustment was a cubic regression model (P = 0.020; Fig. 2(e)). The minimum starch concentration in pseudostem was registered at 06.00 h and maximum concentration at 18.00 h, decreasing until 21.00 h (Fig. 2(e)).
There was a significant time × fraction interaction (P = 0.001) for NSC concentration. The NSC in the leaf blade was greater than in the pseudostem for all time treatments (Fig. 2(f)). In both fractions, there was a quadratic increase in NSC concentration during the day for leaf blade (P < 0.001) and pseudostem (P = 0.003). However, the interaction occurred because the accumulation rate of NSC was different in leaf blade and pseudostem. The NSC accumulation rate until the maximum value was 4.4 and 3.2 g/h (R 2 = 0.84 for both) for leaf blade and pseudostem, respectively. The maximum NSC concentration in leaf blade and pseudostem was reached at ~18.00 and 18.30 h, respectively (Fig. 2(f)).
Discussion
The variation in forage moisture concentration during the day, in both experiments, may be explained by several climatic and physiological factors, including variation in dew water, the relationship between soil water absorption, transpiration and translocation, and the water required to build or release photosynthetic products (Taiz and Zeiger, Reference Taiz and Zeiger2015). Also, the stock of glucose in the starch granule reduces intracellular osmotic pressure and less water is needed inside the cell (Zeeman et al., Reference Zeeman, Smith and Smith2007). Greater DM concentration in leaf blades than pseudostems in Experiment 2 are probably because the leaf blade represents the main site of photosynthesis and gas exchange with the atmosphere, whereas the pseudostem is the main site of water and photosynthetic products translocation. Therefore, the increase in DM yields and concentration in leaf blades during the day may be due to greater starch accumulation in the leaf blade than the pseudostem. These responses can explain the greater DM concentration in the upper canopy layer than the intermediate layer at 15.00 h in Experiment 1. Dryer conditions in summer may have resulted in greater DM accumulation from 06.00 to 15.00 h relative to spring.
Increases in soluble carbohydrate concentration during the day have been described in forage plants in temperate (Pelletier et al., Reference Pelletier2010a) and tropical (Souza et al., Reference Souza2005) regions. It occurs when synthesis of sugars exceeds their use during the day, and the surplus is temporarily stored in above-ground plant organs (Lechtenberg et al., Reference Lechtenberg, Holt and Youngberg1971). In agreement, the current work found greater ESC concentrations in the afternoon than in the morning in both experiments (+18 g/kg in Experiment 1 and +24 g/kg in Experiment 2). Similar results were reported by De Oliveira et al. (Reference De Oliveira2014), evaluating soluble carbohydrates in Pennisetum purpureum cv. Napier samples collected at 06.00 and 18.00 h (+35 g/kg). The greater ESC concentration in pseudostem than in leaf blade in Experiment 2 of the current work are in agreement with results from Moraes et al. (Reference Moraes2012), who evaluated 24 grass species of Brazilian savannahs (cerrado) and found less soluble carbohydrate in stems than in leaf blade only in Echinolaena inflexa. In Experiment 2, despite greater ESC concentrations in the pseudostem than leaf blade, the yields of leaf blade ESC represented 0.54 and 0.60 of total ESC yields at 06.00 and 18.00 h, respectively. The upper canopy layer had higher ESC concentrations than the intermediate layer in Experiment 1, probably due to greater leaf:stem ratio in the upper layer. In Experiment 2, samples were taken at ground level, including the pseudostem base, which contains more sugars than the upper portion (Volenec, Reference Volenec1986), while in Experiment 1, forage was sampled at 13 cm above ground level, excluding the pseudostem base portion. In Experiment 1, the absence of a significant interaction between time of day and season indicates that the response to the time of harvest was similar in both spring and summer. Similar responses were reported by Morin et al. (Reference Morin2011) evaluating diurnal changes in NSC concentration in alfalfa during spring growth and summer regrowth at two sites in eastern Canada.
Starch concentration in grasses, especially those from the Paniceae tribe, may have an important role in total NSC accumulation during the day (Moraes et al., Reference Moraes2012). Diurnal increases in starch concentration have been found in Bermuda grass (Cynodon dactylon) (Kagan et al., Reference Kagan2011) and Orchardgrass (Dactylis glomerata L.) (Burner and Belesky, Reference Burner and Belesky2004), varying from 10 to 70 g/kg. In agreement with these observations, it was found in Experiment 2 of the current study that starch concentration was approximately twice as high in the leaf blade at 18.00 than at 06.00 h. Starch concentration ranged from 8 g/kg in pseudostem at 06.00 h to 80 g/kg in the leaf blade at 18.00 h. Also, in Experiment 1, starch yields in the leaf blade at sunset represented 104% more starch than at sunrise (0.51 v. 0.25 g/pot, respectively). The greater starch yields, concentration and rate of accumulation in the leaf blade relative to pseudostem is probably due to the higher formation of starch from simple sugars occurring during the day (Zeeman et al., Reference Zeeman, Smith and Smith2007). The greater capacity to accumulate starch in the upper rather than the intermediate canopy layer in Experiment 1 is related to the greater leaf blade presence in the upper canopy. Moreover, a greater capacity to accumulate starch in spring than summer is probably due to leaf blade age (shorter regrowth period in spring than in summer), affecting the efficiency and quality of the photosynthetic process (Brown et al., Reference Brown, Cooper and Blaser1966).
The differences in NSC accumulation patterns in the leaf blade and pseudostem is a consequence of the different pattern of starch and ESC accumulation in the plant tissue. In Experiment 2, the same pattern of increase in sugars was observed in the leaf blade and pseudostem. However, starch increased faster in the leaf blade than pseudostem during the day. These results are in agreement with greater NSC concentrations in the upper than intermediate canopy layer and greater magnitude of accumulation from 06.00 to 15.00 h in Experiment 1. Morin et al. (Reference Morin2011) reported a similar influence of starch on NSC accumulation in alfalfa. In the current study, the results of Experiment 2 show that ESC is the main NSC in the pseudostem, comprising 0.91 of NSC at sunrise and 0.80 of NSC at sunset. The concentration of ESC in leaf blades represented 0.57 and 0.51 of NSC at sunrise and sunset, respectively.
The greater IVDDM in leaf blade than pseudostem observed in Experiment 2 of the current study was demonstrated earlier in Marandu palisade grass by Ribeiro et al. (Reference Ribeiro2014). This reflected greater IVDDM in the upper than intermediate canopy layer observed in Experiment 1. Also, independent of both canopy layer (Experiment 1) or morphological fraction (Experiment 2), IVDDM was found to be greater in the afternoon compared with the morning, probably due to NSC accumulation and reduction of fibre concentration.
Greater concentration of NSC in the afternoon than morning caused a dilution effect and decreased NDF concentration. In Experiment 2, NSC concentration was greater in the leaf blade than the pseudostem, and in Experiment 1 there was decreased NDF concentrations in the upper layers. Greater N and lower NDF concentration in spring than summer in Experiment 1 were likely to be a result of the shorter regrowth period in spring than summer. Also, in Experiment 1, a lower N concentration in the intermediate than upper canopy layer was expected because of the distribution of younger photosynthetic tissue in the upper canopy layer (Griggs et al., Reference Griggs2007). Similar N concentration in the morning and afternoon hours (Experiment 2) is in agreement with results reported by Burner and Belesky (Reference Burner and Belesky2004). Youngberg et al. (Reference Youngberg, Holt and Lechtenberg1972) reported a dilution effect, with an increase in NSC and decline in N concentration in alfalfa during the day. Also, De Oliveira et al. (Reference De Oliveira2014) observed a 10% decline in elephant grass N from 06.00 to 18.00 h. In Experiment 2 of the current study, a slight decrease in N concentration was found in the pseudostem, but cubic patterns were recorded in the leaf blade. This pattern may be due to dilution effects, by increasing NSC and N compounds during the day. The fluctuation in N concentration during the day is in agreement with the findings of Griggs et al. (Reference Griggs2007).
In summary, the leaf blade is the primary plant organ for diurnal storage of carbohydrates, with equivalent pool importance (yields) between sugars and starch in the afternoon hours. The maximum concentration of DM and NSC occurs after 15.00 h, especially in the upper canopy layer, and there is little variation in concentrations of N and fibre. Thus, harvesting forage in the afternoon may result in forage with greater digestibility, a potential positive impact in animal nutrition and better nutrient profile for silage fermentation. There is less variation in sugar accumulation between canopy layers in the spring than in the summer and the NSC concentration is greater in the afternoon during the spring than summer. Therefore, harvesting management to optimize energy concentration in Marandu palisade grass should be conducted in the afternoon, with stubble height above 0.13 m in the spring and above 0.20 m in the summer.
Acknowledgements
The authors gratefully acknowledge the Forage and Pastures Study Group for the assistance in data collection and laboratory analyses.
Financial support
This work was funded by São Paulo Research Foundation (FAPESP) (process n°. 2012/05912-5 and 2012/03121-0).
Conflict of interest
None.
Ethical standards
Not applicable.


