Introduction
Flowering date (FD) and heading date (HD) are important traits to determine adaptation to various eco-geographical regions for cereal crops, including wheat, and are critical for yield potential and stability (Snape et al., Reference Snape, Butterworth, Whitechurch and Worland2001; Mühleisen et al., Reference Mühleisen, Piepho, Maurer, Longin and Reif2013). Appropriate HD and FD will ensure wheat cultivars attain the desired yield level in wheat breeding programmes. Therefore, understanding the genetic basis of HD and FD is important for wheat breeding programmes in developing new cultivars with the adaptive capacity to various environments (Beniston et al., Reference Beniston, Stephenson, Christensen, Ferro, Frei, Goyette, Halsnaes, Holt, Jylhä, Koffi, Palutikof, Schöll, Semmler and Woth2007).
Flowering date and heading date are controlled by multiple genes and influenced by environmental conditions such as temperature and daylength. They are determined in wheat by three gene groups: vernalization (Vrn), photoperiod (Ppd), and earliness per se (Eps) genes (Worland, Reference Worland1996, Reference Worland, Börner, Korzun, Li, Petrovic and Sayers1998; Kato and Yamagata, Reference Kato and Yamagata1998). Differences in Vrn determine spring and winter wheat habits, Ppd plays a major role in determining flowering time and sensitivity to photoperiodism, and Eps influences flowering time independently from photoperiodism. Four Vrn genes, namely Vrn-A1 on chromosome 5A, Vrn-B1 on 5B, Vrn-D1 on 5D, and Vrn-B4 on 7B, have been identified (Galiba et al., Reference Galiba, Quarrie, Sutka, Morgounov and Snape1995; Nelson et al., Reference Nelson, Sorrells, Van Deynze, Lu, Atkinson, Bernard, Leroy, Faris and Anderson1995; Dubcovsky et al., Reference Dubcovsky, Lijavetzky, Appendino and Tranquilli1998; Iwaki et al., Reference Iwaki, Nishida, Yanagisawa, Yoshida and Kato2002; Tóth et al., Reference Tóth, Galiba, Fehér, Sutka and Snape2003), cloned and characterized (Yan et al., Reference Yan, Loukoianov, Tranquilli, Helguera, Fahima and Dubcovsky2003, Reference Yan, Loukoianov, Blechl, Tranquilli, Ramakrishna, SanMiguel, Bennetzen, Echenique and Dubcovsky2004, Reference Yan, Fu, Li, Blechl, Tranquilli, Bonafede, Sanchez, Valarik, Yasuda and Dubcovsky2006; Kippes et al., Reference Kippes, Debernardi, Vasquez-Gross, Akpinar, Budak, Kato, Chao, Akhunov and Dubcovsky2015). Photoperiod is primarily determined by the three homoeologous loci, Ppd-A1, Ppd-B1, and Ppd-D1, which are located on the short arms of chromosomes 2A, 2B, and 2D, respectively, and they play an important role in determining HD in response to daylength, with dominant alleles controlling early heading (Law, et al., Reference Law, Sutka and Worland1978; Scarth and Law, Reference Scarth and Law1983). Earliness per se is controlled by several quantitative trait loci (QTL; Cockram et al., Reference Cockram, Jones, Leigh, O'Sullivan, Powell, Laurie and Greenland2007).
Thanks to the development of molecular marker technology, an increasing number of genetic maps and QTL are now readily available, which are useful tools in molecular breeding programmes. Quantitative trait loci mapping in wheat has provided powerful tools for elucidating the genetic basis of important agronomic traits including yield and its components, such as plant height, grain weight and grain number (Huang et al., Reference Huang, Cloutier, Lycar, Radovanovic, Humphreys, Noll, Somers and Brown2006; Maphosa et al., Reference Maphosa, Langridge, Taylor, Chalmers, Bennett, Kuchel and Mather2013; Cui et al., Reference Cui, Zhao, Ding, Li, Wang, Li, Bao, Li and Wang2014). Several QTL for HD and FD have been identified in different wheat mapping populations (Xu et al., Reference Xu, Bai, Carver and Shaner2005; Kuchel et al., Reference Kuchel, Hollamby, Langridge, Williams and Jefferies2006; Baga et al., Reference Baga, Fowler and Chibbar2009; Le et al., Reference Le Gouis, Bordes, Ravel, Heumez, Faure, Praud, Galic, Remoué, Balfourier, Allard and Rousset2012). Xu et al. (Reference Xu, Bai, Carver and Shaner2005) detected a major QTL for HD on chromosome 2DS using a recombinant inbred line (RIL) population, which explained 40.5% of the phenotypic variance across 3 years. Kuchel et al. (Reference Kuchel, Hollamby, Langridge, Williams and Jefferies2006) identified seven QTL for HD on different chromosomes in a doubled haploid (DH) population. Baga et al. (Reference Baga, Fowler and Chibbar2009) identified 11 genomic regions associated with floral transition, length of vegetative growth and FD in a winter wheat DH population. Le et al. (Reference Le Gouis, Bordes, Ravel, Heumez, Faure, Praud, Galic, Remoué, Balfourier, Allard and Rousset2012) detected 40 potentially different regions influencing HD and FD using a 227 accession wheat core collection. In addition, Hanocq et al. (Reference Hanocq, Laperche, Jaminon, Lainé and Le Gouis2007) identified meta-QTL controlling HD on 4A and 4B according to the results of previous studies. Griffiths et al. (Reference Griffiths, Simmonds, Leverington, Wang, Fish, Sayers, Alibert, Orford, Wingen, Herry, Faure, Laurie, Bilham and Snape2009) identified 19 meta-QTL for HD using four DH populations.
Until now, most QTL studies have considered additive and dominance effects, but epistatic interactions between two or more loci are commonly ignored. Epistasis is important for understanding the genetic basis of complex traits and the role of epistasis in the genetic architecture of quantitative traits is controversial. Mackay (Reference Mackay2014) showed that epistasis was common, and that additivity can be an emergent property of underlying genetic interaction networks. Numerous regions with epistatic effects have been detected recently (Roncallo et al., Reference Roncallo, Cervigni, Jensen, Miranda, Carrera, Helguera and Echenique2012; Yadava et al., Reference Yadava, Arumugam, Mukhopadhyay, Sodhi, Gupta, Pental and Pradhan2012; Xu et al., Reference Xu, Li, Li, Zhang, Xu and An2013; Jiang et al., Reference Jiang, Schmidt, Zhao and Reif2017). Most of the previous QTL studies for HD and FD mainly focused on additive effects and limited information has been available on the role of epistasis in controlling HD and FD.
In the current study, QTL analysis for HD and FD in multiple environments was conducted using three related RIL populations. The objectives of the current study were to detect QTL with additive and epistatic effects for HD and FD in different environments, and to reveal the genetic relationships between HD/FD and the five yield-related traits. In addition, QTL clusters for HD/FD and yield-related traits (YRTs) were identified. The current study lays a genetic foundation for wheat molecular breeding programmes.
Materials and methods
Experimental materials and evaluation
Three F9 RIL populations derived from crosses between four common Chinese wheat varieties, namely, Weimai 8 × Luohan 2 (WL), Weimai 8 × Yannong 19 (WY) and Weimai 8 × Jimai 20 (WJ) comprising 179, 172 and 175 lines, respectively, were used. Weimai 8 was released by the Weifang Municipal Academy of Agricultural Sciences, Shandong, in 2003. Luohan 2 was released by the Crop Research Institute, Luoyang Municipal Academy of Agricultural Sciences, Henan, in 2001. Yannong 19 was a strong gluten, high-quality wheat variety, which was released by the Yantai Municipal Academy of Agricultural Sciences, Shandong, in 2001. Jimai 20 was released by the Crop Research Institute, Shandong Academy of Agricultural Sciences in 2003. All of the materials were created and conserved by Tai'an Subcentre of the National Wheat Improvement Centre.
The three related RIL populations together with their parents were evaluated in four environments in Shandong province, China: Tai'an in 2008/09 (E1, 36°11′ N, 117°04′ E, 126 m a.s.l.), Tai'an in 2009/10 (E2), Zao'zhuang in 2009/10 (E3, 34°48′ N, 117°18′ E, 70 m a.s.l.) and Ji'ning in 2009/10 (E4, 35°24′ N, 116°34′ E, 41 m a.s.l.). The four environments have been detailed in previous reports (Cui et al., Reference Cui, Zhao, Ding, Li, Wang, Li, Bao, Li and Wang2014). The WL-RILs and parental lines were evaluated only in E2 and E4. Limited by the large workload involved in conducting phenotype identification, the RILs and the four parental lines were planted in a single replication at each environment. Normal agricultural practices were applied for irrigation, disease and weed control, etc.
Heading date was recorded as the number of days from sowing to 50% of ears fully emerging in a plot, corresponding to the growth stage (GS) 55 in Zadoks et al. (Reference Zadoks, Chang and Konzak1974). Flowering date was recorded as the number of days from sowing to 50% of flowering ears fully emerging in a plot, corresponding to GS61 in Zadoks et al. (Reference Zadoks, Chang and Konzak1974). Moreover, YRTs including grain length (GL), grain width (GW), thousand-grain weight (TGW), grain number per ear (GNPE), ear number per plant (ENPP), grain weight per plant (GWPP) and grain weight per ear (GWPE) were evaluated. Detailed information about the YRTs is given in Cui et al. (Reference Cui, Zhao, Li, Ding, Li, Bao, Li, Ji and Wang2013, Reference Cui, Zhao, Ding, Li, Wang, Li, Bao, Li and Wang2014).
An integrative genetic map
An integrative genetic map was constructed using the WL, WY and WJ populations (Cui et al., Reference Cui, Zhao, Ding, Li, Wang, Li, Bao, Li and Wang2014). The map consisted of 1127 loci distributed across all 21 wheat chromosomes and covered 2976.75 cM with an average distance of 2.64 cM between adjacent loci. It included 576 diversity arrays technology marker loci, 496 of which were common to at least two maps.
Data analysis and quantitative trait loci mapping
Basic statistical analysis of phenotypic data in the three RIL populations was performed using the SPSS13.0 software (SPSS, Chicago, IL, USA; http://en.wikipedia.org/wiki/SPSS). Heritability (H 2) was calculated according to Cui et al. (Reference Cui, Zhao, Ding, Li, Wang, Li, Bao, Li and Wang2014):
 $$H^2\, = \, 1 \,-\,M{\rm 2}/M{\rm 1}$$
where M1 and M2 indicate the variance of genotype and genotype × environment, respectively. Due to the number of replications (r = 1), it was impossible to estimate genotype × environment interaction variance in the present study. The mean variance for residual error was represented as M2. The Pearson correlations of HD/FD among the four/two environments in the three mapping populations were calculated, with the aim of evaluating the effect of genotype on phenotypic variation. To evaluate the effects of HD/FD on YRTs, Pearson correlations were calculated between HD/FD and YRTs.
The directly investigated phenotypic values were used for QTL analysis. Inclusive composite interval mapping, performed with IciMapping 4.1 (http://www.isbreeding.net/), was used to detect putative additive QTL and epistatic additive QTL. The phenotypic values of the RILs in E1, E2, E3, E4 and P (where the four environments were pooled together) were used for individual environment QTL mapping in each mapping population. The walking speed chosen for all QTL was 1.0 cM, and significance was declared at P ⩽ 0.001 The threshold LOD scores were calculated using 1000 permutations with a type 1 error of 0.05. The parameter set was identical with that in Cui et al. (Reference Cui, Zhao, Ding, Li, Wang, Li, Bao, Li and Wang2014), thus ensuring the comparability of the QTL for HD/FD with these for YRTs.
Quantitative trait loci nomenclature
All of the QTL were designated as follows: An italicized letter ‘Q’ denotes ‘QTL’; the letters following the ‘Q’ and preceding the dash represent the abbreviation of the corresponding trait; the letters and numbers following the dash represent the wheat chromosome on which the corresponding QTL were distributed. When two or more QTL associated with the same trait with overlapping confidence intervals were detected in different environments, they were considered to be congruent QTL. An italicized letter ‘e’ was prefixed to distinguish epistatic QTL with no additive effect. A major QTL was defined as a QTL with an LOD value of >3.0 and a phenotypic variance contribution of >10% (the average of all the environments), a stable QTL as a QTL that showed significance in at least three of the five environments (E1, E2, E3, E4 and P) and a major and stable QTL with the characteristics of both major QTL and stable QTL. A QTL cluster was defined as three or more QTL for YRTs and HD/FD sharing confidence intervals. The QTL confidence intervals were calculated according to Lander and Botstein (Reference Lander and Botstein1989), using 1-LOD as the support intervals as 95%.
Results
Phenotypic performance of the three recombinant inbred lines
The phenotypic performance for HD and FD in the three populations and the four parental lines in the four environments are shown in Table 1 and the Supplementary material (Table S1, available at https://www.cambridge.org/core/journals/journal-of-agricultural-science). Differences existed among the four environments, indicating that environmental factors had some effects on HD and FD. The absolute values of skewness and kurtosis for HD and FD were less than 1.0 in most cases. All traits showed continuous variation in each population, indicating that they were typical quantitative traits controlled by a few minor genes and that the data were suitable for QTL analysis (Table 1, Fig. 1). The correlation coefficients of HD and FD among environments (Table 2) were all significant (P ⩽ 0.01) across environments. These results indicated that genetic effects were major factors in determining HD and FD.

Fig. 1. Phenotypic distribution of heading date (HD) and flowering date (FD) in progeny derived from WL, WY and WJ. The abscissa shows the mean values of HD/FD and the ordinate indicates the frequency of distribution. Letters below the graph indicate the mapping populations, and letters on the right indicate the corresponding traits. WL, WY and WJ represent the population derived from crosses between Weimai 8 × Luohan 2, Weimai 8 × Yannong 19, and Weimai 8 × Jimai 20, respectively. P1, P2, P3 and P4 represent Weimai 8, Luohan2, Yannong 19, and Jimai 20, respectively. The parents of each mapping population were marked by vertical arrows according to the corresponding phenotypic performance. Mean, mean value; s.d., standard deviation; N, sample size.
Table 1. Phenotypic performance for heading date (HD) and flowering date (FD) in the three populations in the four environments

a H 2: Arabic numerals in parentheses are estimated broad-sense heritabilities of the corresponding traits for WL, WJ and WY, respectively.
b E1, 2008/09 in Tai'an; E2, 2009/10 in Tai'an; E3 2009/10 in Zaozhuang; E4, 2009/10 in Jining.
c P1, Weimai 8; P2, Luohan2; P3 Yannong 19; P4, Jimai 20.
d WL, WY and WJ represent the population derived from crosses between Weimai 8 × Luohan 2, Weimai 8 × Yannong 19, and Weimai 8 × Jimai 20, respectively. Std, s.d.; –, no available data; Max, maximum value of the trait in the corresponding mapping population; Min, minimum value of the trait in the corresponding mapping population.
Table 2. Phenotypic correlation coefficients of heading date (HD) and flowering date (FD) among environments

– No available data.
a E1, 2008/09 in Tai'an; E2, 2009/10 in Tai'an; E3, 2009/10 in Zaozhuang; E4, 2009/10 in Jining.
b WL, WY and WJ represent the population derived from crosses between Weimai 8 × Luohan 2, Weimai 8 × Yannong 19, and Weimai 8 × Jimai 20, respectively.
**Significant phenotypic correlations among environments in correlation analysis at P ⩽ 0.01.
The correlation coefficients between HD/FD and the five YRTs are listed in Table 3. Thousand-grain weight was correlated negatively with HD and FD only in the WL population. Grain number per ear was correlated positively with HD in all three RIL populations, but a significant (P ⩽ 0.05) positive correlation was only seen with FD in the WY population. Genetic relationships between HD/FD and GWPE were genetic background-dependent. Ear number per plant was significantly negatively correlated with HD and FD only in the WY population at P ⩽ 0.01 and P ⩽ 0.05, respectively. GWPP was significantly (P ⩽ 0.05) positively correlated with HD only in the WJ population.
Table 3. Phenotypic correlation coefficients between heading date (HD), flowering date (FD) and yield-related traits in the three recombinant inbred lines (RIL) populations among the four/two environments

TGW, Thousand-grain weight; GNPE, Grain number per ear; GWPE, grain weight per ear; ENPP, Ear number per plant; GWPP, Grain weight per plant.
a WL, WY and WJ represent the population derived from crosses between Weimai 8 × Luohan 2, Weimai 8 × Yannong 19, and Weimai 8 × Jimai 20, respectively.
**, *, and NS: significant phenotypic correlations in correlation analysis at P ⩽ 0.01, P ⩽ 0.05 and not significant, respectively.
Putative additive quantitative trait loci for heading date and flowering date
A total of 25 putative additive QTL associated with HD and FD were detected (Table 4; Figure 2). These QTL were distributed across 17 wheat chromosomes. Of these, nine QTL were mapped to the A genome, 11 QTL were mapped to the B genome, and five QTL were mapped to the D genome. These QTL individually explained 4.25–32.51% of the phenotypic variance with LOD values ranging from 2.51 to 18.11 (Table 4).
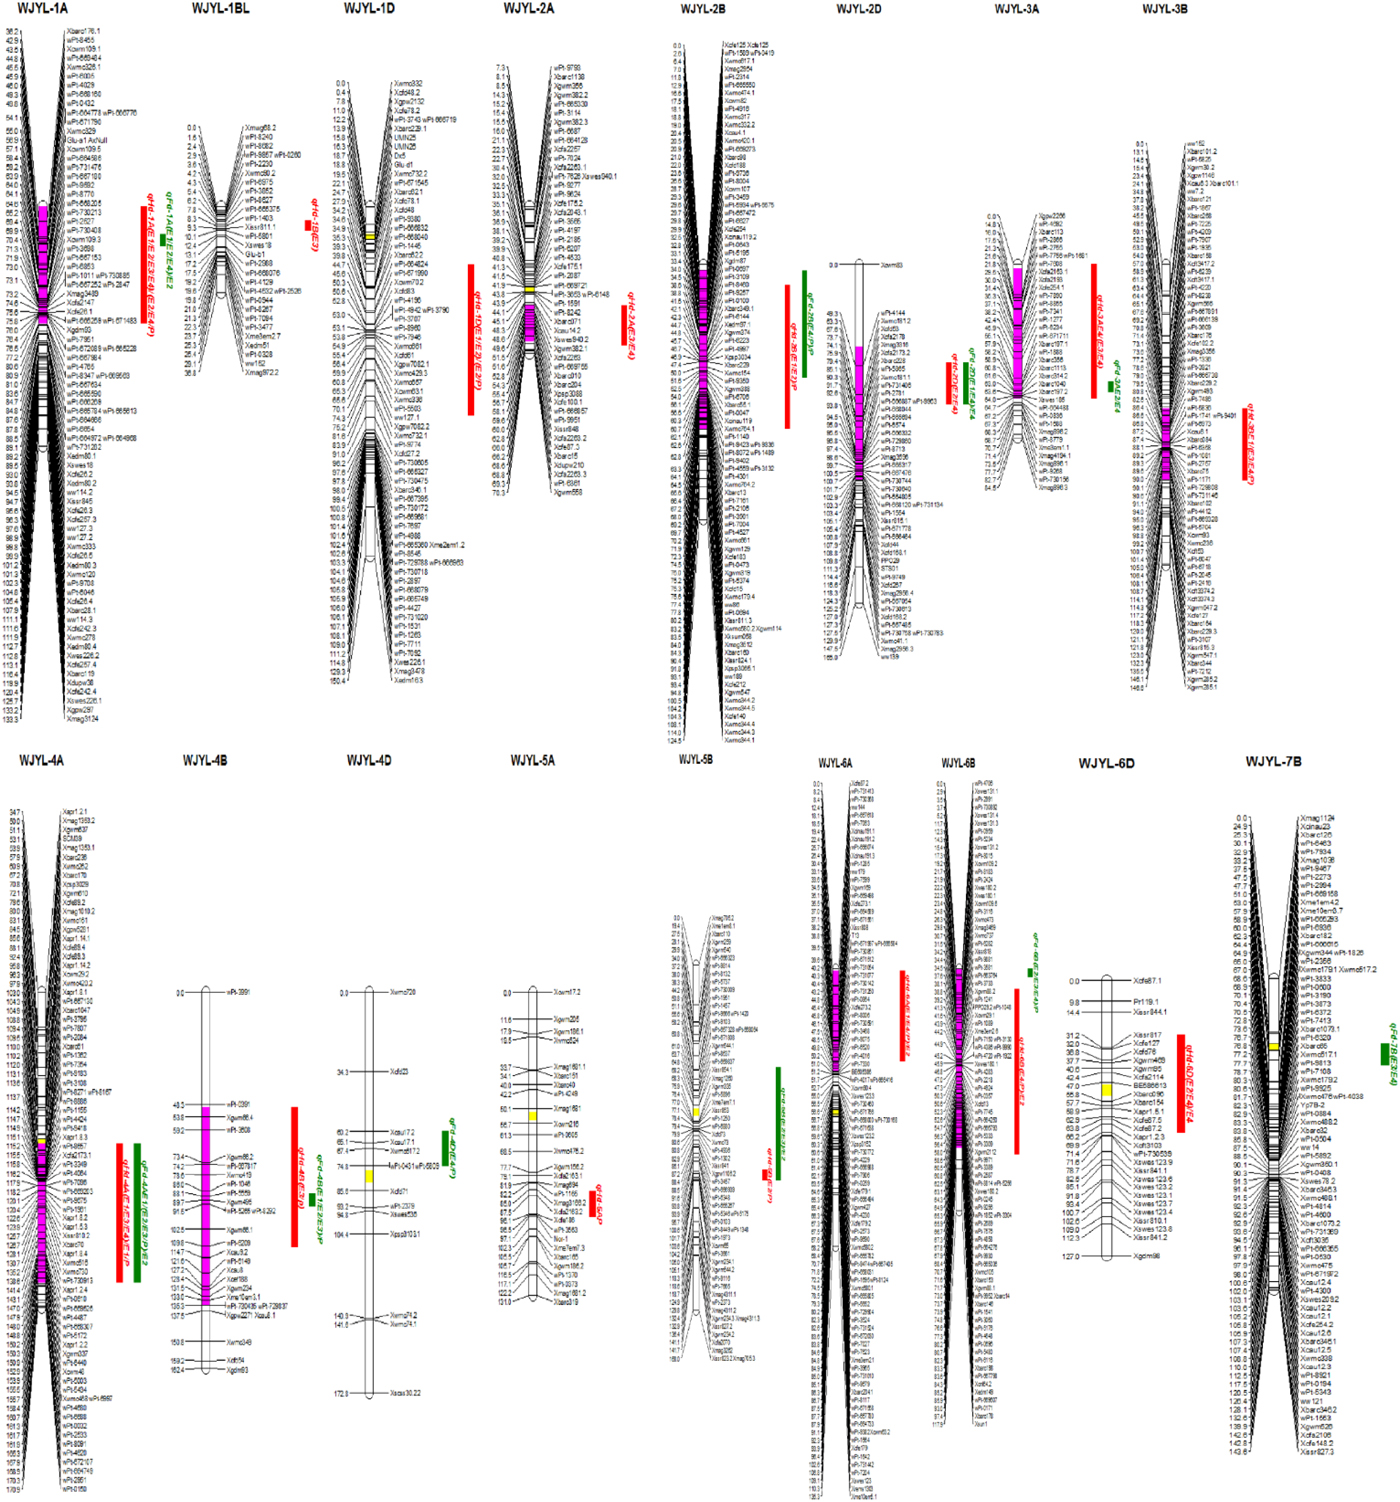
Fig. 2. The quantitative trait loci (QTL) conferring heading date (HD) and flowering date (FD) detected in four environments. Red rectangles indicate QTL associated with HD; Green rectangles indicate QTL associated with FD. Yellow fragments on the chromosomes indicate centromeres and purple fragments on the chromosomes indicate QTL clusters.
Table 4. Quantitative trait loci (QTL) with additive effects for heading date (HD) and flowering date (FD) in the three recombinant inbred lines (RIL) populations

LOD, a log-of odds; PVE, Phenotypic variation explanation.
A major QTL was defined as a QTL with an LOD value of >3.0 and a phenotypic variance contribution of >10% (the average of all the environments), a stable QTL as a QTL that showed significance in at least three of the five environments (E1, E2, E3, E4 and P) and a major and stable QTL with the characteristics of both major QTL and stable QTL.
a WL, WY and WJ represent the population derived from crosses between Weimai 8 × Luohan 2, Weimai 8 × Yannong 19, and Weimai 8 × Jimai 20, respectively.
b E1, E2, E3 and E4 represent the environments of 2008/09 in Taian, 2009/10 in Taian, 2009/10 in Zaozhuang and 2009/10 in Jining, respectively. P: the four environments pooled together.
c Add: Additive effect; Positive values indicate that the common parent Weimai 8 alleles increase the HD/FD. Negative values indicate that the common parent Weimai 8 alleles reduce HD/FD.
Fifteen QTL were identified for HD, of which 12 were major QTL (except for QHd-3A QHd-6A and QHd-6B) and ten were stable QTL (except for QHd-1B, QHd-2A, QHd-2D, QHd-5A and QHd-5B). In addition, there were seven major and stable QTL distributed on chromosomes 1A, 1D, 2B, 3B, 4A, 4B and 6D with the phenotypic variance (the average of all the environments) of 12.45, 11.33, 10.31, 13.78, 16.77, 11.83 and 13.02%, respectively (Table 4).
Ten QTL for FD were detected, of which seven were major QTL (except for QFd-2D, QFd-5B and QFd-6B) and seven were stable QTL (except for QFd-3A, QFd-4D and QFd-7B). In addition, there were four major and stable QTL distributed on chromosomes 1A, 2B, 4A and 4B with the phenotypic variance (the average of all the environments) of 11.21, 13.83, 17.81 and 17.99%, respectively (Table 4).
Estimated epistatic effects for heading date and flowering date
A total of 20 pairwise epistatic QTL associated with HD and FD were detected (Table 5). These QTL individually explained 10.42–30.27% of the phenotypic variance with LOD values ranging from 5.01–7.48 (Table 5). The current finding demonstrated that epistasis plays important roles in controlling wheat HD and FD.
Table 5. Quantitative trait loci (QTL) with estimated epistatic effects for heading date (HD) and flowering date (FD) in the three recombinant inbred lines (RIL) populations

LOD, a log-of odds; PVE, Phenotypic variation explanation.
a The underlined QTL had additive effects in addition to epistatic effect; an italicized letter ‘e’ was prefixed to distinguish epistatic QTL with no additive effect.
b WL, WY and WJ represent the population derived from crosses between Weimai 8 × Luohan 2, Weimai 8 × Yannong 19, and Weimai 8 × Jimai 20, respectively.
c E1, E2, E3 and E4 represent the environments of 2008/09 in Taian, 2009/10 in Taian, 2009/10 in Zaozhuang and 2009/10 in Jining, respectively.
d Epistatic effects, a positive value indicates that the parental two-locus genotypes have a positive effect and that the recombinants have a negative effect.
Sixteen pairwise epistatic QTL were identified for HD (Table 5), six of which (eQHd-1A.1/eQHd-7B.2, eQHd-2A/eQHd-6A, eQHd-2A/eQHd-7B.1, eQHd-4B/eQHd-7B.2, eQHd-5B/eQHd-1D, eQHd-5B/eQHd-1A.1) had no additive effects but influence the trait only through epistatic interactions. Four pairwise epistatic interactions were identified for FD, distributed on chromosomes 1D-7B, 3B-7D, 5A-5A and 6B-7B (Table 5). Of the four pairwise epistatic QTL, all except for QFd-6B/eQFd-7B had no additive effects but influence the trait only through epistatic interactions.
Quantitative trait loci on chromosome 2A (eQHd-2A) showed epistatic interaction with three genomic regions, viz QHd-5B, eQHd-6A and eQHd-7B.1, of which QHd-5B displayed additive effects. Quantitative trait loci on chromosome 5B (eQHd-5B) showed epistatic interaction with four genomic regions, viz QHd-6B, eQHd-1D, eQHd-1A.1 and QHd-2B, of which QHd-6B and QHd-2B displayed additive effects.
Quantitative trait loci clusters for heading date, flowering date and yield-related traits
The QTL mapping for the six YRTs (TGW, GL, GW, GNPE, ENPP and GWPP) was conducted by Cui et al. (Reference Cui, Zhao, Ding, Li, Wang, Li, Bao, Li and Wang2014). After a comparison of the position, ten QTL clusters simultaneously affecting YRTs and HD/FD were identified (Fig. 2, Table 6).
Table 6. The quantitative trait loci (QTL) clusters simultaneously affecting heading date (HD)/flowering date (FD) and yield-related traits (YRTs)

TGW, Thousand-grain weight; GNPE, Grain number per ear; GWPE, grain weight per ear; ENPP, Ear number per plant; GWPP, Grain weight per plant; GL, grain length; GW, grain width; HD, heading date; FD, flowering date.
A major QTL was defined as a QTL with an LOD value of >3.0 and a phenotypic variance contribution of >10% (the average of all the environments), a stable QTL as a QTL that showed significance in at least three of the five environments (E1, E2, E3, E4 and P) and a major and stable QTL with the characteristics of both major QTL and stable QTL.
a The trait name in bold type indicates that major QTLs were detected for the corresponding traits; the traits name in underline type indicates that stable QTLs were detected for the corresponding traits.
The major and stable QTL for HD (QHd-2B) and FD (QFd-2B) in C3, was co-localized with four QTL for YRTs (QTkw-2B.1, QKl-2B.1, QKw-2B.1 and QKnps-2B.2) with the favourable alleles from Weimai 8 that increased TGW, GL and GW, and reduced GNPE. Another major and stable QTL for HD (QHd-4A) and FD (QFd-4A) in C7 was co-localized with five QTL for YRTs (QSnpp-4A.1, QKwpp-4A.2, QKnps-4A, QKl-4A.1 and QTkw-4A.1) (Table 6), with the favourable alleles from Weimai 8 increasing ENPP, GWPP, SNPS and GL, and reducing TGW.
A major QTL for FD in C5 (QFd-3A) was co-localized with four QTL for YRTs (QKw-3A, QTkw-3A, QKnps-3A.1 and QKwpp-3A.3) and one stable QTL for HD (QHd-3A) (Table 6) and with the favourable alleles from Weimai 8 that increased GNPE, and reduced GW, TGW and GWPP. A major and stable QTL for FD (QFd-4B) in C8, was co-localized with two QTL for YRTs (QKnps-4B and QSnpp-4B) and one major QTL for HD (QHd-4B), with the favourable alleles from Weimai 8 that increased GNPE and reduced ENPP (Table 6).
Discussion
The expression of a stable QTL is less affected by the environment than that of an unstable one, which is thus of great value in molecular breeding programmes. In the present study, a stable QTL was verified in at least three of the five environments. A total of 25 putative additive QTL for HD and FD were identified in the current study. Of these, 47 and 40% were major and stable QTL for HD and FD, respectively, and these QTL should be paid more attention in future studies.
Comparison of additive quantitative trait loci detected in the present study with that in previous reports
Quantitative trait loci analysis for HD and FD has been performed in many previous studies. To infer whether there were common interacting QTL or regions across genetic backgrounds, the results of the current study were compared with those of previous studies on wheat. It is known that genetic position is relative rather than an absolute value. Therefore, it is hard to determine whether any two QTL detected in different mapping population were the same or not, based solely on the corresponding genetic position. Therefore, common markers or consensus integrative genetic maps are essential for conducting this comparative analysis. The high-density microsatellite consensus map reported by Somers et al. (Reference Somers, Isaac and Edwards2004) was used as a reference to perform this comparative analysis and the common chromosomal regions associated with HD/FD are presented in Table 7.
Table 7. Common chromosomal regions associated with heading date (HD)/flowering date (FD) in the present and previous studies

QTL, quantitative trait loci.
Previous studies have shown that groups 2 and 5 contain the major genes controlling Ppd series and Vrn series, respectively (Keim et al., Reference Keim, Welsh and McConnell1973; Law et al., Reference Law, Sutka and Worland1978, Reference Law, Worland and Giorgi1976). Ppd-D1 was mapped to 41.1 cM on chromosome 2D with Xgwm484 and Xwmc453 as flanking markers on chromosome 2D (Hanocq et al., Reference Hanocq, Laperche, Jaminon, Lainé and Le Gouis2007); in the current study, QHd-2D was located on the region wPt-4144–Xcfd53, which was about 9 cM from Xwmc484, so QHd-2D might be the effect of Ppd-D1 (Table 7). Hanocq et al. (Reference Hanocq, Laperche, Jaminon, Lainé and Le Gouis2007) detected the MQTL for HD and FD in the interval between 38.5 and 46.8 cM on chromosome 2B, which appeared to correspond highly to Ppd-B1. QFd-2B was detected at similar region herein. In the present study, QHd-2A was located on the long arm of chromosome 2A, and it should be different from Ppd-A1 which was located on the short arm of chromosome 2A (Griffiths et al., Reference Griffiths, Simmonds, Leverington, Wang, Fish, Sayers, Alibert, Orford, Wingen, Herry, Faure, Laurie, Bilham and Snape2009). Many loci influencing HD were located on chromosome 5B (Tóth et al., Reference Tóth, Galiba, Fehér, Sutka and Snape2003; Hanocq et al., Reference Hanocq, Laperche, Jaminon, Lainé and Le Gouis2007; Griffiths et al., Reference Griffiths, Simmonds, Leverington, Wang, Fish, Sayers, Alibert, Orford, Wingen, Herry, Faure, Laurie, Bilham and Snape2009; Le et al., Reference Le Gouis, Bordes, Ravel, Heumez, Faure, Praud, Galic, Remoué, Balfourier, Allard and Rousset2012). Vrn-B1 was mapped to 113.4 cM on chromosome 5B with Xwmc326 and Xwmc75 as flanking markers (Hanocq et al., Reference Hanocq, Laperche, Jaminon, Lainé and Le Gouis2007); in the current study, a major QTL QHd-5B explaining approximately 14.4% of the phenotypic variance was located 103 cM on chromosome 5B with wPt-1973 and Xcwm65 as flanking markers; thus, it is speculated that QHd-5B should equate to Vrn-B1. Alternatively, they are HD effects linked to Vrn-B1. Tóth et al. (Reference Tóth, Galiba, Fehér, Sutka and Snape2003) located a FD QTL linked to the SSR locus Xwmc73 which was about 3 cM near the centromere, in the present study, a stable QTL QFd-5B was also located near the centromere of 5B, so they might be the same QTL. QHd-5A was previously mapped to an interval between 72.6 and 80.3 cM by Hanocq et al. (Reference Hanocq, Laperche, Jaminon, Lainé and Le Gouis2007); in the present study, it was mapped 88.5 cM on chromosome 5A, with Xcfa2163.1 and wPt-3563 as flanking markers, and it was different from Vrn-A1 which was located 106.5 cM on chromosome 5A (Hanocq et al., Reference Hanocq, Laperche, Jaminon, Lainé and Le Gouis2007) (Table 7).
Besides the already described genomic regions on homologous groups 2 and 5, regions on other chromosomes were compared. QHd-3A was previously mapped between 42–61 cM with Xwmc505 and Xwmc264 as flanking markers (Griffiths et al., Reference Griffiths, Simmonds, Leverington, Wang, Fish, Sayers, Alibert, Orford, Wingen, Herry, Faure, Laurie, Bilham and Snape2009; Zanke et al., Reference Zanke, Ling, Plieske, Kollers, Ebmeyer, Korzun, Argillier, Stiewe, Hinze, Beier, Ganal and Röder2014); in the present study, it was mapped to the Xgpw2266–Xbarc1113 interval (between 2.0 and 60.3 cM on chromosome 3A). Griffiths et al. (Reference Griffiths, Simmonds, Leverington, Wang, Fish, Sayers, Alibert, Orford, Wingen, Herry, Faure, Laurie, Bilham and Snape2009) mapped a HD QTL to the wPt883–Xgwm165 interval on chromosome 4D, which was approximately 10 cM distal from the confidence interval of QFd-4D reported herein. Griffiths et al. (Reference Griffiths, Simmonds, Leverington, Wang, Fish, Sayers, Alibert, Orford, Wingen, Herry, Faure, Laurie, Bilham and Snape2009) and Wang et al. (Reference Wang, Wen, Hanif, Xia, Wang, Liu, Liu, Yang, Cao and He2016) mapped a HD QTL and a candidate Eps gene, both linked with Xbarc62, which was 117 cM on chromosome 1D. In the present study, QHd-1D was mapped between 29 and 85 cM on chromosome 1D, so it was a different QTL from the two above.
Two major and stable QTL, QHd4A and QFd4A, were not reported in previous studies. This early heading and flowering QTL accounted for as high as 32.51 and 32.02% of the phenotypic variation, respectively. It should be of great value in breeding early-ripening cultivars to adapt to special cropping systems. For example, in areas where wheat-maize or wheat-soybean are popular double-cropping systems, early maturity is one of the top breeding objectives. The unfortunate reality is that the large confidence intervals of both QHd4A and QFd4A have hampered their direct use in wheat molecular breeding programmes. Further fine mapping and map-based cloning of these QTL will solve this problem.
Epistatic effects
Characterization of epistatic effects is important for understanding gene function and interaction (Boone et al., Reference Boone, Bussey and Andrews2007; Phillips Reference Phillips2008; Mackay, Reference Mackay2014). Epistatic effects can be clearly defined and verified when a combination of two mutations yield an unexpected phenotype that cannot be explained by the independent effect of each mutation. For complex traits, it is useful to analyse the variation in a mapping population established for QTL studies, by applying epistatic QTL models.
In the current study, 16 and four epistatic interactions were identified for HD and FD, respectively. These QTL explained phenotypic variance from 10.42 to 30.27%. This finding indicated that epistasis plays an important role in controlling wheat HD and FD. The study of Ma et al. (Reference Ma, Tang, Teng, Yan, Meng and Li2007) implied that many loci in epistasis may not have significant additive effects for the trait alone but may affect their expression by epistatic interaction with the other loci. In the current study, six loci for HD and three for FD did not have significant additive effects for the trait alone but affect their expression by epistatic interaction with the other loci. This finding implied that wheat molecular breeding programmes should investigate loci with epistasis only in addition to loci with additivity.
Co-localized quantitative trait loci of heading date/flowering date and yield-related traits
The location of multiple QTL in the same region affecting different traits could be attributed to the presence of a single locus with pleiotropic effects on several traits. It is useful in improving the efficiency of breeding for multiple elite traits to identify the co-localized QTL conferring multiple traits. Bogard et al. (Reference Bogard, Jourdan, Allard, Martre, Perretant, Ravel, Heumez, Orford, Snape, Griffiths, Gaju, Foulkes and Le Gouis2011) found the co-location of QTL for FD with grain yield, grain protein concentration and leaf senescence on chromosomes 2D and 7D in wheat. Huang et al. (Reference Huang, Cöster, Ganal and Röder2003) detected four QTL for yield, HD and tiller number/m2 approximated to the SSR marker Xgwm493 on chromosome 3B, and the QTL cluster on 3B (including HD, TGW and GL) in the current study was in a similar region to that of Huang et al. (Reference Huang, Cöster, Ganal and Röder2003). Mason et al. (Reference Mason, Hays, Mondal, Ibrahim and Basnet2013) found the co-location of QTL for yield components and HD near the marker Xgwm484 on chromosomes 2D. In the current study, the QTL cluster on 2D (including HD, FD, TGW, ENPP, GWPE, GL and GW) was in the wPt-4144–wPt-664805 interval, which was approximately 9 cM from Xgwm484 as reported above.
Conclusions
A total of 25 putative additive QTL and 20 epistatic additive QTL were detected in four environments, of which seven major and stable QTL for HD and four major and stable QTL for FD were found. An epistatic interaction test showed that epistasis plays an important role in controlling wheat HD and FD. In addition, ten QTL clusters (C1-C10) simultaneously controlling YRTs and HD/FD were identified. The current study laid a genetic foundation for improving yield potential in wheat molecular breeding programmes.
Supplementary material
The supplementary material for this article can be found at https://doi.org/10.1017/S0021859619000200
Financial support
The current research was supported by the Project of Shandong Province Higher Educational Science and Technology Program (J18KZ006), Shandong Provincial Science Foundation for Outstanding Youth (ZR2017JL017), National Natural Science Foundation of China (31701505, 31671673), Yantai Key Research and Development Plan (2017ZH052), Shandong Provincial Science Foundation (ZR2018PC016) and the Open Project Program (CSBAAKF2018003) of State Key Laboratory of Crop Stress Biology for Arid Areas.
Conflict of interest
None.
Ethical standards
Not applicable.