Introduction
Nutrition is generally recognized as the primary factor influencing the ruminal microbiome (Tajima et al., Reference Tajima, Aminov, Nagamine, Matsui, Nakamura and Benno2001; Belanche et al., Reference Belanche, Doreau, Edwards, Moorby, Pinloche and Newbold2012; AlZahal et al., Reference AlZahal, Li, Guan, Walker and McBride2017), although host-related factors are also known to exert an influence on the microbial composition (Weimer et al., Reference Weimer, Stevenson, Mantovani and Man2010; Henderson et al., Reference Henderson, Cox, Ganesh, Jonker, Young and Janssen2015). Diet alterations and feed additives are popular strategies to improve feed efficiency, to increase production or to lower methane emissions, but the effectiveness is often subject to between-animal variations (Woodward et al., Reference Woodward, Waghorn, Ulyatt and Lassey2001; Vlaming et al., Reference Vlaming, Lopez-Villalobos, Brookes, Hoskin and Clark2008). Differences between enteric methane emissions of ruminants on the same diet and environmental conditions (Shi et al., Reference Shi, Moon, Leahy, Kang, Froula, Kittelmann, Fan, Deutsch, Gagic, Seedorf, Kelly, Atua, Sang, Soni, Li, Pinares-Patino, McEwan, Janssen, Chen, Visel, Wang, Attwood and Rubin2014; Henderson et al., Reference Henderson, Cox, Ganesh, Jonker, Young and Janssen2015; Roehe et al., Reference Roehe, Dewhurst, Duthie, Rooke, McKain, Ross, Hyslop, Waterhouse, Freeman, Watson and Wallace2016) also suggest an influence of host-related factors on the microbial activity and possibly the microbial composition. These host-related factors can be categorized into two general groups: (i) genotype-related factors, which include those factors that could be influenced by host gene expression or genetic heritability. This group comprises, for example, the size of the rumen, which influences feed intake and passage rate; salivary excretion, which influences rumen pH; absorption of microbial end-products by the rumen epithelium and host-microbial cross-talk genes. (ii) Non-genotype-related factors include physiological state and life trajectory (early life events as birth conditions, rearing strategy, weaning, previous diets and medical treatments).
The extent to which these host-related factors play a role in shaping the rumen microbial composition can be studied by a transfer of rumen contents between cannulated cows. Such an abrupt disturbance of the ruminal microbial community allows investigation of the extent to which the host exerts an influence on rumen fermentation and the new microbial community, while the latter strives for a stable ecosystem. In the current study, rumen content transfer was performed from one donor cow to three acceptor cows and the donor cow itself. This set-up created identical inoculating conditions, i.e. the microbial community of the donor was present in each of the four acceptor cows. The rumen microbial communities were described before, during and after the rumen content transfer, with the primary focus on methanogen and bacterial community composition and its relationship to fermentation and milk production metrics. This experiment was designed to trace whether the methanogen and bacterial community would return to its original composition, if it would maintain the rumen microbial community composition of the donor or if it would evolve into a new microbial composition (Fig. 1(a)).
Fig. 1. (a) Possible influences that shape the rumen microbial community after a rumen content transfer. (b) Visualization of the rumen transfer setup. Each colour represents a host specific rumen microbiome. (c) Chronological overview of the experiment, indicating methane measurement periods and sampling moments for VFAs and DNA extraction.
Materials and methods
Animals, diet and rumen content transfer
Four multiparous (parity 2–4) rumen-cannulated Holstein Friesian dairy cows of comparable weight (608 ± 93.5 kg) and lactation stage (127 ± 10.3 days in milk) were fed a diet with the same forage-to-concentrate ratio of 70 : 30 on a dry matter basis. The forage was a mixture of pre-wilted grass and maize silage in the ratio of 58 : 42 on a dry matter basis. The concentrates consisted of a balanced compound feed, rumen protected soybean meal and feed urea (69 : 30 : 1). The chemical composition of the total diet is presented in Table 1. The rumen degradable protein balance was calculated as described by Tamminga et al. (Reference Tamminga, Van Straalen, Subnel, Meijer, Steg, Wever and Blok1994). Crude fat, crude protein and starch content, neutral detergent fibre, acid detergent fibre, acid detergent lignin, net energy and protein digested in the intestine were determined as in De Boever et al. (Reference De Boever, Goossens, Peiren, Swanckaert, Ampe, Reheul, De Brabander, De Campeneere and Vandaele2017).
Table 1. Chemical composition of the diet
NDF, neutral detergent fibre; ADF, acid detergent fibre; ADL, acid detergent lignin; NE, net energy; DPI, protein digested in the intestine; RDPB, rumen degradable protein balance.
After an adaptation period of 6 weeks, the rumen content of the highest methane-emitting cow, i.e. the donor cow, was removed completely through the cannula, divided into four equal parts in sealed 25 litre CurTec drums and kept at constant temperature in a 38 °C water bath. The rumens of three acceptor cows were emptied completely and the contents weighed then discarded. After the rumen was emptied, the rumen wall was rinsed with sterile saline solution (9 g/l sodium chloride) to remove residual fibres and fluids as completely as possible. Subsequently, one-quarter of the donor's rumen content was introduced back into the emptied rumen of the donor cow itself and the other three parts were transferred to the rumens of the three acceptor cows (Fig. 1(b)). Animals were offered forage and water immediately after transfer and 10 litres of saline solution of 38 °C was poured into the rumen through the cannula.
The transfer was regarded as time point zero. Samples were collected for volatile fatty acid (VFA) quantification before transfer (day −3), and on days 1, 2, 7, 10, 42 and 43 after transfer. Samples for DNA extraction and subsequent quantitative polymerase chain reaction (qPCR) and 16S metabarcoding were collected simultaneously with the samples for VFA analysis, and additionally on day 15, day 30 and 1 year after the rumen content transfer (Fig. 1(c)).
Methane measurements
Enteric methane (CH4) and carbon dioxide (CO2) emissions were measured by keeping the animals in individual respiration chambers (De Campeneere and Peiren, Reference De Campeneere, Peiren, Pinares and Waghorn2014) as described by Castro-Montoya et al. (Reference Castro-Montoya, Peiren, Cone, Zweifel, Fievez and De Campeneere2015). The aforementioned gas concentrations were measured in the exhaust gas from each chamber with an 8 min interval, using an INNOVA 1314 Photoacoustic Multi-gas Monitor (LumaSense Techn., Santa Clara, CA, USA). The CO2 and CH4 emissions of the experimental cows were measured during four measurement periods: before transfer (day −7 to −4), short-term (day 2–5), mid-term (day 11–14) and long-term (day 43–46) after transfer. Before the start of the trial, a recovery test of the gas analyser confirmed 100% recovery of the calibration gases. No recovery tests were performed per chamber before or after this trial because previous tests have shown very stable results (N. Peiren, personal communication).
Sample collection
On each sampling day, six samples were collected at 07.45, 08.45, 10.00, 11.30, 14.00 and 17.00 h to account for diurnal changes of VFA. Animals were fed twice daily, immediately after sample collection at 07.45 and 17.00 h. Rumen fluid was collected through the cannula using a vacuum pump connected to a metal perforated sampling probe. To increase representativeness of the sample, the probe was moved several times to collect fluid from different regions in the rumen. The rumen fluid (around 200 ml) was collected in an Erlenmeyer. The pH was measured with a mobile pH meter and the rumen fluid was supplemented subsequently with three drops of toluene to cease microbial activity. Rumen fluid (10 ml) from each sampling time was pooled for VFA analysis. The samples were stored at −20 °C prior to analysis. During sample collection at 08.45 h, an additional rumen fluid sample was collected for DNA extraction. In the lab, a 500 µl subsample was transferred to a cryovial and stored at −80 °C.
Volatile fatty acid measurements
The VFA measurements were carried out using a protocol derived from Getachew et al. (Reference Getachew, Makkar and Becker2001) using an EC-1000 capillary column on a Varian® 3900 gas chromatograph (Varian Analytical Instruments, Walnut Creek, CA, USA) with Compass software. The laboratory procedures for processing and analysing rumen samples for VFA detection are accredited under the BELAC ISO17025 norm (ILVO-DIER-ANIMALAB; certificate number: BELAC T-315).
DNA extraction
DNA extraction was performed with the repeated bead beating plus column (RBB+C) protocol, as described by Yu and Morrison (Reference Yu and Morrison2004), with minor adaptations. Cells were ruptured in a FastPrep-24 (MP Biomedicals, Solon, OH, USA) (two times 45 s, 6 m/s) using 0.4 g autoclaved zirconia beads (∅ = 0.1 mm) and in the presence of a lysis buffer, adopted from Vilchez-Vargas et al. (Reference Vilchez-Vargas, Geffers, Suárez-Diez, Conte, Waliczek, Kaser, Kralova, Junca and Pieper2013). Further extraction steps were carried out as described by Yu and Morrison (Reference Yu and Morrison2004). DNA quality and quantity were checked subsequently with a Nanodrop ND-1000 (Thermo Scientific, Wilmington, DE, USA) and the Quantus double-stranded DNA assay (Promega, Madison, WI, USA).
16S rDNA amplicon sequencing and data processing
Metabarcoding of the bacterial V3–V4 and the methanogen V6–V8 variable region of the 16S rRNA gene was performed on samples collected on ten sampling days from the four experimental cows (n = 40) on an Illumina MiSeq PE300. Preparation of the amplicons and processing of the sequenced reads were carried out as described by De Mulder et al. (Reference De Mulder, Goossens, Peiren, Vandaele, Haegeman, De Tender, Ruttink, Van de Wiele and De Campeneere2017). The raw sequence data are stored in the National Center for Biotechnology Information (NCBI) Sequence Read Archive (SRA), accession number PRJNA378589. The processing procedure resulted in an average of 72 384 reads per sample, with an average read length of 418 bp for the bacterial dataset and an average of 22 219 reads per sample, with an average read length of 451 bp for the methanogen dataset.
Downstream amplicon sequencing analysis
Shannon–Wiener diversity, Simpson diversity indices and observed richness were calculated with the Phyloseq package in R (McMurdie and Holmes, Reference McMurdie and Holmes2013). For subsequent data analysis, only operational taxonomic units (OTU) representing at least 0.1% of the total community in at least one sample were retained, thus reducing the total number of OTUs from 2488 to 678. The betadisper function was used to ascertain the multivariate spread of the data. If homogeneity of the group dispersions was fulfilled, differences between communities from samples collected at different time points or from different cows were analysed by permutational multivariate analysis of variance (PERMANOVA), using the adonis function in the R package Vegan (Oksanen et al., Reference Oksanen, Blanchet, Kindt, Legendre, Minchin, O'Hara, Simpson, Solymos, Stevens and Wagner2015). Bar charts on a family level were constructed per animal and per sampling point, based on the OTU table with cut-off at 0.1%. A heatmap of the sample-wide abundance-sorted OTU table was generated using the heatmap.2 function of the R package gplots. Samples were clustered with the unweighted pair-group method using arithmetic averages (UPGMA) based on Bray–Curtis dissimilarities.
Quantitative polymerase chain reaction
The qPCR analysis was carried out with a LightCycler 480 Real-time PCR System (Roche Diagnostics, Penzberg, Germany) using SYBR Green technology. Duplicate samples of a 100-fold dilution of the DNA extracts were analysed for the absolute abundance of total methanogens and eubacteria. Methanogen specific primers were obtained from Hook et al. (Reference Hook, Northwood, Wright and McBride2009) and eubacterial primers from Ovreas et al. (Reference Ovreas, Forney, Daae and Torsvik1997). Each reaction mixture contained, in a total volume of 20 µl; 10 µl GoTaq® qPCR Master Mix (Promega, Madison, WI, USA), 7.5 pmol of each primer and 5 µl of template DNA. The PCR programme was carried out in a two-step thermal cycling process that consisted of a hot start activation step of 10 min at 94 °C, followed by 40 cycles of 15 s at 95 °C and 1 min at 60 °C. Melting curve analysis was conducted over a range of 60–95 °C in steps of 0.3 °C/s to assess specificity of the amplification products. Within each run, a standard curve was constructed using a 10-fold dilution series of plasmid or gBlock DNA (IDT, Leuven, Belgium), containing a strain specific sequence. The total number of gene copies was calculated by converting the quantification cycle values (C q) to gene copy abundances, taking PCR efficiency into account.
Results
Milk production and dry matter intake
The four cows differed in their response to the rumen content transfer at the level of feed intake and milk production as shown in Fig. S1. Over the whole trial period, the four cows showed large fluctuations in milk production (Fig. S1). These fluctuations are caused by a combination of factors such as fluctuations in dry matter intake (DMI), changing housing conditions and stress during the rumen content transfer and in the respiration chambers. All four cows had a large drop in milk production in the 2 weeks after the transfer. In the 6-week period before rumen content transfer, the donor cow had the lowest average milk yield but showed a slightly increasing trend in the 6 weeks following transfer. The milk yield of acceptor cow 1 was restored gradually from week 9 onwards. The milk productions of acceptor cows 2 and 3, however, did not recover fully from the decline seen shortly after transfer.
The donor cow and acceptor cow 3 suffered from a depression in feed intake during the 2 days following the rumen content transfer. In subsequent days, feed intake recovered for the donor cow, but remained about 20% lower for acceptor cow 3 in the 2 weeks following the transfer (Fig. S1).
Fermentation metrics: methane and volatile fatty acids
Prior to the rumen content transfer, baseline methane emissions were determined for the four cows. The donor cow had, on average, a 10.2% higher methane emission (g CH4/kg DMI) compared with the other three cows. Following the rumen content transfer, methane emissions of the donor and acceptor cow 3 initially decreased (short term) and were partly restored at the mid- and long-term measurements, although both cows remained below their original levels. The rumen transfer did not affect methane emission levels of acceptor cows 1 and 2. However, during the long-term measurement, acceptor cow 1 had a higher absolute emission whilst feed intake remained unchanged, resulting in an increased methane production per unit of DMI (Fig. 2(a)). The CH4 : CO2 ratio is an effective variable expressing the efficiency of microbial fermentation and is inversely correlated with the feed conversion efficiency (Madsen et al., Reference Madsen, Bjerg, Hvelplund, Weisbjerg and Lund2010). During each measurement period, the donor cow always had the lowest ratio and acceptor cow 2 the highest. The ratio values of the donor cow and acceptor cow 3 followed a similar profile to that observed for CH4 per DMI. Similarly, both cows remained below their original levels (Fig. 2(b)).

Fig. 2. (a) Methane production per kg DMI and (b) the ratio of methane to CO2 at different times after rumen content transfer.
Generally, the cows had relative VFA proportions that approached a 60 : 20 : 20 ratio for acetate, propionate and butyrate. Directly following the rumen content transfer, the acetate portion was reduced for the next 2 days. The average decrease was more pronounced for the donor cow and acceptor cow 3 (−8.5%) as compared with acceptor cows 1 and 2 (−4.6%). Simultaneously, the propionate and butyrate portions increased slightly (+4.3 and +1.5%) and the valerate portions more than doubled (+3.4%) for the donor cow and acceptor cow 3 while the increases were less for acceptor cows 1 and 2 (+2.0, +0.9 and +0.4% for acetate, butyrate and valerate). These alterations were temporary and in subsequent sampling days the VFA proportions started to return to their original values (Fig. 3).

Fig. 3. Percentage share of the main VFAs in the rumen fluid: acetate, butyrate, propionate and valerate in function of sample time. The arrow indicates the rumen content transfer (day 0).
Bacterial and methanogen community
In the complete datasets, a total of 19 OTU were annotated as Methanoarchaea and 2393 OTU as Bacteria.
The bar chart at the family level (Fig. 4) shows, overall, similar profiles between different cows and different sample collection times, except that the profiles of the donor cow and acceptor cow 3 deviated from the other samples and other cows at sampling points d1 and d2 immediately after the rumen content transfer. In these specific samples, the relative abundances of the families of Prevotellaceae, Bifidobacteriaceae, Veillonellaceae and Erysipelotrichaceae increased whereas the relative abundances of Fibrobacteraceae, Christensenellaceae, Ruminococcaceae, BS11 gut group and Rikenellaceae decreased.
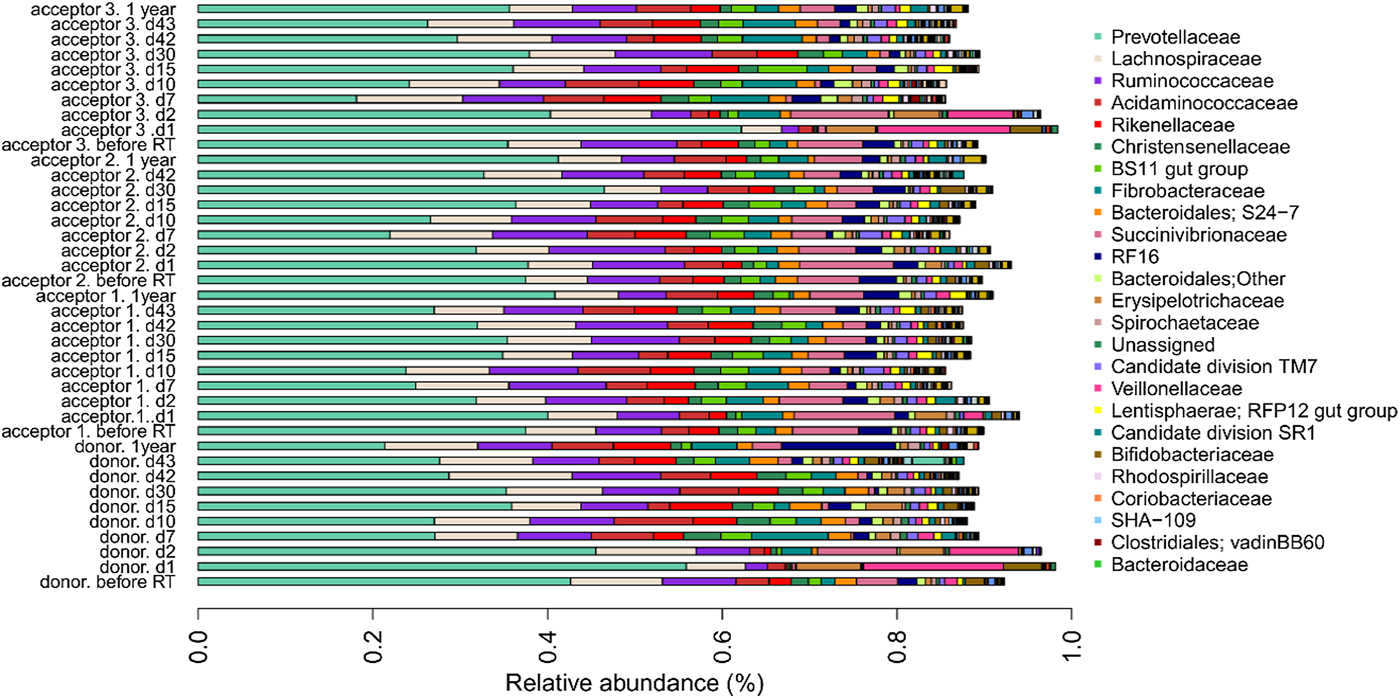
Fig. 4. Relative OTU abundance of four cows (one donor, three acceptors) subjected to rumen content transfer. Bar chart shows the relative abundance of OTUs at the family level. Only OTUs with a relative abundance above 0.1% in at least one of the samples are shown.
Bacterial richness in the rumens of the donor cow and acceptor cow 3 decreased from around 1500 to 800 OTU in the 2 days following the transfer. Concomitantly, the evenness decreased as a few species gained dominance. Combined with the lower richness, this caused a major decrease of the Shannon and Simpson diversity measures (Fig. 5(a)).

Fig. 5. Richness, expressed as the observed number of OTUs, Simpson diversity and Shannon diversity of (a) bacterial and (b) methanogen populations at different time points. The arrow indicates the rumen content transfer (day 0).
PERMANOVA using the Bray–Curtis dissimilarities indicated significant differences between sampling days (not taking into account day 1 and day 2). The community profiles of the samples collected before the transfer were significantly dissimilar from the samples collected on all other sampling days (P < 0.05). The community profiles observed at day 7 and day 10 were significantly (P < 0.05) dissimilar from day 15 and day 30. The community profiles observed at day 15 were significantly dissimilar from day 30, day 42, day 43 and after 1 year, while day 30 only differs from 1 year (P < 0.05). These community differences are visualized using a heatmap with sample clustering according to Bray–Curtis dissimilarities (Fig. 6(a)). Before the rumen content transfer, the bacterial profiles of the acceptor cows were similar. The first 2 days after rumen content transfer, the bacterial community compositions of acceptor cows 1 and 2 showed striking similarities with that of the donor before transfer. The richness and diversity of the bacterial communities of the donor and acceptor cow 3 dropped immediately following the rumen content transfer, while about 50 novel OTUs gained temporary dominance. Noticeably, the enriched OTUs in these samples were identified as Prevotella bryantii (OTU-1; mean relative abundance increased from 0.84 to 46.5%), Sharpea azabuensis (OTU-28; from 0.0 to 5.6%), Megasphaera elsdenii (OTU-5; from 0.0 to 10.6%), Ruminococcus bromii (OTU-20; from 0.2 to 1.7%) and Streptococcus bovis (OTU-325; from 0.0 to 0.7%) by individually matching the reference sequence for each OTU with the NCBI database (nBLAST) and Ribosomal Database Project (RDP, Sequence Match) (species levels are only reported in case of 100% sequence coverage and 100% identity on both databases) (Table 2). In the following week, the bacterial population evolved towards a new steady state and from day 10 and onwards, the bacterial profiles of all cows were determined by the sampling day and the host animal. The heatmap shows bacterial abundance (Fig. 6(a) and Fig. S2) thus suggests a continuous and dynamic change in bacterial community comprising a core of constitutive OTUs with high-relative abundances and groups of temporarily abundant OTUs, which succeed each other through time. A moving window analysis of the similarities between communities at consecutive sampling points (Figs 7 (a–c)) indicates that the community changes around 20–40% between each consecutive sampling time.
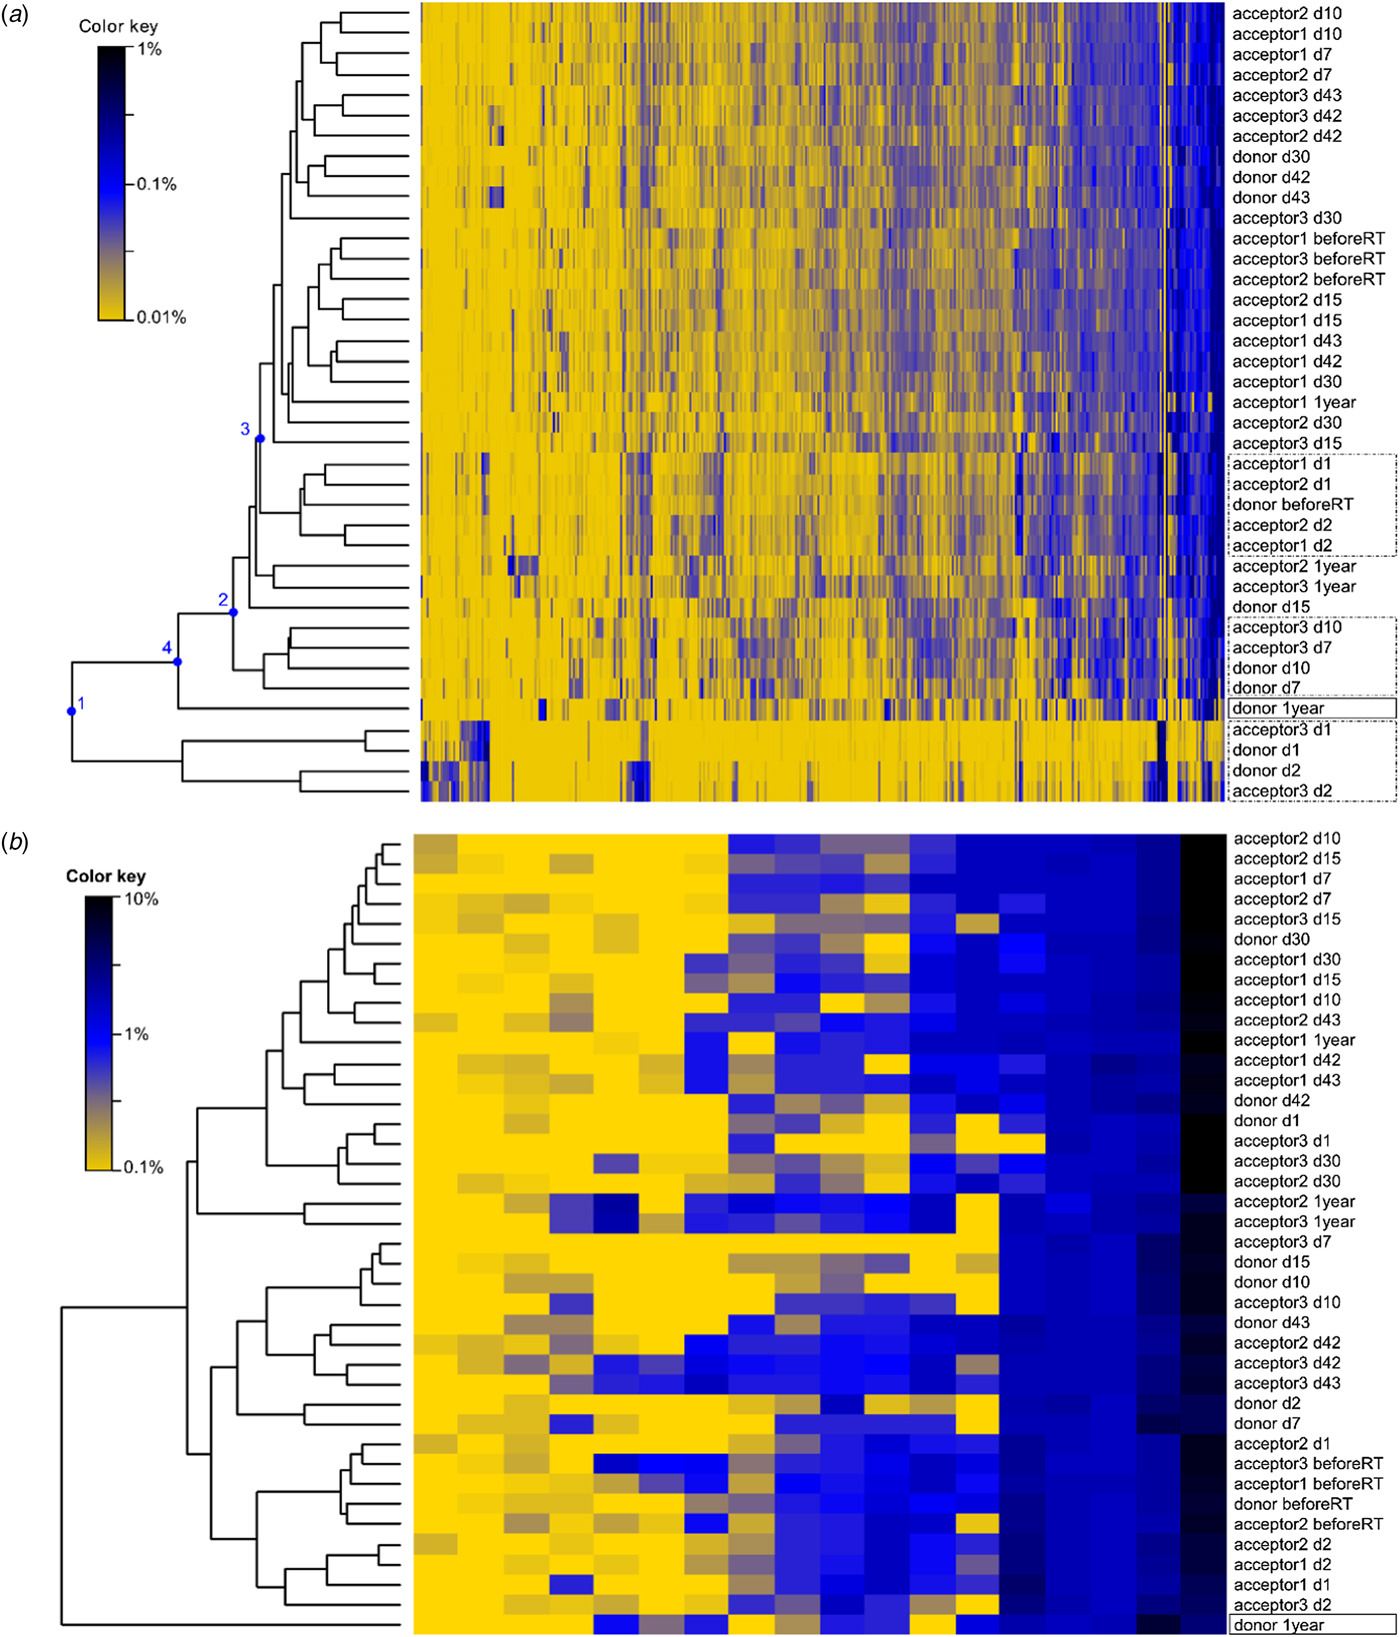
Fig. 6. Heatmap of the (a) bacterial OTUs (vertical) and of the (b) methanogen OTUs in the rumen samples of four cows. The dendrogram indicates the community resemblance between samples based on UPGMA clustering and the Bray–Curtis dissimilarity matrix. After transfer, the donor cow and acceptor cow 3 suffered from feed intake deprivation which is reflected in the bacterial community profile, as they cluster separately (node 1). The samples collected on day 7 and 10 (node 2) of the donor cow and acceptor cow 3 cluster separately form the samples from later time points and from other cows, suggesting that the rumen bacterial communities of these cows were still recovering. The samples collected from the acceptor cows before rumen transfer cluster together and separately from the donor sample before transfer. The first and second day after transfer, the bacterial profiles of acceptor cows 1 and 2 are similar to that of the donor cow before transfer (node 3). From day 7 and onwards, the bacterial community finds a new equilibrium and the position is seemingly determined by the host animal and the sampling times. Both the bacterial and methanogen community from the donor 1 year after the rumen transfer is dissimilar (node 4) from the other observed communities. During that period, the donor cow was in a different physiological stage. She was fed a dry-cow diet consisting of corn silage and straw and had a lower DMI. The acceptor cows were already in a new lactation cycle and back on a lactation diet, similar to the diet given during the experiment.
Fig. 7. (a) Moving window analysis of the community similarities, (b) chronologic similarity progression of the microbial community as compared with the original community of that community before transfer and (c) compared with the original community of the donor cow before the transfer.
Table 2. List of the dominant OTUs detected in the samples one day after transfer in the cows suffering from physiological stress and feed intake deprivation (donor cow and acceptor cow 3)

a Average over all samples, but excluding the samples collected on day 1 and 2 from donor and acceptor cow 3.
The Methanoarchaeal population was dominated by a mere four OTUs: two OTUs of the Methanobrevibacter gottschalkii clade (mean averaged abundance of 58 ± 12.3%) and Ruminantium clade (20 ± 9.2%), one OTU of the Methanosphaera (6 ± 2.5%) and one OTU of the family of the Methanomassiliicoccaceae (8 ± 8.7%). In the days following the transfer, the donor cow and acceptor cow 3 had a depression in feed intake. In the corresponding time frame, small decreases in methanogen richness and diversity were observed for these two cows. In contrast, no influence was detected in the absolute quantity of bacteria and methanogens (Fig. 8) nor on the methanogen community profiles (Fig. 6(b)). Only the sample of the donor cow collected 1 year after the rumen content transfer differs from the other samples (Fig. 6(b)).

Fig. 8. Absolute quantity of bacteria (open symbols) and methanogens (closed symbols) at different time points, expressed as 16S gene copies/ng DNA extract. The arrow indicates the rumen content transfer (day 0).
Discussion
The rumen microbiome comprises bacteria, archaea, fungi and protozoa, each represented by various numbers of different species and working side-by-side, in close synergetic relationships or in competition with one another. The establishment of this population is driven by many complex factors. In particular, the rumen microbial community is shaped by diet composition, environmental factors and host-related factors, and these factors are interrelated. Weimer et al. (Reference Weimer, Stevenson, Mantovani and Man2010) was the first to investigate the stability and host specificity of the rumen bacterial community following a near-complete exchange of rumen content between two pairs of cannulated cows. Using ARISA fingerprinting of the bacterial community, Weimer et al. (Reference Weimer, Stevenson, Mantovani and Man2010) determined that the community re-established a profile that resembled the original profile from before the exchange. In analogy, the current experiment was designed to describe in detail the temporal change in bacterial community before during and after rumen content transfer. Compared with Weimer et al. (Reference Weimer, Stevenson, Mantovani and Man2010), the current study aims to remove the rumen content of the donor as completely as possible. After the rumen was completely emptied, the rumen wall was rinsed to remove residual fluid and fibres. Complete emptying of the rumen had the advantage that no original rumen content was left, and that the new microbiome had no competition from the original microbiome. On the other hand, the whole procedure, including rinsing of the rumen wall with sterile saline solution took more time (and as a consequence the rumen was empty for a longer time) and was more invasive for the animal than partial removal of the rumen content would have been. The procedure might have caused stress to the animal, resulting in reduced feed intake and milk production in the days following the transfer. The rumen contents from one donor were divided into four equal parts and transferred to the donor cow and three acceptor cows. By this set-up, identical inoculation conditions were created during transfer, i.e. the microbial community of the donor was present in each of the four experimental cows. In addition, 16S metabarcoding was used for analysis of the rumen microbiome composition instead of the community fingerprinting technique ARISA used in Weimer et al. (Reference Weimer, Stevenson, Mantovani and Man2010).
Despite each cow receiving identical rumen content (one-quarter of the donor cow's rumen content) in exchange for their own whole rumen contents, in the first 2 days after transfer two distinct responses were observed: (1) the rumen functioning and feed intake of acceptor cows 1 and 2 were not affected negatively by the rumen transfer and the new rumen bacterial community composition was influenced mainly by the introduction of a non-indigenous bacterial community and host effects. (2) The bacterial community after transfer was influenced by both the introduction of a non-indigenous bacterial community as well as short-term physiological stress and reduced feed intake, which was the case for the donor cow and acceptor cow 3. The physiological stress was presumably due to severe perturbation of the rumen function during the transfer. While removing the rumen contents, the rumen filled with air. The elevated oxygen levels could have disturbed the fermentation activity until anaerobic conditions were restored in the rumen. Furthermore, the emptying and inoculation with only a quarter of rumen contents might have induced a temperature shock (increased by the winter temperatures). The combined effect of these factors might have resulted in physiological stress and reduced feed intake, which translated into major effects on milk yield, methane production and the microbial community. Fortunately, the samples collected during this period provide a unique insight into the resilience of the rumen microbiome and the way in which the microbial community is restored after a perturbation. In the 2 days following transfer, the bacterial richness dropped from 1500 to 800 OTU in the donor cow and acceptor cow 3. While most OTU remained below detection levels, the remaining bacterial community consisted of a core group of OTU that was observed in all samples, as well as novel OTU that gained dominance during the period of feed intake depression and physiological stress. The overall lower feed intake and the preference towards concentrate resulted in elevated proportions of starch and an increased ruminal turnover rate. These conditions imposed selection for bacteria with fast heterofermentative growth, mainly amylolytic species. S. azabuensis and S. bovis proliferated under these circumstances, presumably producing lactic acid as primary metabolic end-product (Russell and Hino, Reference Russell and Hino1985; Morita et al., Reference Morita, Shiratori, Murakami, Takami, Toh, Kato, Nakajima, Takagi, Akita, Masaoka and Hattori2008), which in turn induced the growth of lactate-utilizing M. elsdenii (Prabhu et al., Reference Prabhu, Altman and Eiteman2012). Concomitantly, non-lactic acid producing starch utilizers, P. bryantii and R. bromii, proliferated and competed for starch. The competition between non-lactic acid bacteria and lactic acid bacteria, and the interaction between lactic acid production and consumption, is essential for avoiding ruminal acidosis. Consequentially, the rumen pH did not decrease below daily averages of 6.4 during the period of feed intake depression. The altered microbial community profile, mainly dominated by M. elsdenii and P. bryantii is reflected in the decreased acetate-to-propionate ratio, the increased proportions of valerate and the decreased efficiency of microbial fermentation as indicated by the lowered CH4 : CO2 ratio. In contrast to the bacterial diversity, qPCR analysis did not indicate a decrease in absolute numbers of bacteria. This contradiction suggests that the abundance of bacteria in the rumen fluid were restored rapidly after transfer (within 24 h) by the rapidly growing bacteria that dominated the rumen community during the period of feed intake depression, consuming easily fermentable carbohydrates and stabilizing the ambient conditions of the rumen microbial ecosystem, which primed the way for slow-growing bacteria (cellulolytic species) and cross-feeding species. This response suggests that the rumen ecosystem relies on its vast biosphere of transient and low abundant species to maintain and restore the microbial ecosystem after a severe perturbation.
In contrast to the donor cow and acceptor cow 3, the rumen function of acceptor cows 1 and 2 were only affected slightly by the rumen content transfer, with no observable effect on methane emissions, milk production, the bacterial and methanogen richness or diversity and only minor short-term changes in the VFA profiles. As a consequence of the experimental design, the rumen microbial ecosystem had to repopulate newly ingested feed, starting from one-quarter volume of transferred rumen content as inoculum, which roughly corresponds to two doublings. The main cultivated rumen bacterial species have doubling times ranging from 1 to 3 h under optimal nutritional and ambient conditions (Varel and Jung, Reference Varel and Jung1986; Nagaraja and Taylor, Reference Nagaraja and Taylor1987; Gokarn et al., Reference Gokarn, Eiteman, Martin and Eriksson1997). Theoretically, the microbial ecosystem should thus be repopulated after approximately 6 h. Indeed, the rumen bacterial profiles of acceptor cows 1 and 2 did not indicate a decrease of richness or diversity during the first days after transfer. The rumen communities of both cows initially maintained the bacterial community composition of the donor cow before transfer. However, this community did not gain a strong foothold and from day 7 onwards, the community evolved over time, with the donor community as starting point.
After a 1-week stabilization period following the rumen content transfer, where the donor cow and acceptor cow 3 recovered from feed intake depression and acceptor cows 1 and 2 initially adopted the rumen microbial profile of the donor, the four cows re-established a new steady state community profile, that neither resembled the bacterial profile of the donor nor the before-transfer profile of the host. The OTU abundance profiling suggests that the community consisted of a stable core community that was consistently present throughout the experiment. The core OTUs were complemented by a large group of transient OTU that became transiently dominant in successive stages. Presumably these allogenic successions were driven by external factors (changes in lactation stage, variation in nutritional values of diet, rumen pH and oxygen levels, stress) and predation (Winter et al., Reference Winter, Bouvier, Weinbauer and Thingstad2010; Koskella and Meaden, Reference Koskella and Meaden2013). Furthermore, the conditions of the rumen ecosystem are influenced strongly by rumen motility, rumination, outflow to the omasum and exchange of water and solutes (through saliva excretion, epithelial absorption and urea-N conservation). In this manner, the host also exerts a profound influence on the bacterial activity and possibly the community composition. However, the variance of the Bray–Curtis dissimilarities of the samples from different time points and different host (not taking into account the samples collected during the feed intake depression) was small because the main influencing factor, i.e. the diet composition, was standardized before and during the experimental period.
The bacterial community is resilient because of its high richness and functional redundancy. Although the community itself displays dynamic changes in taxonomic composition, it maintains its functional stability. In contrast to the complexity of the bacterial community, the methanogen community is represented by only a few dominant OTUs that were detected in the samples from each time point and each cow. The methanogen community is thus characterized by a very low richness and diversity but displays a stable composition over time. Within the rumen ecosystem, the methanogens are specialized in consuming hydrogen gas (H2). Hence, they occupy a very specific and consistent niche for which they do not have any significant competition. The stability of the methanogen community is evidenced by the feed intake depression of the donor cow and acceptor cow 3, which resulted in a diminished availability of H2 and consequently a lower methane emission. Even under these conditions, the methanogens maintained a stable population thanks to their high affinity for H2 and adaptation to the rumen environment.
In conclusion, the current study showed that cows respond differently to a whole rumen content transfer, both at physiological and at the rumen microbiome levels. The rumen microbiome quickly restored from this perturbation. The rumen microbiome displayed a severe drop in microbial diversity shortly after rumen content transfer and consists of a core of constitutively present species accompanied by transient species present at successive stages after the transfer. In contrast to the bacteria, the methanogen community showed to be more resilient against a perturbation despite their low diversity. Although the results give valuable information about the evolution of the microbiome after a severe perturbation, the results could not be supported by statistical tests due to limited number of available fistulated cows at a comparable physiological stage. In future, repeated whole rumen content transfer experiments with multiple hosts and donors can be performed to investigate the extent to which the host influences its own microbiome.
Supplementary material
The supplementary material for this article can be found at https:https://doi.org/10.1017/S0021859618001053.
Author ORCIDs
T. De Mulder 0000-0002-1188-330X
Acknowledgements
Special thanks to the colleagues of the technical staff for their skilled assistance, in particular Jorne Brouckaert, Seppe Holemans, Stefan Meirlaen and Sara Van Lembergen. The authors are members of the METHAGENE COST Action FA1302.
Financial support
This project was fully funded by ILVO.
Conflict of interest
None.
Ethical standards
The use of cannulated animals was in accordance with the Belgian law for care of experimental animals (Royal Decision 14.05.2010) and the experimental setup (rumen content transfer and sample collection) was approved by the Animal Ethics Committee of ILVO (EC2014/224).