


Introduction
Water deficiency is one of the most important abiotic stresses for plant growth and crop yield (Saint Pierre et al., Reference Saint Pierre, Crossa, Bonnett, Yamaguchi-Shinozaki and Reynolds2012). Drought has both direct and indirect significant effects on the economy, environment and society (Kala, Reference Kala2017). Global warming and climate change are expected to exacerbate the effects of water stress on the field crops productivity (Kang et al., Reference Kang, Khan and Ma2009). As forecasted, 1.8 billion people, accounting for 65% of the world's population, will suffer inevitably from water scarcity by 2025 (Nezhadahmadi et al., Reference Nezhadahmadi, Prodhan and Faruq2013).
Water stress negatively affects all plant growth stages and changes many biochemical and physiological processes such as photosynthesis, respiration, energy balance and nutrient uptake (Yordanov et al., Reference Yordanov, Velikova and Tsonev2000; Jones, Reference Jones2004; Ashraf et al., Reference Ashraf, Akram, Al-Qurainy and Foolad2011). Saeidi and Abdoli (Reference Saeidi and Abdoli2018) reported that water deficiency decreased both grain weight and yield in wheat. In the study by Nikolaeva et al. (Reference Nikolaeva, Maevskaya, Shugaev and Bukhov2010), it was shown that water stress reduced the grain size and weight, finally leading to the decreased grain yield (GY) of barley. Burke et al. (Reference Burke, Mahan and Hatfield1988) also stated that drought stress increased the activity of the antioxidant enzymes but reduced the respiration and photosynthesis in the plants. In drought stress conditions, the activity of the ribulose-1,5-bisphosphate carboxylase/oxygenase (RuBisCo) enzyme in the plant was decreased due to the less absorption of magnesium (Taize and Zeiger, Reference Taize and Zeiger2006). Also, the decreased absorption of magnesium and iron in drought conditions could affect chlorophyll synthesis and reduce plant chlorophyll content (Keles and Oncel, Reference Keles and Öncel2004). Bandurska and Stroinski (Reference Bandurska and Stroiński2003) have reported that due to drought stress, the proline (Pro) content of barley is doubled, which was consistent with the results obtained by the work of Mallick et al. (Reference Mallick, Gupta, Mondal and Sinha2011) on wheat.
Plants employ a wide range of mechanisms for ensuring their survival and maintaining their productivity while dealing with water stress conditions (Ashraf et al., Reference Ashraf, Akram, Al-Qurainy and Foolad2011). Nitrogen is an essential element in agriculture for crop production; it is involved in the synthesis of proteins, nucleic acids and some other important organic compounds (Ali et al., Reference Ali, Tedone, Verdini, Cazzato and De Mastro2019); as a result, nitrogen availability is crucial to gain high crop yields. Nitrogen deficiency reduces the leaf size and leaf area duration, resulting in a decrease in light reception, photosynthesis and radiation use efficiency (Liu et al., Reference Liu, Gao, Gao, Liu, Zhao and Zhang2018). The impact of nitrogen fertilizer on crop yield has been already described in several studies (Zaki et al., Reference Zaki, Hassanein, Ahmed, Ahmed and Tawifk2016; Ejigu et al., Reference Ejigu, Tana and Eticha2018). Oral et al. (Reference Oral, Kendal and Dogan2018), for instance, in their study on barley cultivars, reported that the increased nitrogen application had positive effects on the GY and yield components by increasing the vegetative growth and photosynthesis. On the other hand, the high use of nitrogen fertilizer in barley can lead to inappropriate vegetative growth, more lodging, low grain weight, lower number of spikes, delayed maturity, and more susceptibility to pests and diseases under normal irrigation conditions (Alam et al., Reference Alam, Haider and Paul2007). Van Herwaarden et al. (Reference Van Herwaarden, Farquhar, Angus, Richards and Howe1998) also showed the same results under water deficit conditions as the high use of nitrogen fertilizer under drought conditions had a negative effect on the GY of wheat. On the other side, nitrogen uptake and assimilation could also be affected by water availability (Larsen et al., Reference Larsen, Andresen, Beier, Jonasson, Albert, Ambus, Arndal, Carter, Christensen, Holmstrup and Ibrom2011). However, different varieties within a species may respond differently to nutrient absorption under drought condition (Van Herwaarden et al., Reference Van Herwaarden, Farquhar, Angus, Richards and Howe1998). Barati et al. (Reference Barati, Ghadiri, Zand-Parsa and Karimian2015) reported similar results in their experiments on the contrasting effects of nitrogen application on two barley cultivars under different moisture conditions. Therefore, the appropriate application of nitrogen, as well as, use of nitrogen-efficient genotypes may substantially improve the GY of barley plants (Vicente et al., Reference Vicente, Vergara-Díaz, Kerfal, López, Melichar, Bort, Serret, Araus and Kefauver2019). Furthermore, Potterton and McCabe (Reference Potterton and McCabe2018) and Conry (Reference Conry1995) in their experiments on the barley plant stated that sowing date and nitrogen application are influential factors on the quantity and quality of the grain.
The sowing date may affect the growth period, phenological stages and ultimately, the quantity and quality of the crop yield through changing day length, maximum and minimum temperatures, relative humidity and other environmental conditions during the growing season (Salamon, Reference Salamon2006). In addition, the sowing date has a significant contribution in determining the crop yield potential, allowing the plant to escape from adverse environmental conditions including nutrient deficiency that can limit plant growth and development (Fayed et al., Reference Fayed, El-Sarag, Hassanein and Magdy2015). Ahmed (Reference Ahmed2015) also reported that the late planting date shortened the growth period and made the grain-filling period to coincide with high temperatures and drought stress, with significant negative effects on the wheat yield. Further, Subedi et al. (Reference Subedi, Ma and Xue2007) reported that the delay in the sowing date reduced the grain-filling period and the yield of the spring wheat.
Barley (Hordeum vulgare L.) is a self-pollinating diploid species (2n = 14) and a model crop in molecular research. As a descendant of wild barley (Hordeum spontaneum C Koch), it is the fourth cereal after wheat, maize and rice in the worldwide production scale (Dhillon and Uppal, Reference Dhillon and Uppal2019). Globally, in 2017, barley was grown on 47 million hectares with a total yield of 147 million tons per year and productivity levels of around 3.1 ton/ha−1. In Iran, this crop is grown on 1.6 million hectares with a total yield of 3.1 million tons per year (FAO, 2017). Barley has a wide range of genetic resources, allowing it to adapt to a wide range of biotic and abiotic stresses such as drought, temperature and salinity (Kebede et al., Reference Kebede, Dejene, Albert and Mekbib2014; Kreszies et al., Reference Kreszies, Shellakkutti, Osthoff, Yu, Baldauf, Zeisler-Diehl, Ranathunge, Hochholdinger and Schreiber2019). Therefore, the selection of drought-tolerant cultivars is an important strategy for reducing future threats to food security (Peleg, et al., Reference Peleg, Fahima, Abbo, Krugman, Nevo, Yakir and Saranga2005). Samarah et al. (Reference Samarah, Alqudah, Amayreh and McAndrews2009) found significant variation among barley cultivars in their response to drought stress in terms of both yield and yield components. Similar results have been reported by Mitchell et al. (Reference Mitchell, Fukai and Cooper1996) for wheat cultivars under greenhouse and field conditions. Besides, the response of a crop to drought stress may also be regulated by such management practices as nitrogen application and sowing date. It is, therefore, necessary to identify the mechanisms of drought tolerance under these managing conditions (Dai et al., Reference Dai, Shan, Wei, Yang, Sa and Feng2012). Choosing the appropriate cultivar and sowing date allows plants not to face unfavourable environmental conditions or if they do, can tolerate the condition (Fayed et al., Reference Fayed, El-Sarag, Hassanein and Magdy2015). Today, the demand for barley production is growing for many reasons including genetic diversity and the wide compatibility of barley per se, as well as its wide range of uses, such as for food, beverages and animal feed. Therefore, molecular, cellular, physiological and morphological studies of barley and a deep understanding of the agronomic traits associated with drought tolerance and interactions with other factors would be essential for the cultivar selection. To the best of the authors' knowledge, there is no available data on the interactive effects of barley genotypes with drought stress and sowing season under nitrogen deficiency.
Therefore, this study was conducted (1) to evaluate the response of a wide range of barley cultivars to water stress under different nitrogen levels and sowing seasons and (2) to identify agro-physiological traits associated with drought tolerance in barley and, possibly, to select the most suitable genotypes under different conditions.
Material and methods
Plant materials and experimental site
This study evaluated 20 barley genotypes (19 genotypes from Iran and one genotype from Italy) (Table 1). The study was conducted at the Research Farm of the Isfahan University of Technology, in Lavark, Najaf-Abad (32 8 32 0 N, 51 8 23 0 E; 1630 m altitude), Isfahan, Iran. Soil samples were taken randomly from 0 to 30 depths before planting to determine their physical and chemical characteristics. Soil analysis results are shown in Table 2. Two experiments were carried out over two environments of autumn and spring; in both seasons, treatments were arranged as split–split plots in a randomized complete block design with three replications. Treatments included two irrigation levels (normal and water stress) as main plots, two levels of nitrogen (non-use of nitrogen (N0) and 62.5 kg N/ha, from urea fertilizer (N1)) as the sub-plots, as well as 20 barley genotypes (Iranian and foreign) as the sub-subplots. Each experimental plot was 1 m long with 13 rows for each genotype. The distance between rows was 15 cm and the planting density consisted of 350 plants/m2. The seeds were planted by hand at 5 cm depth. The sowing date in the autumn was on 22 October 2017, while it was on 4 March 2018, in spring.
Table 1. Some specifications and codes of the evaluated barley genotypes

Table 2. Some physical and chemical characteristics of soil at the experimental site

TN, total nitrogen; K, potassium; P, phosphorus; OM, organic matter; EC, electrical conductivity; CL, clay loam
Irrigation and nitrogen treatments
From planting to the establishment, all plots were irrigated based on the crop water need (based on 50% soil water depletion) in order to avoid plant mortalities. At Zadoks 13, the two irrigation treatments were applied according to the maximum allowable depletion (MAD) of available soil water (ASW) in the range of 0.03–1.5 MPa (Kramer and Boyer, Reference Kramer and Boyer1995). The irrigation treatments were 55 and 85% MAD of ASW, representing the normal and water stress conditions, respectively. The amount of soil moisture depletion was determined based on the plant evapotranspiration during the growth period, daily weather data of Najaf-Abad Synoptic Station (32 6 04 8 N, 51 3 89 3 E; 1631 m altitude), the FAO-Penman–Monteith equation and the barley crop coefficient for different growth stages (Allen, Reference Allen2003). Irrigation was carried out for each level of MAD using the following equations (Nematpour et al., Reference Nematpour, Eshghizadeh and Zahedi2019):

where θirrig is the threshold of soil-water content at the irrigation time for the selected MAD (m3/m3), θ fc is the volume basis soil-water content at field capacity (%), θ PWP is the volume basis soil-water content at wilting point (%) and MAD 50% is equal to (1 ± 0.05) × 50% of the total available water multiplied by the estimated irrigation depth by the following equation (Kiani et al., Reference Kiani, Gheysari, Mostafazadeh-Fard, Majidi, Karchani and Hoogenboom2016):

where D irrig is the irrigation depth (cm), D rz is the depth of the root zone (cm) and θ avg the is soil-water content at the root-zone before irrigation (m3/m3).
The drip-irrigation tape system had an approximate application rate of 1.3 l/h for each dripper and water volume was measured using the irrigation meter. The distance between two drip irrigation tapes was 30 cm and each tape was irrigated two rows of crops.
Nitrogen requirement (62.5 kg N/ha from urea fertilizer) was applied with irrigation at the three Zadoks 13, 31 and 51 (Zadoks et al., Reference Zadoks, Chang and Konzak1974) of growth stages (20.8 kg/ha N at each stage).
Measurement of the biological traits
Chlorophyll a, b and carotenoids
In total, 0.5 g of the freshly harvested leaves (from the flag leaf at the pollination stage in 10 randomly selected plants) was crushed in 20 ml of 80% acetone and centrifuged at 6000 g for l0 min. Then, absorption was read separately at 663 nm for chlorophyll a (Chl a), at 646 nm for chlorophyll b (Chl b) and at 470 for carotenoids (Car), using a spectrophotometer U-1800 (Hitachi, Japan). To calculate the chlorophyll and carotenoid contents, the following equations were used (Lichtenthaler, Reference Lichtenthaler1987):
-
Chl a = 12.25 A 663.2 – 2.798 A 646.8
-
Chl b = 21.50 A 646.8 – 5.10 A 663.3
-
Car = (1000 A 470 – 1.82 Ch1 a – 85.02 Ch 1b)/198
A: light absorbance at 663, 645 and 470 nm
Total soluble carbohydrate
Total soluble carbohydrate (TSC) was quantified by the following method (Irigoyen et al., Reference Irigoyen, Einerich and Sánchez-Díaz1992): 0.5 g of the freshly harvested leaves (from the flag leaf at the pollination stage in 10 randomly selected plants) was crushed in 5 ml of 95% ethanol. The insoluble part was crushed again by 5 ml of 70% ethanol and centrifuged at 3500 g for l5 min; then the impurities were carefully separated. After that, 0.1 ml of the alcoholic extract was removed and added to 3 ml of the reagent anthrone and placed at 100°C in a bain-marie for 10 min. After cooling, the absorbance was read at 625 nm.
Pro content
Pro accumulation was determined by the following method (Bates et al., Reference Bates, Waldren and Teare1973):
A 0.25 g fresh sample (from the flag leaf at the pollination stage in 10 randomly selected plants) was crushed in 10 ml of 3% aqueous sulfosalicylic acid and centrifuged at 1500 g for l0 min. Then, 2 ml of the supernatant was added to 2 ml glacial acetic acid; after that, 2 ml acidic ninhydrin was added and kept at 100°C in a bain-marie for a period of 60 min. The reaction was stopped by placing the mixture in the ice bath and 4 ml toluene was added. The absorbance of the upper phase was read at 520 nm using toluene as the blank.
Plant height
At the hard dough stage (87 Zadoks cod), 10 plants were randomly selected with respect to their margins from each plot and measured in cm from ground level to the end of the main spike, regardless of awn.
Yield and yield components
At the harvest stage, an area of 1 m2 from each plot was harvested. Thereafter, yield components including total biomass (TB), GY, the number of fertile spikes per square metre (NS m−2), the number of seeds in spike (NGS) and 1000-grain weight (1000W) were determined. Harvest index (HI) was also determined by the following equation:

where HI is the HI (%), GY is the economic yield based on the GY (kg) (reported based on 12.5% moisture content) and TB is the TB (kg).
Stress susceptibility index
Stress susceptibility index (SSI) was applied to evaluate the drought tolerance of the investigated genotypes by using the following equations (Fischer and Maurer, Reference Fischer and Maurer1978):

where Ys is the GY of each genotype under water stress condition and Yp is the GY of each genotype under non-stress condition.

where MYs is the mean GY of all genotypes under water stress condition and MYp is the mean GY of all genotypes under non-stress condition.
Statistical analyses
A combined analysis of variance (ANOVA) of data was performed in a split–split plot arrangement using a randomized complete block design by applying the SAS statistical software (version 9.4). Comparison of the treatment means with the LSD test was carried out at P < 0.5 probability level. Microsoft Excel 2016 software was then used to draw the histograms. Also, PCA and cluster analysis were performed using Stat Graphics centurion, version 16.1.15 and SAS JMP (version 11.0), respectively.
Results
Univariate data analysis
Plant height and total biomass
The ANOVA results (Table 3) showed that the main effects of environment (E), irrigation (I), nitrogen (N) and genotype (G) for Ht and TB were significant (P ≤ 0.01). For Ht, there were only two significant interactions according to the ANOVA results, including E × I and E × G (P ≤ 0.01). On the other hand, regarding TB, all first-order interactions and the interaction of E × I × G were significant. The means of both Ht and TB were negatively affected by spring planting, water stress and no-use of nitrogen (Table 4). Among genotypes, Ht ranged from 56.7 to 77.7 cm in genotypes #8 and #10, respectively, and TB had a range of 8960 to 10 737 kg/ha in genotypes #12 and #11, respectively. The significant interaction effect of E × I × G on TB (P ≤ 0.05) (Table S2) showed that in the autumn sowing season, genotypes #1 and #10 had the highest TB, while the genotypes #17 and #12 had the lowest one under both irrigation condition (MAD 55% and MAD 85%) (Table 5). Also, in the spring sowing season, genotype #1 had the highest TB, while genotype #2 had the lowest one in both normal and stress MAD.
Table 3. ANOVA for agro-physiological characteristics of barley genotypes under different sowing seasons, irrigation regimes and nitrogen levels

ns, non-significant; Ht, plant height; TB, total biomass; GY, grain yield; NS/m2, number of fertile spikes per square meter; NGS, number of grains in spike; 1000W, 1000 grains weight; HI, harvest index; Chl a, chlorophyll a; Chl b, chlorophyll b; Chl a + b, chlorophyll a + chlorophyll b; Car, carotenoids; TSC, total soluble carbohydrate; Pro, proline content
a Environment: two sowing date in autumn (22 October 2017) and in spring (4 March 2018)
b Two irrigation regimes (55% and 85% MAD of ASW, as normal and water stress conditions, respectively)
c Two levels of nitrogen (non-use of nitrogen, N0, and 62.5 kg N/ha, from urea fertilizer, N1)
d Genotype: 20 barley genotypes
*Significant at the 0.05 probability level; ** significant at the 0.01 probability level
Table 4. The main effects of the sowing seasons, irrigation regimes, nitrogen levels and genotypes on the studied agro-physiological traits

* Means in each column for each experimental factor, followed by similar letter(s) are not significantly different at 5% probability level, using LSD's test
Ht, plant height; TB, total biomass; GY, grain yield; NS/m2, number of fertile spikes per square metre; NGS, number of grain in spike; 1000W, 1000 grains weight; HI, harvest index; Chl a, chlorophyll a; Chl b, chlorophyll b; Chl a + b, chlorophyll a + chlorophyll b; Car, carotenoids; TSC, total soluble carbohydrate; Pro, proline content
i Environment: two sowing dates in autumn (22 October 2017) and in spring (4 March 2018)
ii Two irrigation regimes (55% and 85% MAD of ASW, as normal and water stress conditions, respectively)
iii Two levels of nitrogen (non-use of nitrogen, N0 and 62.5 kg N/ha1 from urea fertilizer, N1)
Table 5. The effects of the sowing seasons, irrigation regimes and genotype on some studied agronomic traits
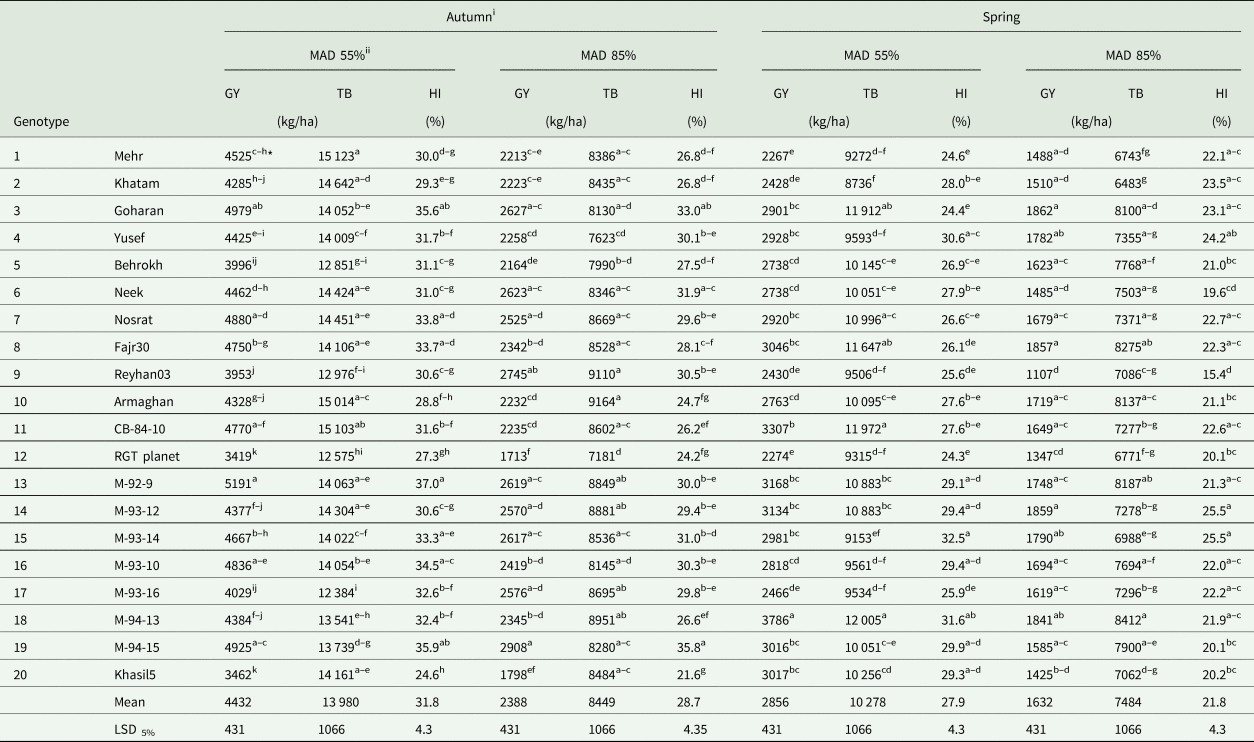
* Means in each column for each experimental factor, followed by similar letter(s) are not significantly different at 5% probability level, using LSD's test
GY, grain yield; TB, total biomass; HI, harvest index
i Environment: two sowing dates in autumn (22 October 2017) and in spring (4 March 2018)
ii Two irrigation regimes (55% and 85% MAD of ASW, as normal and water stress conditions, respectively).
GY and yield components
All main effects and all first-order interactions, except E × N and the second order interactions of E × I × N and E × I × G, were significant at P ≤ 0.01 on GY (Table 3). Planting in the spring season, water stress and no-use of nitrogen reduced GY by 1166, 1633 and 163 kg/ha, as compared to planting in the autumn season, normal irrigation condition and nitrogen application, respectively (Table 4). Application of the N fertilizer under MAD 55% increased GY by 828 kg/ha in the autumn and 448 kg/ha in the spring sowing seasons. In contrast, under MAD 85%, application of the N fertilizer surprisingly decreased GY by 476 kg/ha in the autumn and 397 kg/ha in the spring sowing seasons. (Fig. 1(A)). In the autumn sowing season and among different genotypes, the highest GY under MAD 55%, was 5191 kg/ha (genotype #13) and under MAD 85%, was 2908 kg/ha (genotype #19), while the lowest GY under MAD 55% was 3419 kg/ha (genotype #12) and under MAD 85%, was 1713 kg/ha (genotype #12). Also, regarding the spring sowing season, the highest GY under MAD 55%, was 3786 (genotype #18) kg/ha and under MAD 85% was 1862 kg/ha (genotype #3), while the lowest GY under MAD 55% was 2267 kg/ha (genotype #1) and under MAD 85% was 1107 kg/ha (genotype #9) (Table 5). The interaction of environment (season), irrigation and nitrogen showed that in sowing seasons, application of nitrogen fertilizer increased GY under MAD 55%, but it was decreased under MAD 85%. Also, a significantly higher decrease in GY due to water deficiency was observed in the autumn sowing season; when nitrogen was applied, the GY decrease was intensified, especially in the autumn planting date (Fig. 1(A)).

Fig. 1. The interaction effects of environment (in autumn, 22 October 2017, and spring, 4 March 2018), irrigation regime (55 and 85% MAD of ASW, as normal and water stress conditions, respectively) and nitrogen (non-use of nitrogen, N0 and 62.5 kg N/ha from urea fertilizer, N1) on the GY (A), number of grains in the spike (B) and HI (C) of the barley plants. Error bars represent 95% confidence intervals.
Regarding the number of fertile spikes per m2 (NS/m2), the ANOVA results (Table 3) showed that it was significantly affected by all main effects and the interaction effect of E × G at P ≤ 0.01, while the interaction effect of E × I was significant at P ≤ 0.05. For the number of seeds in spike (NGS), the main effects of irrigation, genotype and interaction effects of E × I, E × G, I × N and E × I × N were significant at P ≤ 0.01 (Table 3). Regarding 1000-grain weight in the ANOVA table (Table 3), the interaction of irrigation and genotype was significant at P ≤ 0.01, while the main effect of nitrogen and its interaction with irrigation and E × I were significant at P ≤ 0.05.
Planting in the spring season reduced NS/m2 by 79 fertile spike, as compared to the autumn one, but it had no significant effect on NGS and 1000W. Also, the deficit MAD of 85% decreased NS/m2, NGS and 1000W by 55 fertile spike, 9 seeds in spike and 0.39 g, respectively. In contrast, N application increased NS/m2 and 1000W by 6.4 and 3.7%, respectively, but it had no significant effect on grain in spike. Genotypes #5, #7 and #9 had the highest spike in m2, grain in spike and 1000W, respectively (Table 4). Nitrogen application increased NGS under MAD 55% but decreased it under MAD 85% (Fig. 1(B)).
Harvest index
The main effects of E, I, N, G and all first order interactions except E × G, as well as the interaction of E × I × N and E × I × G, were significant at P ≤ 0.01; only the interaction effect of E × I was significant at P ≤ 0.05 (Table 3). The means of HI were negatively affected by planting in the spring season, water stress and no-use of nitrogen (Table 4). In the autumn sowing season, under MAD 55% the genotype #13 (37.0%) and under MAD 85% the genotype #10 (35.8%) had the highest HI, while under MAD 55% the genotype #20 (24.6%) and under MAD 85% the genotype #20 (35.8%) had the lowest HI. Also, in the spring sowing season, under MAD 55% the genotype #15 (32.5%) and under MAD 85% the genotype #14 (25.5%) had the highest HI, while under MAD 55% the genotype #12 (24.3%) and under MAD 85% the genotype #9 (15.4%) had the lowest HI (Table 5). Nitrogen application increased HI under MAD 55% but decreased it under MAD 85% in both sowing seasons (Fig. 1(C)).
Chlorophyll and carotenoid contents
The main effects and some interaction effects including E × N and E × G were significant at P ≤ 0.01 on Chl a, Chl b, Chl a + b and Car (Table 3). Also, the interaction effect of I × N was significant at P ≤ 0.01, and the interaction effects of E × I, E × I × N, E × I × G were significant at P ≤ 0.05 on Chl a and Chl a + b (Table 3). The autumn sowing season, water stress condition and no application of nitrogen reduced chlorophylls and Car content. Among genotypes, genotype #19 had the highest amount of chlorophylls and Car (Table 4). Among different genotypes under both MADs, genotype #6 in the autumn sowing season and genotype #19 in the spring sowing season had the highest Chl a and Chl a + b content (Table 6).
Table 6. The effects of the sowing seasons, irrigation regimes and genotypes on some studied physiological traits

* Means in each column for each experimental factor, followed by similar letter(s) are not significantly different at 5% probability level, using LSD's test
Chl a, chlorophyll a; Chl a + b, chlorophyll a + chlorophyll b; TSC, total soluble carbohydrate
i Environment: two sowing date in autumn (22 October 2017) and in spring (4 March 2018)
ii Two irrigation regimes (55% and 85% MAD of ASW, as normal and water stress conditions, respectively).
TSCs and Pro content
The ANOVA results (Table 3) showed that TSC and Pro were significantly affected by all main effects of E, I, N, G, and some interaction effects including E × I, E × G, I × G and E × I × G. Pro were significantly (P ≤ 0.01) affected by all first order interactions, except E × N. TSC was decreased in the spring sowing season; by using nitrogen, it was increased under water stress condition. Pro was also increased in the autumn sowing season, under water stress condition and by the use of nitrogen (Table 4). Water stress increased Pro by 63.8 and 66.0% in the autumn and spring sowing seasons, respectively. Also, the use of nitrogen fertilizer increased the content of Pro by 25.2 and 21.5%, respectively, under normal and stressed conditions (Table S1). The first-order interaction effects of genotype with sowing seasons, irrigation regimes and nitrogen levels on Pro showed that among genotypes, the genotype M-93-16 had the highest content of Pro in the autumn sowing season, normal irrigation conditions and no application of nitrogen; also, the genotypes M-93-16 and Goharan had the highest content of Pro in the spring sowing season, water stress condition and application of nitrogen (Table S2). In the autumn sowing season, the genotypes #15 and #20 and in the spring sowing season, the genotypes #10 and #3 had the highest TSC under normal and water stress conditions, respectively (Table 6).
Stress susceptibility index
The interaction effects of the sowing seasons, nitrogen levels and genotypes (P ≤ 0.01) on SSI were significant (Table S3). The results also showed that the use of the nitrogen fertilizer in both sowing seasons made a change in SSI values in different genotypes, so that in autumn, with the use of nitrogen, SSI was increased in half of some genotypes including 6, 7, 8, 9, 10, 14, 15, 16, 17 and 18, but it was decreased in the other ones. Also, in spring, by applying nitrogen, SSI was increased in #7 genotypes of 1, 2, 3, 11, 12, 13, 15, while it was decreased in the other ones. Therefore, overall, SSI was higher in the autumn sowing season, as compared to the spring planting date (Fig. 2).

Fig. 2. The interaction effects of genotype and nitrogen levels on the barley SSI in the autumn (a) and spring (b) sowing seasons. Sowing date in autumn was on 22 October 2017, and it was on 4 March 2018, in spring. Two levels of nitrogen included non-use of nitrogen, N0 and 62.5 kg N/ha from urea fertilizer, N1. Error bars represent 95% confidence intervals.
In autumn under the non-use of nitrogen (N0) treatment, among different genotypes the highest sensitivity to water stress was related to genotype #11 and the lowest sensitivity to water stress was related to the genotype #9 and under the use of nitrogen (N1) treatment the highest sensitivity to water stress was related to the genotype #8 and the lowest sensitivity to water stress was related to the genotype #9. Also, in spring under N0, the highest sensitivity to water stress was related to genotype #9 and the lowest sensitivity to water stress was related to genotype #3 and under N1 the highest sensitivity to water stress was related to genotype #20 and the lowest sensitivity to water stress was related to the genotype #17 (Fig. 2). Generally, genotype #9 had the lowest sensitivity to water stress among others in the autumn season, while it was one of the most sensitive genotypes to water stress in the spring season (Fig. 2).
Multivariate data analysis
Principal component analysis
The studied barley genotypes were significantly affected by the interactions with irrigation conditions and sowing seasons. However, while the main effect of nitrogen over all genotypes was significant, they were not influenced by the interaction with nitrogen level, except for the Pro content (Table 3). Therefore, the second order interactions effects between genotypes and irrigation conditions or between genotypes and sowing seasons, as the effective factors in the rank change of the genotypes in the planting environments, were dissected using the biplot analysis each at the level of the third factor. By this, four biplots as the studied environments were generated and analyzed as follows.
Environment 1: autumn sowing season
The biplot results showed that the two principal components explained 72.6% of the variability (Fig. 3-Top). PC1 had positive coefficients for GY, TB, Ht, 1000W, HI, Chl a, Chl b, Chl a + b and Car, while it had negative ones for TSC and Pro. Also, PC2 had a positive coefficient with NGS and a negative coefficient with NS/m2. Therefore, this component is more representative of NGS (Table 7).

Fig. 3. 2D biplot of the principal components analysis (PCA) in the autumn (Top) and spring (Bottom) sowing seasons. N, normal irrigation condition (55% MAD); S, stress irrigation condition (85% MAD); 1000W, 1000 grains weight; Car, carotenoids; Chl a, chlorophyll a; Chl a + b, chlorophyll a + chlorophyll b; Chl b, chlorophyll b; HI, harvest index; Ht, plant height; GY, grain yield; NGS, number of grains in spike; NS/m2, number of fertile spikes per square metre; Pro, proline content; TB, total biomass; TSC, total soluble carbohydrate.
Table 7. Component weights of the measured traits in the 2D principal components analysis (PCA) for autumn and spring sowing seasons

1000W, 1000 Grains weight; Car, carotenoids; Chl a, chlorophyll a; Chl a + b, chlorophyll a + chlorophyll b; Chl b, chlorophyll b; HI, harvest index; Ht, plant height; GY, grain yield; NGS, number of grain in spike; NS/m2, number of fertile spikes per square metre; Pro, proline content; TB, total biomass; TSC, total soluble carbohydrate
i Environment: two sowing date in autumn (22 October 2017) and in spring (4 March 2018).
According to the biplot chart, GY and TB had a high-positive correlation. NGS with GY created an angle of ~90°; therefore, NGS had no significant correlation with GY under this environment. Also, NS/m2 did not show a high correlation with GY. According to the characters entered in the PC1, superior genotypes could be selected with an emphasis on PC1 component (Fig. 3-Top).
In relation to the biplot chart, the treatment combinations were divided into seven groups and the biplot showed that all MAD 55% (N: as normal irrigation condition) treatments were completely separated from MAD 85% (S: as stressed irrigation condition) ones, thereby indicating the highly discriminating effect of the irrigation regimes. The combination of irrigation regimes and genotypes showed dispersal in all four biplot zones and the highest number of treatment compositions was in zones A and C for MAD 85% and MAD 55%, respectively. In the water-stress zones (A and B), where PC1 values were negative, S1, S12 and S5 were the weakest treatment combinations and therefore, the genotypes #1, #12 and #5 had the lowest TB and GY under stress conditions. Also, under these conditions, genotypes #9, #13, #7, #19 and #6 had the highest TB and GY (Fig. 3-Top). In zones C and D, where the genotypes were in MAD 55%, like zones A and B, the genotypes #1, #12 and #5 had the lowest TB and GY, but the highest TB and GY were related to the genotypes #13, #6, #7 and #14. It should be noted the genotype #5 is a two-row barley genotype whose lower GY is reasonable. Therefore, according to PC1, the genotypes #1, #12 and #5 had the lowest TB and GY, while the genotypes #13, #7 and #6 exhibited the highest ones under both irrigation conditions when they were planted only in the autumn sowing season (Fig. 3-Top).
The biplot analysis in the autumn sowing season also showed that GY had a high negative correlation with Pro and TSC; among the yield components, 1000W had the most impact on GY. Therefore, it seems that to increase the barley GY in this environment, genotypes with the higher values of 1000W should be selected. Also, TSC and Pro were increased under MAD 85% conditions (Fig. 3-Top).
Environment 2: spring sowing season
The biplot results showed that PC1 and PC2 explained 67.3% of the variability (Fig. 3-Bottom). PC1 had positive coefficients for GY, TB, Ht, HI, Chl a, Chl b, Chl a + b and Car, and negative coefficients for Car and Pro. PC1 could represent GY and TB traits. Also, PC2 had positive coefficients for NGS and 1000W, and a negative one for NS/m2. Therefore, this component is more representative of NGS and 1000W (Table 7).
Like the autumn sowing season, the treatment combinations were divided into seven groups. Also, the biplot showed that all MAD 55% (N: as normal irrigation condition) treatments were completely separated from MAD 85% (S: as stress irrigation condition) treatments. The highest number of combinations was observed in zones A and C (MAD 85% and MAD 55%). In zone A, where the values of both PCs were negative, the treatment combinations S20 and S6 were located; therefore, these genotypes (#6 and #20) were the weakest ones under MAD 85%. Under this zone, genotype #11 had a relatively higher value of PC1; in the second zone B, genotype #14 had the highest, while genotypes #17 and #9 had the lowest value of PC1. Therefore, it could be said that under MAD 85% (zones A and B), the genotypes #11, #19 and #3 had the highest GY, while genotypes #17, #9, #20 and #6 had the lowest one (Fig. 3-Bottom). Under MAD 55% (zones C and D), genotype #17 had the lowest value of PC1, and genotypes #6 and #19 had the lowest values of PC2. Also, genotypes #18, #19, #11 and #4 were recognized as the best genotypes based on GY, and genotype #17 was identified as the worst genotype. Generally, it could be concluded that genotypes #11 and #19 (having the highest yield under both MAD) could be recommended as suitable genotypes in both conditions when they are grown only in the spring season (Fig. 3-Bottom).
The biplot analysis in the spring sowing season showed that GY had a high positive correlation with TB and HI traits, while it showed a high negative correlation with Pro and TSC. Also, among the yield components, NS/m2 and NGS traits had the least effect on GY. The pigment traits had a high positive correlation with each other; among the pigment traits, Car had the most positive correlation with GY (Fig. 3-Bottom).
Environment 3: normal irrigation condition
The biplot results showed that PC1 and PC2 explained 52.1% of the variability (Fig. 4-Top). PC1 had positive coefficients for GY, TB and Ht, and negative ones for Chl a, Chl b, Chl a + b, Car. Also, PC2 had positive coefficients for NGS, 1000W and Pro, while it had negative ones for GY, NS/m2 and HI. It seems, therefore, that PC1 was representative of TB and GY traits and PC2 was more representative of Pro and 1000W (Table 8).

Fig. 4. 2D biplot of principal components analysis (PCA) in normal (Top) and water stress (Bottom) conditions. AU, autumn (22 October 2017); SPR, spring (4 March 2018); 1000W, 1000 grains weight; Car, carotenoids; Chl a, chlorophyll a; Chl a + b, chlorophyll a + chlorophyll b; Chl b, chlorophyll b; HI, harvest index; Ht, plant height; GY, grain yield; NGS, number of grains in spike; NS/m2, number of fertile spikes per square metre; Pro, proline content; TB, total biomass; TSC, total soluble carbohydrate.
Table 8. Component weights of the measured traits in 2D principal components analysis (PCA) for MAD 55% (as normal irrigation condition) and MAD 85% (as stress irrigation condition)

1000W, 1000 grains weight; Car, carotenoids; Chl a, chlorophyll a; Chl a + b, chlorophyll a + chlorophyll b; Chl b, chlorophyll b; HI, harvest index; Ht, plant height; GY, grain yield; NGS, number of grain in spike; NS/m2, number of fertile spikes per square metre; Pro, proline content; TB, total biomass; TSC, total soluble carbohydrate
i Two irrigation regimes (55% and 85% MAD of ASW, as normal and water stress conditions, respectively).
According to the biplot chart (Fig. 4-Top), treatment combinations could be divided into nine groups. The treatment combinations of the growing season and genotype showed a uniform dispersal in all four biplot zones. However, the biplot figure showed that the autumn (AU) and spring (SPR) sowing season treatments were separated. Also, the biplot chart showed that GY and TB had a high positive correlation with each other, but they had a negative correlation with Pro. Also, 1000W and NGS created an angle of ~90° with GY; therefore, 1000W and NGS had no significant correlation with GY under this environment. In zone A, where the values of both PCs were negative, the treatment combination SPR19 was located; therefore, genotype #19 had the lowest rank under normal irrigation when the season changed. Also, in the autumn zones C and D, where PC1 values were positive, AU1, AU11 and AU3 were the most desirable treatment combinations and therefore, genotypes #1, #3 and #11 were the good ones in the autumn season under the MAD 55%.
Environment 4: water stress condition
Biplot analysis results showed that both PC1 and PC2 explained 56.5% of the total data variability (Fig. 4-Bottom) and PC1 had positive coefficients for GY, TB, HI and negative ones for Pro, Chl a, Chl b, Chl a + b, and Car. PC1 appeared to represent GY and TB traits. Also, PC2 had positive coefficients for Ht, NS/m2 and negative ones for NGS and 1000W; therefore, PC2 was more representative of NS/m2 because it had the highest weight related to the second component (Table 8). The biplot figure (Fig. 4-Bottom) also showed that GY had a high negative correlation with Pro. Also, there was a very high positive correlation between GY and HI and TB. According to the biplot diagram, NS/m2 created an angle of ~90° with GY; so, it could be said to have no correlation with performance in the stress conditions. Also, since all Ht, HI, GY and TB had acceptable weights on the PC1, generally, PC2 did not represent a specific feature of the yield component; so, it was better to select the best genotypes based on the first component in its positive values. However, in the autumn sowing season, the genotypes #1, #11 and #3 had the highest value, while the genotypes #6, #20 and #12 had the lowest one; in the spring sowing season, the genotype #17 had the highest value, while the genotypes #1, #19 and #11 had the lowest one based on the first component.
Clustering
To classify the genotypes based on all measured traits, a dendrogram was generated based on the Euclidian distance and depicted in each of the above environments; however, it was then realized that irrigation regimes had not influenced the grouping trend. Therefore, a common dendrogram for each sowing season was considered.
According to cluster analysis (Fig. 4-Top), in the autumn sowing season, based on ccc-plot and F-bill tests, the genotypes were clustered into three categories. This was almost consistent with the results of the biplot; in each irrigation environment, the genotypes were divided into three groups. According to Table 9, group one of the clustering had the maximum TB, Ht and 1000W, while it showed the minimum of NGS, Chl a, Chl b, Chl a + b, Car, TSC and Pro. In the second group, some traits including GY, NS/m2, Chl a, Chl b, Chl a + b, Car and TSC had the maximum values while 1000W had the minimum. Group 3 had the maximum values of NGS and Pro and the minimum values of TB, Ht, HI, NS/m2 and GY traits. Therefore, it seems that the second group needed to be considered for selecting the best genotype because genotypes #13 and #6, which were the best for yield under both environmental conditions in the biplot analysis, were included in this cluster. Also, genotypes #12 and #5, which were weak based on the biplot analysis, were in the third group here. Further, both genotypes 5 and 17, which were the two-row barley genotypes, were included in this group (Fig. 4-Top).
Table 9. Mean comparison of groups generated by cluster analysis in each sowing date in terms of the studied traits

* In each column and for each studied traits the mean numbers with the same letter(s) are not significantly different at LSD 5% level.
Ht, height; TB, total biomass, GY, grain yield; NS/m2, number of fertile spikes per square metre; NGS, number of grain in spike; 1000W, 1000 grains weight; HI, harvest index, Chl a, chlorophyll a; Chl b, chlorophyll b; Chl a + b, chlorophyll a + chlorophyll b; Car, carotenoids; TSC, total soluble carbohydrate; Pro, proline.
According to cluster analysis (Fig. 5(A)), in the spring sowing season, based on ccc-plot and F-bill tests, the genotypes were clustered into three groups; this was almost consistent with the biplot results. According to table 9, Group 1 of clustering had the maximum values of Ht, TB, GY, HI, Chl a, Chl b, Chl a + b and Car. In the second group, some traits including NS/m2 and TSC had the highest values, while Traits Ht, NGS, 1000W, Chl a, Chl a + b, Car and Pro had the minimum ones. In the third group, NGS, 1000W, Pro and TSC had the maximum values. Therefore, it seems that group one needs to be considered for selecting the best numbers. Also, genotypes #18 and #11, which were the best genotypes for yield under both irrigation environmental conditions in the biplot analysis, were also included in this cluster (Fig. 5(B)).

Fig. 5. Clustering analysis for 20 barley genotypes in autumn (A) and spring (B) sowing seasons based on different studied agro-physiological traits including 1000W, 1000 grains weight; Car, carotenoids; Chl a, chlorophyll a; Chl a + b, chlorophyll a + chlorophyll b; Chl b, chlorophyll b; HI, harvest index; Ht, plant height; GY, grain yield; NGS, number of grains in spike; NS/m2, number of fertile spikes per square metre; Pro, proline content.
Discussion
Most barley genotypes reacted significantly different in terms of the measured traits, in two spring and autumn sowing seasons, as GY and TB were 1166 and 2347 kg/ha higher in the autumn. This was due to the prolonged growth period, less competition from weeds and the shorter time of facing high temperatures during grain filling in the autumn sowing date (Samarah and Al-lssa, Reference Samarah and Al-Issa2006). Flowers et al. (Reference Flowers, Peterson, Petrie, Machado and Rhinhart2006) also reported that sowing dates have a significant influence on yield but it also depends on weather conditions during sowing season (whether the drought is present, too high or too low temperatures etc.). Ahmad et al., 2003) have also reported that early planting led to the higher GY, higher biomass and the increased number of spikes per unit area, as compared to the late planting date. Robertson et al. (Reference Robertson, Holland and Bambach2004) have reported that in the spring sowing season, the barley HI was significantly reduced due to the shortening of the grain-filling period and the reduction of photosynthetic material allocation from sources to the sinks and consequently, the reduced GY, which was consistent with our results.
Water deficit decreased the grain and biomass yields of the barely genotypes, on average, by 1633 and 4149 kg/ha, respectively. These results were similar to the findings of other researchers (Arshadi et al., Reference Arshadi, Karami, Sartip, Zare and Rezabakhsh2018; Mahalingam and Bregitzer, Reference Mahalingam and Bregitzer2019). Usually, water deficit stress reduces chlorophyll synthesis (Zhao et al., Reference Zhao, Ma and Ren2007), photosynthesis rate (Zandalinas et al., Reference Zandalinas, Mittler, Balfagón, Arbona and Gómez-Cadenas2018), leaf area index (El-Hashash and Agwa, Reference El-Hashash and Agwa2018), plant height and biomass (Kilic and Yagbasanlar, Reference Kilic and Yagbasanlar2010), the number of grains in spike and GY (Guttieri et al., Reference Guttieri, Stark, O'Brien and Souza2001) and the increase of photo-respiratory losses (Mittler, Reference Mittler2006; Mir et al., Reference Mir, Zaman-Allah, Sreenivasulu, Trethowan and Varshney2012), the amount of Pro (Bajji et al., Reference Bajji, Kinet and Lutts2002), and TSC (Farouk and Al-Sanoussi, Reference Farouk and Al-Sanoussi2019). Pro is one of the plants compounds accumulated in the plants under stress, protecting the plant against stress damage by inhibiting free radicals reactive oxygen species (Liang et al., Reference Liang, Zhang, Natarajan and Becker2013). The increase in soluble carbohydrates could also be due to a decrease in the plant's need for photosynthetic materials; this, in turn, is due to the growth slowdown, synthesis of these compounds from non-photosynthetic pathways, and the destruction of insoluble carbohydrates (Ehdaie et al., Reference Ehdaie, Alloush, Madore and Waines2006).
Nitrogen fertilizer application increased GY and TB by 163 and 1066 kg/ha, respectively, as compared to no application of nitrogen conditions (Table 4). There are various studies regarding the positive effects of the nitrogen fertilizer on the yield and TB (Agegnehu et al., Reference Agegnehu, Nelson and Bird2016; Ejigu et al., Reference Ejigu, Tana and Eticha2018). Numerous researchers have shown that the use of the N fertilizer improves various plant's parameters, such as plant height (Kumar et al., Reference Kumar, Tyagi, Dubey and Kumar2019), the number of grains in spike (Ozturk et al., Reference Ozturk, Caglar and Sahin2003), the number of spikes per square metre (Ahmed et al., Reference Ahmed, Hassanein and Zaki2019), and 1000 grain weight (Vasilescu et al., Reference Vasilescu, Bude, Sîrbu and Petcu2019); therefore, higher GY and TB could be achieved. Also, in this study, nitrogen reduced the amount of TSC, which was consistent with the results of Loaiza et al. (Reference Loaiza, Dutari, Rovira, Sanjur, Laporta, Pecor, Foley, Eastwood, Kramer, Radtke and Pongsiri2017). The decrease in water-soluble carbohydrates with increasing the N fertilizer could be explained by the increased use of carbon chains required to proceed nitrate and protein synthesis (Bowerman and Goodman, Reference Bowerman and Goodman1971).
Interaction of the irrigation regimes and nitrogen fertilizer in both seasons showed that the application of the nitrogen fertilizer under normal irrigation conditions increased the growth and yield of barley. However, under water stress condition, due to the increased vegetative growth and evaporation from the plant surface, it reduced growth and yield, which was consistent with the findings of Sieling et al. (Reference Sieling, Schröder, Finck and Hanus1998). Reports from several researchers addressing the effects of the nitrogen fertilizer on the cereal yield, under both water stress and non-water stress conditions, have shown some contradictions. Albrizio et al. (Reference Albrizio, Todorovic, Matic and Stellacci2010), in an experiment on barley and wheat cultivars under different irrigation regimes and nitrogen fertilizer treatments, showed that the interaction of irrigation and nitrogen fertilizer did not have a significant effect on the biomass and GY. Also, Eck, (Reference Eck1984) showed that the use of nitrogen slightly increased the corn GY under stress, which was in contradiction to our results.
The responses of different genotypes of barley were different to the experimental factors, which was consistent with the findings of other researchers. For example, Solomon et al. (Reference Solomon, Labuschagne and Bennie2003) reported that the responses of different genotypes under water stress in terms of grain weight and GY were different. Numerous researchers have also stated that water stress could have different effects on the number of grains in different cultivars (Ahmadi Baker, Reference Ahmadi and Baker2001; Pandey et al., Reference Pandey, Maranville and Admou2001). Also, the absorption of nutrients and nutrient metabolism are reduced due to the negative effects of drought on transpiration, the size of source and sink, the distribution of dry matter and pollination; however, its effects vary with plant species, growth stage and severity of drought (Farooq et al., Reference Farooq, Wahid, Kobayashi, Fujita and Basra2009; Pang et al., Reference Pang, Turner, Khan, Du, Xiong, Colmer, Devilla, Stefanova and Siddique2016). Vasilescu et al. (Reference Vasilescu, Bude, Sîrbu and Petcu2019), in an experiment on 17 barley genotypes, under different nitrogen treatments, showed that there was significant variation among genotypes in terms of the grain protein content. Meanwhile, Moreno et al. (Reference Moreno, Moreno, Ribas and Cabello2003) stated that the responses of barley genotypes to N fertilizer strongly depend on the growing seasons. Also, Sturite et al. (Reference Sturite, Kronberga, Strazdina, Kokare, Aassveen, Bergjord Olsen, Sterna and Straumite2019) showed that different barley varieties had significant differences in terms of yield in different environmental conditions. Furthermore, it was observed that two-row genotypes had the lowest NS/m2 and NGS, as compared to other genotypes. Le Goiis et al. (1999) have also reported similar results. Therefore, the interpretation of the best genotypes depends on a complex interaction of different factors.
Based on the univariate data analysis, however, nitrogen application significantly increased the GY and its components, which were also under the influence of the interaction with the irrigation regime; however, the order of genotypes in terms of performance was not affected by the use of nitrogen. Therefore, the multivariate data analysis clearly showed that selecting the genotypes with a higher performance could be the result of an interaction between water stress and sowing season. By this, four environmental combinations were dissected, based on which the best genotypes were chosen according to a linear relationship of the measured traits. It seems, therefore, that the best genotypes could be different in each environment; however, there was also some stability in choosing the best one among the environments. For example, AU1, which is genotype #1 in the autumn sowing season, is the best genotype under both normal and water-deficit irrigation conditions. However, this genotype had a high SSI value in autumn. Therefore, the biplot stability analysis was not necessarily correlated with the lower SSI index. This was because the low percentage of yield changes as a stress resistance factor could have a larger physiological rather than economic value. It can be, therefore, concluded that selection based on the sensitivity index (SSI) leads to genotypes with a relatively low yield in both normal and stress conditions; so, these genotypes are not desirable in terms of yield (Schneider et al., Reference Schneider, Rosales-Serna, Ibarra-Perez, Cazares-Enriquez, Acosta-Gallegos, Ramirez-Vallejo, Wassimi and Kelly1997). Clarke et al. (Reference Clarke, DePauw and Townley-Smith1992) have also stated that selection based on SSI leads to the selection of stress-tolerant genotypes, though with low-yield potential.
In this study, a higher interaction effect was found between barley genotypes and sowing seasons, as compared to the interaction between plant genotypes and irrigation regimes for most traits including GY (Table 3). Meanwhile, the main effect of irrigation led to a significantly higher variation, as compared to the variation made by the sowing season (Table 3). Therefore, it showed that the selection of a genotype with high seed yield stability was easier or possible under contrasting irrigation regimes, as compared to the contrasting planting seasons. This is clearly depicted in the multivariate PC biplot analysis; when the data were analyzed in each sowing season, there were the same barley genotypes with high seed yield under both irrigation regimes, like #13 and #6 in autumn and #11 and #19 in the spring sowing season. However, when the genotypes were examined under each irrigation regime, there were no such stable genotypes over two sowing seasons (Figs 3 and 4). This could indicate that the selection of barley genotypes with a high seed yield is much more sensitive to the sowing season than water stress conditions and/or nitrogen application.
Conclusions
The results of this study showed that the growth responses of barley genotypes in terms of most studied traits were affected by drought and sowing season, as well as their interaction with the nitrogen fertilizer levels. Application of the nitrogen fertilizer had different effects on GY under water stress and normal irrigation conditions, so that nitrogen application increased GY under normal irrigation but decreased it under water stress conditions. Also, the nitrogen fertilizer caused a change in the SSI value in different cultivars under both sowing seasons. In general, it could be concluded that barley genotypes responded much differently to the two sowing seasons, as compared to irrigation condition, and their responses to drought stress were also influenced by the nitrogen fertilizer. These conclusions are very important in the case of barley breeding programs as highly significant interactions between plant genotypes and environmental factors, especially the sowing season, warrant genotypes selection based on each combinational environment.
Supplementary material
The supplementary material for this article can be found at https://doi.org/10.1017/S0021859621000149.
Acknowledgement
The authors sincerely thank the experts and staff of the Educational-Research Farm (Lavark) and Laboratories of the College of Agriculture, the Isfahan University of Technology who made great efforts for the proper carrying out of the present project.
Financial support
The budgets of this study were provided by Isfahan University of Technology (IUT), Isfahan, Iran, through Grant No. 9500255.
Conflict of interest
The authors declare no conflicts of interest.
Ethical standards
Not applicable.


