INTRODUCTION
The sweetness and taste of fruit are highly dependent on sugar composition, because sugars differ in their relative sweetness (Kulp et al. Reference Kulp, Lorenz and Stone1991). If sucrose is rated 1·0 in terms of sweetness, fructose is rated about 1·75, glucose 0·75 and sorbitol 0·5 (Pangborn Reference Pangborn1963; Doty Reference Doty1976). In peach fruit, sucrose predominates followed by the reducing sugars (glucose and fructose) and sorbitol (Moriguchi et al. Reference Moriguchi, Sanada and Yamaki1990a; Robertson et al. Reference Robertson, Horvat, Lyon, Meredith, Senter and Okie1990).
It has been reported that the glucose and fructose contents of peach fruit are similar (Moriguchi et al. Reference Moriguchi, Sanada and Yamaki1990a; Vizzotto et al. Reference Vizzotto, Pinton, Varanini and Costa1996; Lo Bianco et al. Reference Lo Bianco, Rieger and Sung1999; Morandi et al. Reference Morandi, Grappadelli, Rieger and Lo Bianco2008). For example, Esti et al. (Reference Esti, Messia, Sinesio, Nicotra, Conte, la Notte and Palleschi1997) reported similar levels of glucose and fructose in mature fruit of 21 peach and nectarine cultivars, as did Dirlewanger et al. (Reference Dirlewanger, Moing, Rothan, Svanella, Pronier, Guye, Plomion and Monet1999) using mature fruit of 63 F2 genotypes from a cross between the non-acid peach ‘Ferjalou Jalousia®’ and the acid nectarine ‘Fantasia’. Glucose and fructose contents were also found to be approximately equal during peach fruit development and exhibited similar patterns of seasonal variation (Chapman & Horvat Reference Chapman and Horvat1990; Génard et al. Reference Génard, Lescourret, Gomez and Habib2003). However, compared with market-quality cultivars, a lower amount of fructose in native and flowering peaches was reported by Moriguchi et al. (Reference Moriguchi, Ishizawa and Sanada1990b). In a previous report, fructose concentration was found to be about a quarter of that of glucose in 17 of 107 peach genotypes, derived from a clone of a wild peach (Prunus davidiana) and three generations of crosses with commercial nectarine cultivars (Wu et al. Reference Wu, Quilot, Kervella, Génard and Li2003).
These observations indicate that some genotypes behave differently with respect to production and/or utilization of fructose and glucose, even though glucose and fructose have similar molecular structures, are simultaneously produced by degradation of sucrose, and are highly inter-convertible in growing fruit. To date, very little is known regarding the mechanisms that regulate the balance between glucose and fructose concentrations in peach fruit. Kanayama et al. (Reference Kanayama, Kogawa, Yamaguchi and Kanahama2005) suggested that nicotinamide adenine dinucleotide (NAD+)-dependent sorbitol dehydrogenase (NAD+-SDH) was likely to be responsible for the regulation of fructose concentration in peach fruit. Studies in tomato (Kortstee et al. Reference Kortstee, Appeldoorn, Oortwijn and Visser2007) and peach (Borsani et al. Reference Borsani, Budde, Porrini, Lauxmann, Lombardo, Murray, Andreo, Drincovich and Lara2009) have also shown possible different rates of utilization of glucose and fructose, and unbalanced inter-conversion between glucose and fructose.
Because chains of metabolic processes and diverse mechanisms affect fruit sugar content, and because these are under the influence of environmental factors, development of quality traits, including sugar content, is poorly understood. Given the complexity of the processes, modelling may help to elucidate factors governing sugar accumulation or direct the design of experimental optimization strategies and fruit production. For example, a kinetic model was used to investigate detailed metabolic control of sucrose accumulation in maturing sugarcane culm tissue (Rohwer & Botha Reference Rohwer and Botha2001; Uys et al. Reference Uys, Botha, Hofmeyr and Rohwer2007). A SUGAR model was established by Génard & Souty (Reference Génard and Souty1996) to predict the partitioning of carbon into sucrose, sorbitol, glucose and fructose in the mesocarp of peach fruit, and to determine the relative rates of sugar transformation. However, this model needs to be tested in response to genetic diversity and environmental conditions to make it more generic. First, the SUGAR model was applied to a single peach cultivar, cvar Suncrest, with similar glucose (G) and fructose (F) concentrations (normal G:F) and simulated changes in sugar concentrations during the final rapid growth stage of peach (Génard & Souty Reference Génard and Souty1996; Génard et al. Reference Génard, Lescourret, Gomez and Habib2003). Subsequently, it was simplified to analyse genotypic variation in total sugar content and refractometric index in peach fruit flesh (Quilot et al. Reference Quilot, Génard, Kervella and Lescourret2004; Grechi et al. Reference Grechi, Hilgert, Génard and Lescourret2008), and was modified to simulate seasonal variations in sucrose, glucose and fructose concentration in apricot cvar Bergeron (Génard et al. Reference Génard, Lescourret, Reich, Albagnac and Audergon2006). In the present case, a more generic model needs to be developed to describe cultivars with high G:F ratio. Indeed, the SUGAR model relied on constraining assumptions, including similar utilizations rates of glucose and fructose for synthesis of other compounds, and equivalent inter-conversion rates between glucose and fructose (Génard & Souty Reference Génard and Souty1996; Génard et al. Reference Génard, Lescourret, Gomez and Habib2003).
In the present study, genetic diversity of three peach cultivars with normal G:F, as well as three peach cultivars with lower fructose than glucose concentration (high G:F), were explored. The SUGAR model was modified to take into account specific utilization rates of glucose and fructose to form other compounds, and an unbalanced transformation rate between glucose and fructose, which were not considered before in the SUGAR model. Thus, together with different degradation rates of sorbitol to glucose and fructose (already described in the SUGAR model), the three possible pathways that could result in different concentrations of glucose and fructose were compared to gain insights into the mechanism(s) regulating glucose and fructose accumulation in peach fruit.
MATERIALS AND METHODS
Plant materials
Based on G:F values in mature peach flesh obtained from a previous study in 2003 (Niu et al. Reference Niu, Zhao, Wu, Li, Liu and Jiang2006) and 2004 (data not shown), six cultivars with two contrasting G:F ratios were chosen to investigate seasonal variations of sugars, especially glucose and fructose. In 2005, three normal G:F peach cultivars, Shanyibaitao, Yanhong and Gangshanbai, and three high G:F peach cultivars, Zhanghuang 7, Long 246 and Linbai 7, were studied. Except for cvar Linbai 7, the other five cultivars were also studied in 2007. All trees were grown at the National Field Gene Bank of Peach and Strawberry, Institute of Forestry and Fruit, Beijing Academy of Agriculture and Forestry Sciences (39°90′N, 116°30′E, 60 m asl). They were grafted onto rootstocks of wild peach species and goblet-trained. They were 6–9 years old and received routine horticultural care, including fertilization, pruning, thinning and irrigation, to keep healthy and good fruit quality. Fruits were sampled randomly every 1–2 weeks during the final rapid growth stage until maturity. Depending on cultivar, sampling occurred from July 11 (74–85 days after bloom (DAB)) to maturity August 18–September 1 (124–138 DAB) in 2005 and from July 8 (82–83 DAB) to maturity August 20 (125–126 DAB) in 2007. Sampling was replicated four times, each replicate consisting of two fruits.
Fruit and sugar measurements
At each harvest and for each replicate, mesocarp fresh weight was measured. A part of the fresh mesocarp was then weighed, and dry weight was determined after drying at 70°C for 72 h. The remaining fresh mesocarp was sliced, immediately frozen in liquid nitrogen and stored at −70°C prior to sugar analysis.
For sugar analysis, 1 g of mesocarp tissue was ground to a fine powder with a pestle and mortar, and extracted three times with 6 ml double-distilled water. After centrifugation at 2000 g for 10 min, the supernatants were decanted, passed through a SEP-C18 cartridge (Supelclean ENVI C18 SPE), and filtered through a 0·22 μm filter.
Sucrose, sorbitol, glucose and fructose were determined by high-performance liquid chromatography (HPLC) (Dionex P680; Dionex Corporation, CA, USA). Sugars were detected by a Shodex RI-101 refractive index detector with reference cell maintained at 40 °C. A Transgenomic CARB Sep Coregel 87C column (300 mm×7·8 mm i.d., 10 μm particle size) with a guard column cartridge (Transgenomic CARB Sep Coregel 87C cartridge) was used. The column was maintained at 85°C with a Dionex TCC-100 thermostated column compartment. Degassed, distilled, deionized water at a flow rate of 0·6 ml/min was used as the mobile phase. The injection volume was 10 μl. The Chromeleon chromatography data system was used to integrate peak areas according to external standard solution calibrations.
Daily average temperatures were monitored at a weather station c. 5 km southeast of the study site.
Description of the model
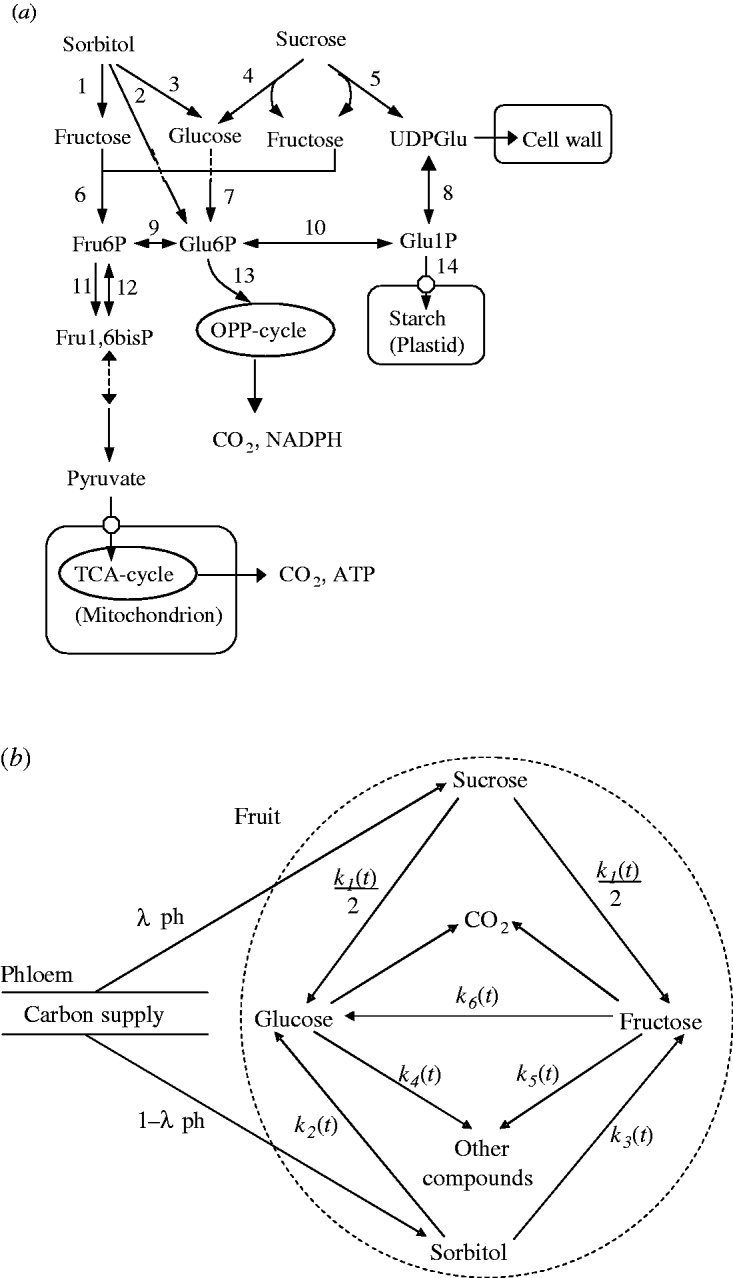
A simplified representation of sugar metabolism in fruit (the SUGAR model) was based on apple (Berüter 2004) and is shown in Fig. 1a. In the Rosaceae family, which includes peach and apple, sorbitol and sucrose are the main assimilates transported in the phloem (Moing et al. Reference Moing, Carbonne, Zipperlin, Svanella and Gaudillère1997). Sugar accumulation during peach fruit growth is mainly from the import of sorbitol and sucrose from photosynthesis in leaves, which is unloaded and enters a number of metabolic pathways. Sorbitol is converted into fructose by NAD+-SDH, and into glucose by sorbitol oxidase (SOX). Sucrose is hydrolysed into glucose and fructose by acid invertase, neutral invertase and sucrose synthase. Glucose and fructose are converted by hexokinase (HK) and fructokinase (FK), respectively, to glucose-6-phosphate (Glu6P) and fructose-6-phosphate (Fru6P), which are further used as substrates for glycolysis and synthesis of compounds other than sugars (e.g. starch, acids, structural carbohydrates and protein). Phosphoglucose isomerase (PGI) can reversibly convert Glu6P and Fru6P.
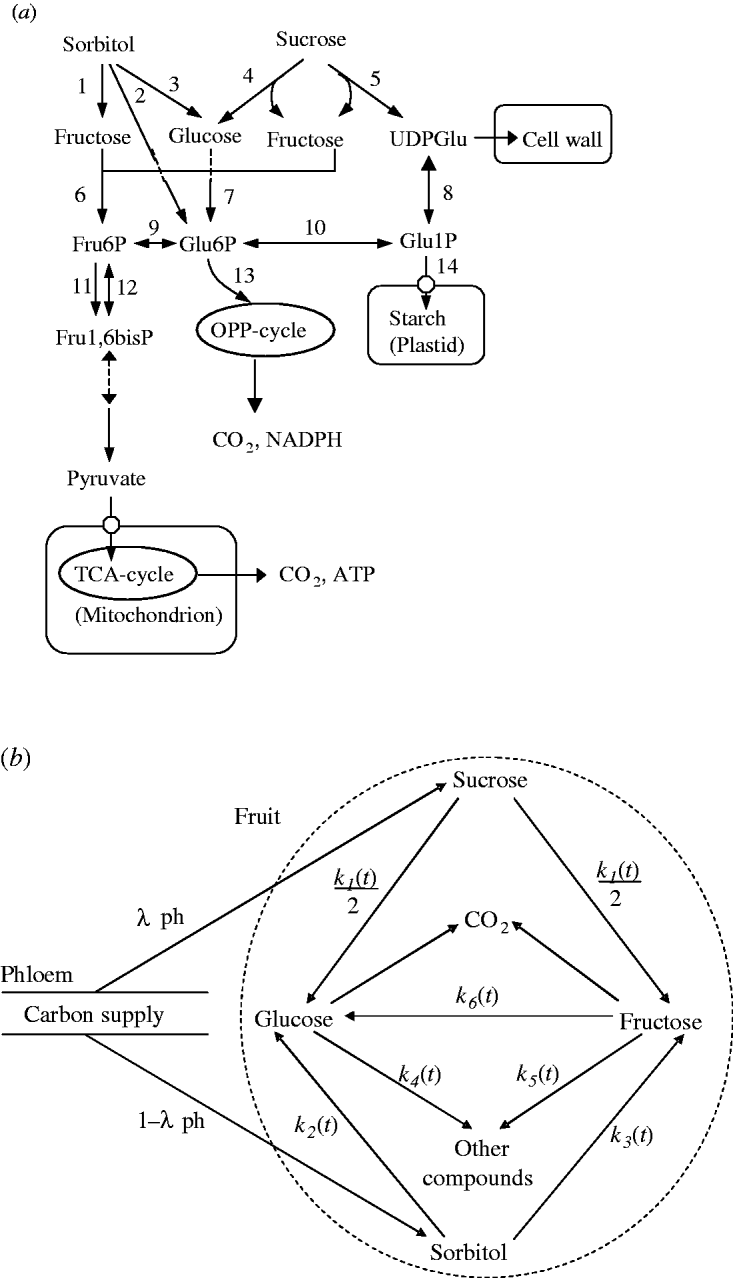
Fig. 1. Carbon metabolism in fruit. (a) A simplified representation of the pathways. Intermediate products are uridine-diphosphate-glucose (UDPGlu), Fru6P, Glu6P, Glu1P and fructose-1,6-bisphosphate (Fru1,6bisP). TCA: tricarboxylic acid cycle; OPP: oxidative pentose phosphate cycle. The enzymes that catalyse the numbered steps are: (1) NAD+-SDH; (2) sorbitol-6-phosphate dehydrogenase (S6PDH); (3) SOX; (4) acid invertase (AI), neutral invertase (NI); (5) sucrose synthase (SS); (6) FK; (7) HK; (8) uridine-diphosphate-glucose pyrophosphorylase (UDPG-PPase); (9) PGI; (10) PGM; (11) phosphofructokinase (PFK); (12) phosphofructophosphotransferase (PFP); (13) glucose-6-phosphate degydrogenase (G6PD); (14) adenosine diphosphate-glucose pyrophosphorylase (ADPG-PPase). (b) Diagram of the SUGARb.
Based on sugar metabolic reactions (Fig. 1a), the SUGAR model assumed: (i) the fruit behaved as a single metabolic compartment with all sugars available for metabolism during the final rapid stage of peach fruit growth; (ii) phloem carbon was unloaded only as sucrose and sorbitol; (iii) conversion of sucrose yielded equal quantities of glucose and fructose; and (iv) carbon used for respiration and synthesis of other compounds only came from glucose and fructose. Compared with the SUGAR model, the modified model referred to as SUGARb (Fig. 1b) considers distinct utilization rates of glucose and fructose to form other compounds and an unbalanced transformation rate between glucose and fructose.
Thus, in the SUGARb model carbon transformations can be described with the following transformation rates: k 1(t) (per day) is net sucrose transformation to glucose and fructose; k 2(t) (per day) is net sorbitol transformation to glucose; k 3(t) (per day) is net sorbitol transformation to fructose; k 4(t) (per day) and k 5(t) (per day) are net glucose and fructose transformations, respectively, to other compounds; and k 6(t) (per day) is net fructose transformation to glucose indirectly through the conversion between Fru6P and Glu6P. In the SUGAR model, k 4(t) was assumed to be equal to k 5(t), and k 6(t) assumed to be null. λph (dimensionless) and 1-λph are the proportions of carbon in the form of sucrose and sorbitol, respectively, from the phloem sugars unloaded into fruit. λph was set to 0·54, based on measurements for phloem sap of a peach rootstock (GF305) by Moing et al. (Reference Moing, Carbonne, Rashad and Gaudillère1992).
The carbon fluxes in the forms of sucrose, glucose, fructose and sorbitol in the mesocarp per day (dMsu/dt, dMgl/dt, dMfr/dt, dMso/dt, g C/d) in the SUGARb model are expressed as follows:


where Msu, Mgl, Mfr and Mso (g C) are the amount of carbon in the form of sucrose, glucose, fructose and sorbitol in the mesocarp, respectively. dMph/dt (g C/d) is the carbon flux unloaded from phloem into fruit per day, and dMre/dt (g C/d) is the carbon flux used for fruit respiration per day, t is the time expressed in DAB.
The amount of carbon in the form of sugar i in the mesocarp (Mi, i=su, gl, fr and so) is calculated:
where Ci is the measured concentration of sugar i (g/100 g FW), FW the fresh mesocarp weight and σi the carbon concentration of sugar i (g C/g sugar i), which are 0·421, 0·400, 0·400 and 0·395 g C/g for sucrose, glucose, fructose and sorbitol, respectively.
Based on Génard et al. (Reference Génard, Lescourret, Gomez and Habib2003), the following equations were chosen to describe metabolic variations with fruit development:
where DW is the daily dry mesocarp weight. k 1(t) decreases exponentially with DAB, k 1,1 is the relative rate of decrease in k 1(t), and k 1,2 is the DAB when k 1(t)=1 per day. k 2, k 3 and k 6 ( per day) are transformation rates that remain constant during the experimental period. Since the variables k 4(t) and k 5(t) are proportional to relative growth rate ((1/DW)(dDW/dt)), parameters k 4 and k 5 are dimensionless empirical parameters.
Model inputs and initial conditions
Daily average temperature and daily mesocarp dry weight were inputs into the SUGARb model. Initial values were mesocarp fresh and dry weight, and sugar concentrations on the first date of the modelled period (about 70 DAB), and they were used to calculate initial mass of carbon for each sugar.
The respiration flux of carbon (dMre/dt, g C/d) was expressed as the sum of maintenance respiration and growth respiration:

where T (°C) is daily mean air temperature, q m (g C/g/d) is the maintenance respiration coefficient at 20°C, q g (g C/g) the growth respiration coefficient, and Q 10 the temperature ratio of maintenance respiration (dimensionless). Values of q m, q g and Q 10, taken from DeJong et al. (Reference DeJong, Doyle and Day1987) and DeJong & Goudriaan (Reference DeJong and Goudriaan1989), are 0·000652 g C/g/d, 0·084 g C/g and 1·96. dDW/dt (g/d) is the growth rate of dry mesocarp.
Phloem flux of carbon into the fruit (dMph/dt) is calculated as follows:
where σdw is the carbon concentration of the mesocarp (g C/g DW) that is assumed to be constant, 0·445 g C/g DW (Génard & Souty Reference Génard and Souty1996), during the final stage of fruit growth.
Model parameterization
Daily fresh (FW) and dry mesocarp weight (DW) were estimated from the measured values by regression (Bates & Chambers Reference Bates, Chambers, Chambers and Hastie1992). The cumulative data for each cultivar from 2005 and 2007 were subjected to the SUGARb model, and the parameter values were estimated by non-linear least squares.
Comparisons of models
F-test and likelihood ratio test (LR) were used to compare the SUGAR model and the SUGARb model, in terms of fit quality. The SUGAR model included five parameters, k 1,1, k 1,2, k 2, k 3 and k 4 and the SUGARb model included the same five parameters with two additional ones, k 5 and k 6. The F-test was performed by analysis of variance (S-Plus ‘ANOVA’ function), and it identified significant pairwise differences between the models (P<0·05). The LR test followed a χ2 distribution (P<0·05) with the formula:
where n is the observation number (sample size), RRSSUGAR and RRSSUGARb are, respectively, the residual sum of squares of the SUGAR model and the SUGARb model.
RESULTS
Characteristics of glucose and fructose concentrations
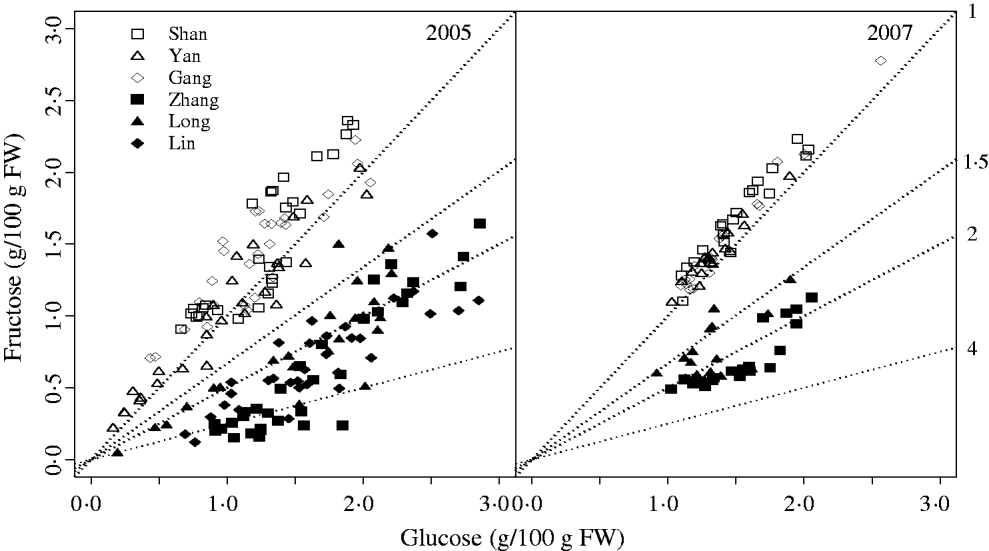
The characteristic G:F ratio for a given cultivar was independent of year and developmental stage (Fig. 2). Glucose and fructose concentrations for cvars Shanyibaitao, Yanhong and Ganghanbai were quite close to each other throughout the final rapid growth stage (74–85 DAB to maturity) with G:F ratios ranging from 0·8 to 1·5. For cvars Zhanghuang 7, Long 246 and Linbai 7, G:F generally ranged from 1·5 to 7·8.
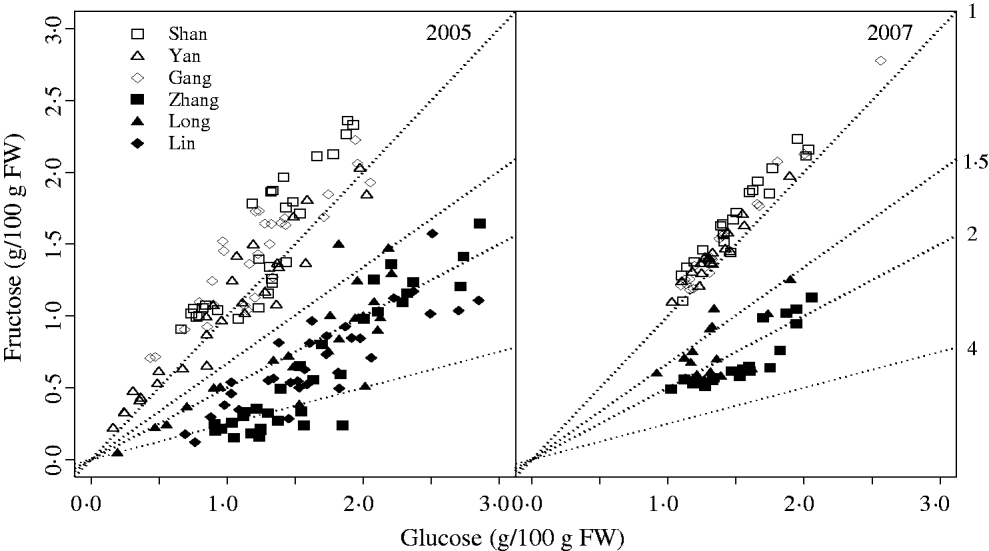
Fig. 2. Glucose and fructose concentrations in the mesocarp of normal G:F cvars Shanyibaitao (Shan), Yanhong (Yan) and Gangshanbai (Gang), and high G:F cvars Zhanghuang 7 (Zhang), Long 246 (Long) and Linbai 7 (Lin). Data are measured values from fruits sampled every 1–2 weeks during the final rapid growth stage. The numbers outside the right y-axis are glucose-to-fructose concentration ratios.
Parameterization and comparisons of parameter values
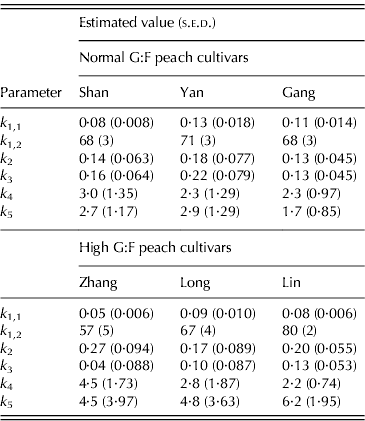
During the parameterization process of the SUGARb model, estimated values of k 6 (net conversion rate of fructose to glucose) were not significantly different from zero (data not shown). This indicated that hexosephosphate interconversion by PGI was in equilibrium in all the studied cultivars. Consequently, k 6 values were set to zero for all the cultivars and the other six parameters were estimated again (Table 1).
Table 1. Parameter values (+s.e.d.) for normal G:F cvs. Shanyibaitao (Shan), Yanhong (Yan) and Gangshanbai (Gang), and high G:F cvs. Zhanghuang 7 (Zhang), Long 246 (Long) and Linbai 7 (Lin)
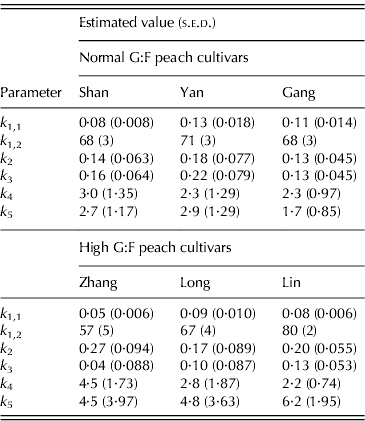
Differences in k 1,1 and k 1,2 values were found between cultivars in each G:F group. However, no specific characteristics appeared between normal and high G:F groups: k 1,1 of normal G:F cultivars (0·084–0·133 per day) was either higher than or similar to that of high G:F cultivars (0·054–0·086 per day), while k 1,2 of the three normal G:F cultivars (68–71 DAB) were intermediate compared to those of high G:F cultivars (57–80 DAB). The relative rates of sucrose transformation to glucose and fructose (k 1(t)), expressed by k 1,1 and k 1,2, also showed no differences between normal and high G:F groups, and it decreased with fruit development and approached zero at maturity (not shown).
The relative rates of sorbitol transformation to glucose (k 2) and to fructose (k 3) showed little differences for normal G:F cultivars, ranging from 0·128 to 0·215 per day, which indicated similar conversion rates of sorbitol to glucose and fructose. For high G:F cvars Zhanghuang 7 and Long 246, k 2 values were 0·268 and 0·166 per day, while k 3 values were near to zero. For high G:F cvar Linbai 7, k 2 (0·197 per day) and k 3 (0·132 per day) showed no obvious difference.
The utilization rates of glucose (k 4) and fructose (k 5) for normal G:F cultivars were similar, and k 4 or k 5 was about 1·1–1·3 times that of k 5 or k 4. k 4 for high G:F cvars Long 246 and Linbai 7 (2·77 and 2·21, respectively) were roughly in the range of normal G:F cultivars (2·28–2·98), while k 5 (4·80–6·23) were obviously higher than those of normal G:F cultivars (1·72–2·91), being 1·7–2·8 times that of k 4. In contrast, for high G:F cvar Zhanghuang 7, k 4 and k 5 were similar.
Comparisons of models
Using F-test and LR test, there was no significant difference in goodness of fit between the SUGAR and the SUGARb models for each cultivar (Table 2), which indicted that adding new pathways (represented by parameters k 5 and k 6) to extend the SUGAR model did not change the prediction quality of sugar accumulation for any of the cultivars.
Table 2. F-test and LR test between the SUGAR and SUGARb models for normal G:F cvs. Shanyibaitao (Shan), Yanhong (Yan) and Gangshanbai (Gang), and high G:F cvs. Zhanghuang 7 (Zhang), Long 246 (Long) and Linbai 7 (Lin)

ns: no significant difference between the SUGAR and SUGARb models at P<0·05.
Simulated seasonal sugar concentrations
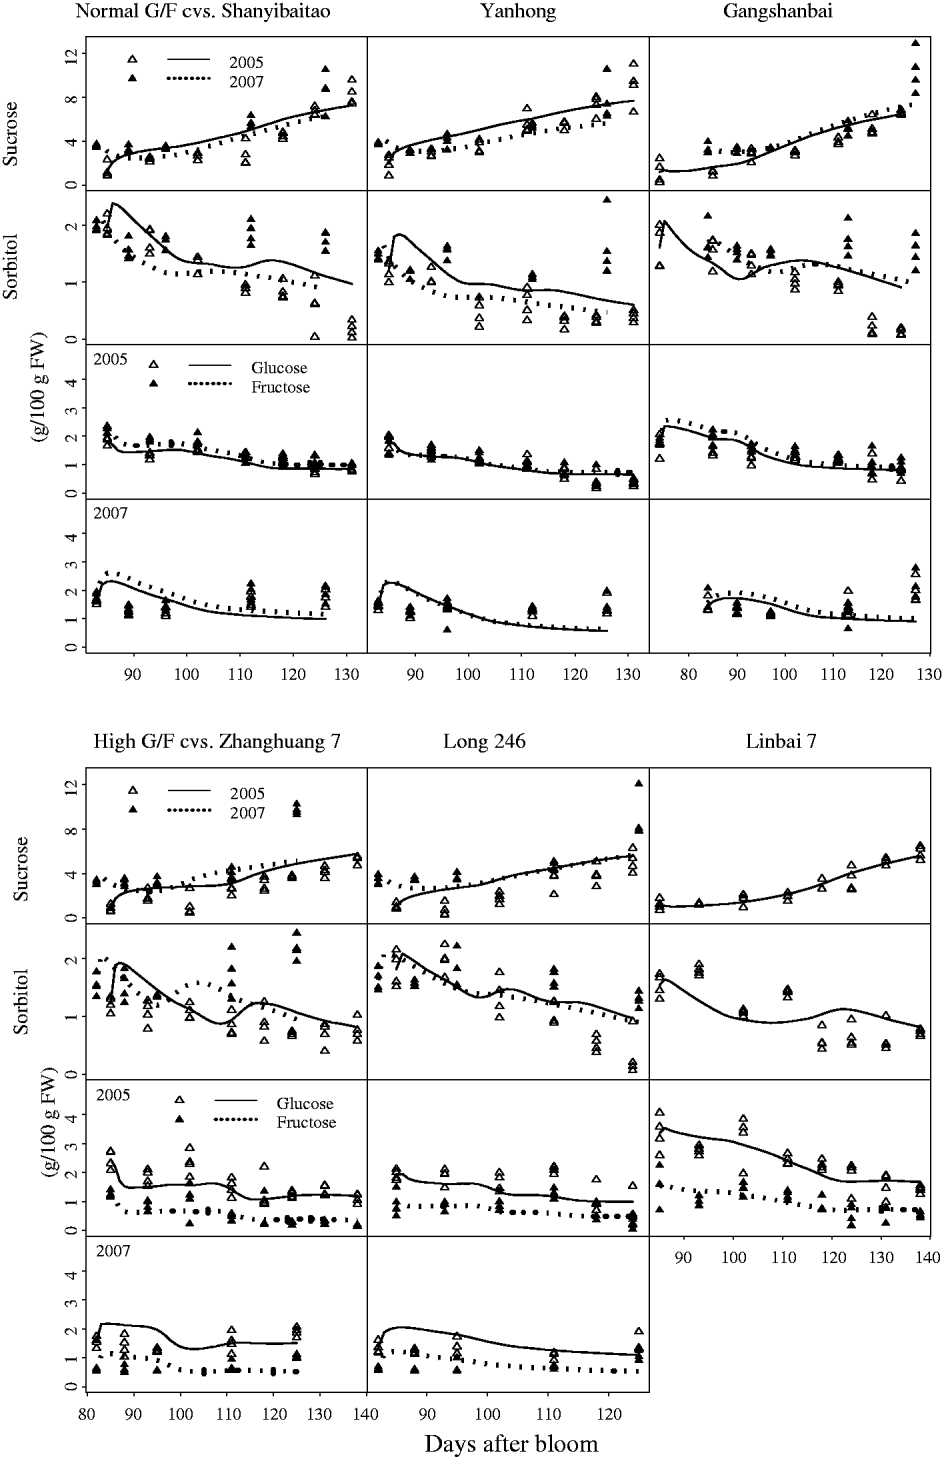
Although standard errors of the parameters for the SUGARb model were rather high in some cases (Table 1), the simulated seasonal variations in sugars matched well with experimental data for normal and high G:F cultivars (Fig. 3). Simulated curves of seasonal variations in sugars were well within the measured data in 2005 and 2007. The SUGARb model was able to simulate seasonal variations in sugar concentrations for both normal and high G:F cultivars, and reproduced accurately the difference in glucose and fructose concentrations during the season. The main discrepancies between measured and simulated seasonal variations appeared in 2007: sorbitol concentrations were underestimated, and glucose and fructose concentrations were overestimated at the beginning of the experimental period and underestimated at the end, especially for normal G:F cultivars.
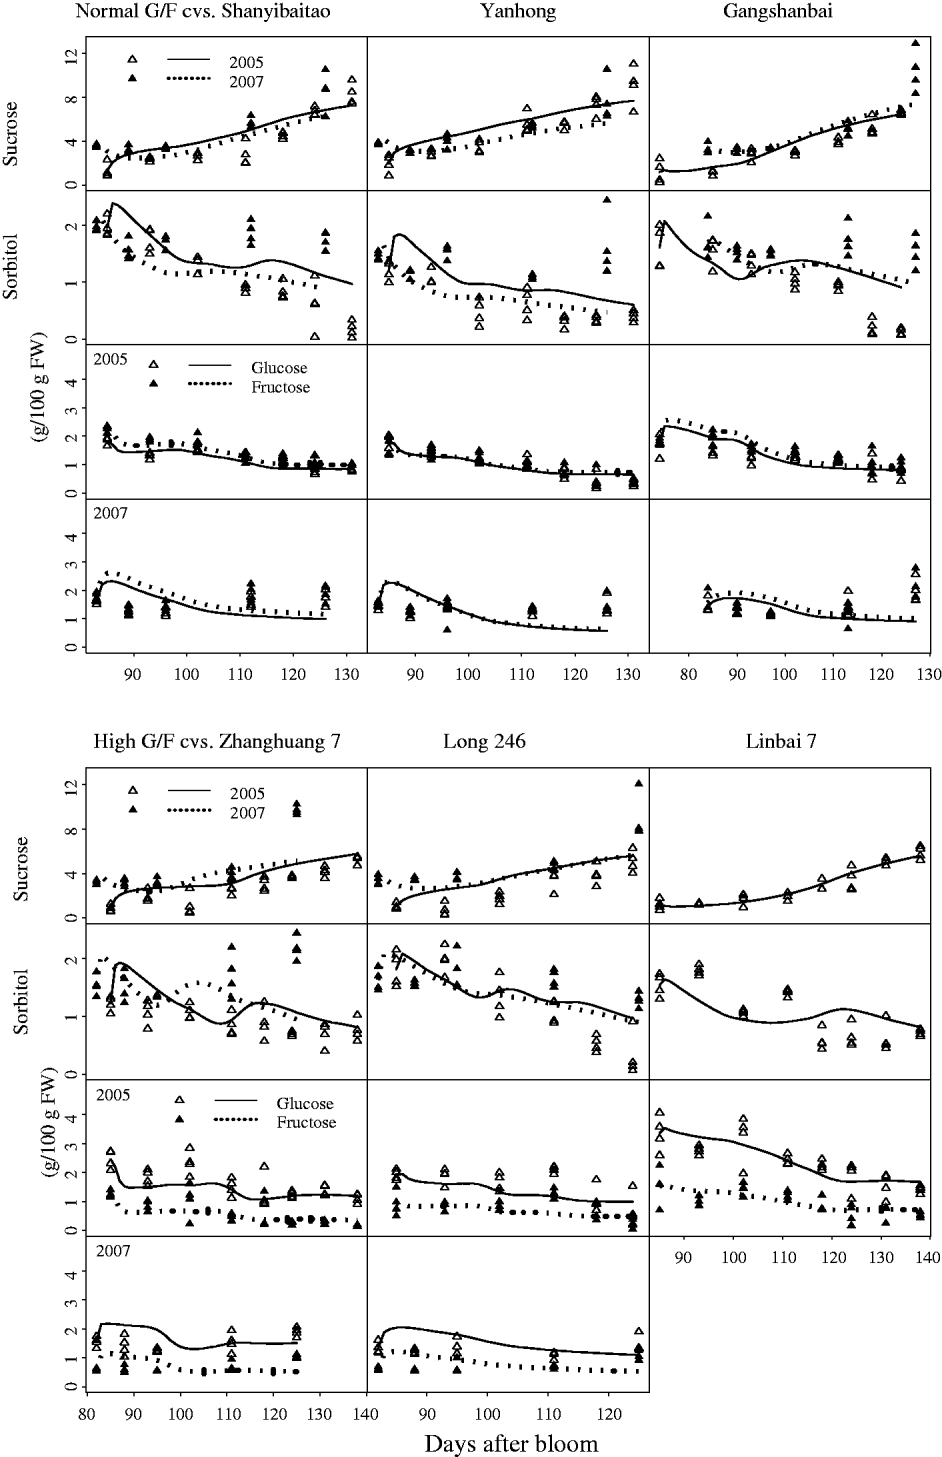
Fig. 3. Observed (triangles) and simulated (lines) seasonal variations of sugar concentrations for normal G:F cvs. Shanyibaitao, Yanhong and Gangshanbai, and high G:F cvs. Zhanghuang 7, Long 246 and Linbai 7 using the SUGARb model.
DISCUSSION
In the present study, the SUGAR model of Génard et al. (Reference Génard, Lescourret, Gomez and Habib2003) was extended (SUGARb model) to investigate the mechanisms responsible for different G:F ratios in peach fruit. The SUGARb model includes two additional parameters (k 5 and k 6). Although the SUGARb model does not improve prediction quality, it is more generic and enlarges the utility and range of the SUGAR model. The SUGAR model assumed k 4=k 5 and k 6=0. According to the results of the parameter estimation using the SUGARb model, k 6 can be assumed equal to zero whatever the cultivar and the G:F ratio. However, the assumption that k 4=k 5 was found to be acceptable for the normal G:F cultivars and for the high G:F cvar Zhanghuang 7, but not for the other two high G:F cvars Long 246 and Linbai 7. Therefore, the generic SUGARb model can be used to investigate the effective mechanisms responsible for different G:F ratios, whereas the SUGAR model assumes that only one strategy is possible.
The SUGARb model simulated seasonal variations in sugar concentrations for both normal and high G:F cultivars well, although some discrepancies were observed. The proportion of sucrose in the phloem (λph) was supposed constant in the study during the final rapid growth stage. However, it has been reported to fluctuate between 0·23 and 0·54 for the peach rootstock GF305 in response to growth conditions (e.g. water stress) (Escobar-Gutiérrez & Gaudillère Reference Escobar-Gutiérrez and Gaudillère1997; Escobar-Gutiérrez et al. Reference Escobar-Gutiérrez, Zipperlin, Carbonne, Moing and Gaudillère1998; Lo Bianco et al. Reference Lo Bianco, Rieger and Sung2000), and has been estimated at 0·35 for peach cvar Suncrest (Génard et al. Reference Génard, Lescourret, Gomez and Habib2003) and 0·26 for cvar RedHaven (Nadwodnik & Lohaus Reference Nadwodnik and Lohaus2008). The sucrose–sorbitol ratio in leaves has also been reported to vary with genotype (Escobar-Gutiérrez & Gaudillère Reference Escobar-Gutiérrez and Gaudillère1994), that could influence the proportion of sucrose in the phloem. No information is available about sugars in the phloem for the cultivars in the present study or their evolution during fruit development. The maximum, median and minimum λph values (0·23, 0·35 and 0·54) were taken in the above references, and it was found that the results of parameterization were comparable with λph values of 0·35 and 0·54, whatever the cultivars. In contrast, solving model parameterization using a low λph value (0·23) was not always possible (data not shown). Fit quality for models with λph 0·35 and 0·54 were similar, but better for more cultivars with λph 0·54. Thus, λph 0·54 was chosen for all the cultivars during the final rapid fruit growth stage. Nevertheless, the variation of λph among cultivars and with fruit development would have to be considered in future modelling that might improve simulations.
In the SUGARb model, the net sucrose transformation to glucose and fructose (k 1(t)), together with the proportion of sucrose in the phloem (λph), determined sucrose accumulation. As λph is supposed to be constant during the final rapid growth stage of the fruit, the decrease in k 1(t) indicated that accumulation of sucrose in peach mesocarp approaching maturity is mostly due to a decrease in the activities of all enzymes (acid invertase, neutral invertase and sucrose synthase) related to sucrose breakdown (Vizzotto et al. Reference Vizzotto, Pinton, Varanini and Costa1996; Lo Bianco et al. Reference Lo Bianco, Rieger and Sung1999). Since k 1(t) differed according to cultivar but not to G:F status (as mentioned above), different G:F ratios in peach mesocarp would not be related to sucrose accumulation.
The relative rates of sorbitol transformation to glucose (k 2) and to fructose (k 3) showed considerable differences in case of high G:F cvars Zhanghuang 7 and Long 246. This was in accordance with the report of Kanayama et al. (Reference Kanayama, Kogawa, Yamaguchi and Kanahama2005), showing that NAD+-SDH activities, which catalyses sorbitol to fructose formation, were always lower in the two high G:F peach cvars Nagano yaseito Early and Notozairaito No. 2 than in the two normal G:F peach cvars Akatsuki and Kawanakajima hakuto. Kanayama et al. (Reference Kanayama, Kogawa, Yamaguchi and Kanahama2005) suggested that differences in the capacity for fructose formation by NAD+-SDH might be an important factor controlling fructose concentration in peach fruit. However, results reported in the present study for the high G:F cvar Linbai 7 did not show obvious difference between k 2 and k 3. This indicated that a low relative rate of sorbitol conversion to fructose could result in low fructose in some high G:F cultivars but not in some other high G:F cultivars, such as cvar Linbai 7.
The utilization rate of fructose (k 5) was obviously higher than the utilization rate of glucose (k 4) for high G:F cvars Long 246 and Linbai 7, while k 4 and k 5 were similar for high G:F cvar Zhanghuang 7. Glucose and fructose are transformed by HK and FK, respectively, to Glu6P and Fru6P, which are used for glycolysis. Kanayama et al. (Reference Kanayama, Kogawa, Yamaguchi and Kanahama2005) showed that the high G:F cvar Naganoyaseito Early had a higher FK activity than normal G:F cultivars, while another high G:F cultivar, cvar Notozairaito NO. 2, had a lower FK activity than normal G:F cultivars. Consequently, high relative utilization rate of fructose was also not a universal pathway resulting in low fructose for all the high G:F cultivars.
So far, only Kanayama et al. (Reference Kanayama, Kogawa, Yamaguchi and Kanahama2005) has made a contrasting study of normal v. high G:F cultivars, and information on glucose and fructose utilization and the conversion between them during peach fruit development is still limited. High G:F ratios were also reported in some other species, for example, tomato, pear and apple, although all of them usually displayed higher fructose than glucose concentrations. Dai et al. (Reference Dai, German, Matsevitz, Hanael, Swartzberg, Yeselson, Petreikov, Schaffer and Granot2002) found that a reduction in FK activity could explain higher fructose in tomato species (L. hirsutum). Suzuki et al. (Reference Suzuki, Odanaka and Kanayama2001) suggested that both low FK and high NAD+-SDH activities contribute to fructose accumulation in Japanese pear (Pyrus pyrifolia Nakai). Schaffer et al. (Reference Schaffer, Petreikov, Miron, Fogelman, Spiegelman, Bnei-Moshe, Shen, Granot, Hadas, Dai, Levin, Bar, Friedman, Pilowsky, Gilboa and Chen1999) and Suzuki et al. (Reference Suzuki, Odanaka and Kanayama2001) considered that PGI was unlikely to be responsible for the regulation of fructose levels in these two species. However, hexosephosphate interconversion was not in equilibrium, and phosphoglucomutase (PGM), which interconverts Glu6P and glucose-1-phosphate (Glu1P), was also involved in the regulation of carbon partitioning (Berüter Reference Berüter2004). Therefore, though a lower formation rate of fructose (k 3(t)) than glucose (k 2(t)) from sorbitol and/or a higher utilization rate of fructose (k 5(t)) than that of glucose (k 4(t)) might be preferential strategies for forming high G:F ratios, as shown in the present study from modelling, hexosephosphate interconversion (k 6) cannot be ignored and needs to be tested using a wider genetic range.
Consequently, more enzymatic and biochemical studies are necessary to elucidate further the three pathways. In addition, studies on other high G:F genotypes from diverse origins, for example, Chinese wild species, Prunus kansuensis and Prunus ferganensis, would be useful to explore the potential variability of the mechanisms that regulate glucose and fructose accumulation in peach fruit. In the near future, computing the relative contribution of each sugar to sweetness during fruit development through the SUGARb model looks promising and could allow dynamic evaluation of fruit quality as it develops. Moreover, the present models may be useful for understanding hexose accumulation in other species with differing glucose and fructose concentrations, i.e. apple and pear with higher fructose than glucose concentrations, and apricot with lower fructose than glucose concentrations.
The authors thank Q. Jiang for his offer of peach germplasm, X. H. Jin for temperature data, J. Niu for her assistance in sugar measurements, and D. D. Archbold (Department of Horticulture, University of Kentucky, USA) for improving English language. This research was funded by National Natural Science Foundation of China (NSFC 30600418).


