


Introduction
Sheep productivity and survival depend largely on the ability of the animals to retain and mobilize body fat (BF) reserves, depending on their nutritional and physiological status. In this regard, one of the most critical periods is early lactation, when the high energy demand requires the mobilization of fat reserves for milk synthesis, risking even a negative effect on postpartum ovarian activity when energy reserves are limited (Chilliard et al., Reference Chilliard, Bocquier and Doreau1998; Butler, Reference Butler2003; Friggens, Reference Friggens2003; Forcada and Abecia, Reference Forcada and Abecia2006). Hence, it is important to monitor fat reserves in order to keep them at a level that does not compromise sheep productivity. Live weight (LW) and body condition score (BCS) are the most common predictors of BF reserves since they are quite simple to use and both have been considered good predictors of the level of fatness (Frutos et al., Reference Frutos, Mantecón and Girádez1997). In comparison with LW, BCS bypasses the effect of factors such as mature size, gut fill and physiological state (e.g. pregnancy). However, depending on the breed, there may be a different pattern of fat distribution within the body (Taylor et al., Reference Taylor, Murray and Thonney1989) and, in general, dairy breed ewes tend to deposit more fat in internal depots, while meat breed ewes tend to deposit more fat in the carcass depots (Kempster, Reference Kempster1981; Lambe et al., Reference Lambe, Conington, McLean, Navajas, Fisher and Bünger2006; Caldeira and Portugal, Reference Caldeira and Portugal2007). Given the higher proportion of non-carcass fat in the total fat of dairy breed ewes and the lower correlation between BCS and non-carcass fat than between BCS and carcass fat (CF), the accuracy of BCS as a predictor of internal fat (and total fat) can decrease (Frutos et al., Reference Frutos, Mantecón and Girádez1997). Therefore, there is a need for a more objective and precise method, easy to use in typical animal handling conditions, to predict the internal fat of dairy breed ewes such as Churra ewes. Several studies have already shown the high potential of ultrasonography for in vivo estimation of compositional traits in sheep, but most of them are concerned with lamb carcass and meat quality (Teixeira et al., Reference Teixeira, Matos, Rodrigues, Delfa and Cadavez2006; Ripoll et al., Reference Ripoll, Joy, Alvarez-Rodriguez, Sanz and Teixeira2009; Thériault et al., Reference Thériault, Pomar and Castonguay2009; Emenheiser et al., Reference Emenheiser, Greiner, Lewis and Notter2010; Orman et al., Reference Orman, Caliskan and Dikmen2010; Hosseini Vardanjani et al., Reference Hosseini Vardanjani, Miraei Ashtiani, Pakdel and Moradi Shahrebabak2014; Grill et al., Reference Grill, Ringdorfer, Baumung and Fuerst-Waltl2015). There have also been some studies of chemical body composition in lambs (Silva et al., Reference Silva, Gomes, Dias-da-Silva, Gil and Azevedo2005) and mature ewes (Silva et al., Reference Silva, Afonso, Guedes, Gomes, Santos, Azevedo and Dias-da-Silva2016). However, there is much less information on the use of ultrasonography for in vivo estimation of the internal adipose depots (IntF), namely in mature ewes. Chay-Canul et al. (Reference Chay-Canul, Garcia-Herrera, Meza-Villalvazo, Gomez-Vazquez, Cruz-Hernandez, Magaña-Monforte and Ku-Vera2016) obtained poor estimates of BF reserves in Pelibuey ewes using ultrasonic measurements of backfat thickness. However, working with Aragonesa ewes, Mendizabal et al. (Reference Mendizabal, Delfa, Arana, Eguinoa, González, Treacher and Purroy2003) observed that ultrasonic measurements of fat thickness at the sternum improved the estimates of BF reserves significantly when used together with LW. Silva et al. (Reference Silva, Afonso, Santos, Monteiro, Guedes, Azevedo and Dias-da-Silva2006) also obtained some promising results, testing two different probes to estimate the amount of IntF, but the experimental population included Île-de-France lambs as well as Churra da Terra Quente ewes. As in most previous studies about the use of ultrasonography to predict compositional traits, Silva et al. (Reference Silva, Afonso, Santos, Monteiro, Guedes, Azevedo and Dias-da-Silva2006) only tested a very limited number of scanning sites and the predictive value of different scanning sites can be affected by factors such as the breed or the physiological state of the experimental animals (e.g. growing animals v. mature animals). With this in mind, the objective of the present study was to analyse the potential of real-time ultrasound measurements (RTU) to predict carcass and the IntF of Churra da Terra Quente (CTQ) ewes, complementing the study of Silva et al. (Reference Silva, Afonso, Guedes, Gomes, Santos, Azevedo and Dias-da-Silva2016).
Materials and methods
Animals, slaughter and carcass
The experimental population consisted of 51 shorn, non-pregnant and non-lactating CTQ ewes, 4–7 years old with a mean LW of 42 ± 7.4 kg. Ewes were fasted for 18 h and then weighed before being stunned using a captive bolt and exsanguinated. Afterwards, the animals were skinned very carefully to minimize any removal of subcutaneous fat (SF). Once the udder and internal organs had been removed, the head was separated at the atlanto-occipital joint and the extremities separated at the level of carpal-metacarpal and tarsal-metatarsal joints (Fisher and De Boer, Reference Fisher and De Boer1994).
Body adipose depots
After slaughter, the IntF – mesenteric (MesF), omental (OmF), thoracic (ThoF) and kidney knob and channel fat (KKCF), being ThoF surrounding the heart – were carefully obtained and weighed. Both MesF and OmF were removed in the research abattoir, while ThoF and KKCF were dissected later from the carcass after chilling at 4 °C for 24 h. Total weight of IntF was calculated by summing the weights of these four depots. The carcass adipose depots were obtained after full carcass dissection in muscle, bone, SF and intermuscular fat (ImF). Carcass fat was estimated as the sum of SF and ImF, and BF as the sum of IntF and CF. Table 1 shows the means, standard deviation (s.d.) and ranges for ewe traits (in absolute value and as content per kg of LW).
Table 1. Mean, standard deviation (s.d.) and ranges of live weight (LW), cold carcass weight (CW), lean, bone and adipose depots weight, and of CW and tissues expressed in terms of content per kg of LW of the ewes (n = 51)

SF, subcutaneous fat; ImF, intermuscular fat; CF, carcass fat; OmF, omental fat; MesF, mesenteric fat; ThoF, thoracic fat; KKCF, kidney knob and channel fat; IntF, internal fat; BF, body fat.
Ultrasound image capture
Just before slaughter, the animals were scanned with an Aloka real-time scanner (Aloka 500 V, Tokyo, Japan) using a linear probe of 7.5 MHz (UST-5512U-7.5, Tokyo, Japan). The ewes were individually restrained in a crate to minimize movement and ensure they were standing in a similar stance. The probe was placed perpendicular to the backbone, over the 9th, 11th and 13th thoracic vertebrae, and over the 1st, 3rd and 5th lumbar vertebrae. The probe was also used at the middle of the thoracic cage, over the thoracic wall, between the 10th and 11th ribs, and over the 3rd sternebra of the sternum. At all these anatomical points, the wool was first clipped close to the skin and an ultrasound gel was used as a coupling medium. The ultrasound images were captured using a digital camera (Sony DCR-HC96E, Tokyo, Japan). During all RTU image capture sessions, the transition from one anatomical site to the other followed the same order.
Ultrasound image analysis
The digital images recorded were examined and, once a suitable image was selected, a frame was extracted as a 724 × 580 JPEG image file. The measurements were performed using Fiji software (http://fiji.sc/Fiji, NIH, USA). The area (MA), depth (MD) and major axis (MX) of the longissimus thoracis et lumborum muscle were measured in all RTU images taken over the thoracic and lumbar vertebrae, as well as SF depth with and without skin (respectively SFd and SFSkin). For all SFd and SFSkin measurements, an average of three depths was considered. This procedure allows overcoming variations in the thickness of the SF over the longissimus thoracis et lumborum muscle. Measurements of soft tissue depth were taken at the thoracic wall between the 10th and 11th ribs (TDrib) and over the sternum (TDst). Figure 1 shows representative RTU images from which the measurements were taken and Table 2 shows the means, s.d. and ranges for RTU measurements.

Fig. 1. Representative RTU images from which the measurements were taken: (a) representation of the longissimus thoracis et lumborum muscle measurements area (MA), depth (MD) and major axis (MX); (b) measurements of subcutaneous fat thickness plus skin were taken at three different locations to determine the mean SFskin value. For the SF measurement, a similar procedure was followed; (c) tissue depth between the 10th and 11th ribs (TDrib) over the obliquus externus abdominis muscle; (d) tissue depth over the sternum (TDst).
Table 2. Mean (standard deviation, s.d.) and range values of real-time ultrasound (RTU) measurements obtained over the backbone, the thoracic wall and the sternum of the ewes (n = 51)

SFSkin, subcutaneous fat depth with skin; SFd, subcutaneous fat depth; MD, longissimus thoracis et lumborum muscle depth; MA, longissimus thoracis et lumborum muscle cross-sectional area; MX, longissimus thoracis et lumborum muscle major axis; TDrib, soft tissue depth at the thoracic wall between the 10th and 11th ribs; TDst, soft tissue depth at the thoracic wall over the 3rd sternebra of the sternum.
Statistical analysis
A simple descriptive statistical analysis was done for LW, adipose depots and RTU measurements. The data were analysed following two different approaches – correlation analysis and multiple linear regression. The multiple regression models were built to predict the absolute weight and the content per kg of LW for carcass adipose depots, IntF and BF (dependent variables) with LW and RTU measurements (independent variables). In addition, the eight scanning sites were tested, in order to determine the single scanning site providing the most accurate estimates of all the traits of interest. These models were then combined with k-fold cross-validation – a tenfold cross-validation technique was used to provide an assessment of the stability of the regression models. The accuracy of the estimates was based on the k-fold coefficient of determination (k-fold-R 2), while the root mean square error of the cross-validation (RSDcv) was used to determine the precision of the prediction model. The values of RSDcv were expressed in the same units as the dependent variable term, allowing comparison with the raw standard deviation of the variable (Lambe et al., Reference Lambe, Navajas, Bünger, Fisher, Roehe and Simm2009). Additionally, as an indicator of the overall prediction ability of k-fold cross-validation models, the ratio of prediction to deviation (RPD) was evaluated, calculated as the ratio of standard deviation (s.d.) of the reference values to the RSD of cross-validation (RPD = s.d./RSDcv). All statistical procedures were carried out using the JMP software version 13 (SAS Institute, Cary, NC, USA).
Results
Table 3 shows the correlation values of the adipose depots (in terms of absolute weight and also in terms of content per kg of LW) with LW and the different RTU measurements. Only ThoF expressed in terms of content per kg of LW showed no significant correlation with LW (r = 0.174; P > 0.05) nor with RTU measurements (0.114 ⩽ r ⩽ 0.221; P > 0.05). All the other correlations were significant and positive. In agreement with the findings of Silva et al. (Reference Silva, Afonso, Santos, Monteiro, Guedes, Azevedo and Dias-da-Silva2006), LW and RTU measurements showed higher correlations with the different adipose depots when the latter was expressed in terms of absolute weight (g) instead of content per kg of LW. The measurements that showed the highest correlations (P < 0.01) with the weight of most adipose depots were LW (0.630 ⩽ r ⩽ 0.902), SFSkin (0.544 ⩽ r ⩽ 0.939) and SFd (0.548 ⩽ r ⩽ 0.932). The only adipose depot with which LW and RTU muscle measurements showed higher correlations than SFSkin and SFd was MesF (r = 0.731 for LW, 0.564 ⩽ r ⩽ 0.733 for muscle measurements and 0.672 ⩽ r ⩽ 0.694 for SFSkin and SFd; P < 0.01). For SF, ImF, CF, OmF, IntF and BF expressed as content per kg of LW, there was a similar pattern regarding the RTU measurements showing the highest correlation with these adipose depots, just with smaller correlation values (0.788 ⩽ r ⩽ 0.929 against 0.849 ⩽ r ⩽ 0.939; P < 0.01). There was a larger decrease in the correlation values of LW with the different adipose depots when these were expressed as content per kg of LW than with the correlation values of the other predictors.
Table 3. Correlation values between the adipose depots (weight and content per kg of LW) and LW and RTU measurements. For thoracic and lumbar RTU measurements a range of the correlation values was considered (n = 51)a

LW, live weight; RTU, real-time ultrasound; SFSkin, subcutaneous fat depth with skin; SFd, subcutaneous fat depth; MD, longissimus thoracis et lumborum muscle depth; MA, longissimus thoracis et lumborum muscle cross-sectional area; MX, longissimus thoracis et lumborum muscle major axis; TDrib, soft tissue depth at the thoracic wall between the 10th and 11th ribs; TDst, soft tissue depth at the thoracic wall over the 3rd sternebra of the sternum; SF, subcutaneous fat; ImF, intermuscular fat; CF, carcass fat; OmF, omental fat; MesF, mesenteric fat; ThoF, thoracic fat; KKCF, kidney knob and channel fat; IntF, internal fat; BF, body fat.
a r < 0.272, P > 0.05; r > 0.273, P < 0.05; r > 0.354, P < 0.01.
As shown in Table 4, across the different locations of thoracic and lumbar RTU measurements, there was a larger variation in the correlation of the different adipose depots with muscle measurements (MD, MA and MX) than with fat measurements (SFSkin and SFd). This was particularly noticeable for MD and MA – considering the correlation values of these measurements with adipose depot weights, the smallest amplitude of variation across the different thoracic and lumbar locations was observed between MA and ThoF (0.505 ⩽ r ⩽ 0.558; P < 0.01) and the largest was observed between MD and ImF (0.496 ⩽ r ⩽ 0.757; P < 0.01). Much more constant were the correlation values of SFSkin and SFd with the adipose depot weights across the different thoracic and lumbar locations, the smallest amplitude of variation being observed between SFSkin and ImF (0.920 ⩽ r ⩽ 0.925; P < 0.01) and the largest being observed between SFSkin and KKCF (0.799 ⩽ r ⩽ 0.842; P < 0.01).
Table 4. Equations (mean values ± s.e.) and corresponding coefficient of determination k-fold (k-fold-R 2), root mean square error of the cross-validation (RSDcv) and ratio of prediction to deviation (RPD) for the prediction of adipose depots weight and adipose depots content per kg of live weight (LW) of the ewes (n = 51)

SF, subcutaneous fat; ImF, intermuscular fat; CF, carcass fat; OmF, omental fat; MesF, mesenteric fat; ThoF, thoracic fat; KKCF, kidney knob and channel fat; IntF, internal fat; BF, body fat; SFSkin11 and SFSkin13, SF depth with skin at the level of the 11th and 13th thoracic vertebrae, respectively; SFSkin1, SFSkin3 and SFSkin5, SF depth with skin at the level of the 1st, 3rd and 5th lumbar vertebrae, respectively; MA5, area of the longissimus thoracis et lumborum muscle at the level of the 5th lumbar vertebra; TDst, soft tissue depth over the sternum; SFd9 and SFd13, SF depth at the level of the 9th and 13th thoracic vertebrae, respectively; TDrib, soft tissue depth at the thoracic wall between the 10th and 11th ribs; MD9 and MD11, depth of the longissimus thoracis et lumborum muscle at the level of the 9th and 11th thoracic vertebrae, respectively; MD1 and MD5, depth of the longissimus thoracis et lumborum muscle at the level of the 1st and 5th lumbar vertebrae, respectively; MX3 and MX5, major axis of the longissimus thoracis et lumborum muscle at the level of the 3rd and 5th lumbar vertebrae, respectively.
All the models for the prediction of adipose depots were significant (P < 0.001), except for ThoF expressed as content per kg of LW (P = 0.081), and all the models included at least one RTU measurement as an independent variable (Table 4). This shows the relevance of RTU measurements for the prediction of adipose depots, both in terms of absolute weight and as content per kg of LW. Most models included RTU measurements taken in different regions, with a larger contribution of lumbar measurements, while the measurements over the sternum (TDst) and at the thoracic wall (TDrib) showed to be less useful, but still useful to predict CF (both as a whole or separated into SF and ImF), in the case of TDst, and OmF, in the case of TDrib. The models for CF and IntF showed high accuracy, with advantage for the former (respectively k-fold-R 2 = 0.938 and 0.868, for absolute weight, and k-fold-R 2 = 0.904 and 0.718, for content per kg of LW). As could be expected from the correlation analysis, the highest accuracies of the models for the prediction of each adipose depot were obtained when the dependent variable was expressed in terms of absolute weight. This was particularly evident for IntF but also, in a lesser degree, for ImF. The models for MesF were the only ones that did not include any measurement of fat depth, including instead several measurements of the depth and one measurement of the major axis of the longissimus thoracis et lumborum muscle (MX3 – major axis of the longissimus thoracis et lumborum muscle at the level of the 3rd lumbar vertebra). Despite these promising results, it must be recognized that models based on RTU measurements taken at eight different locations of the body are not very practical. So, Table 5 presents the best models developed from LW and RTU measurements taken just at the level of the 11th thoracic vertebra, which, considering the different adipose depots, was the location that, overall, provided the most useful measurements. As can be noted, the models using RTU measurements taken just at the level of the 11th thoracic vertebra provided more accurate estimates of adipose depot weights than that of adipose depot content per kg of LW. It is the same pattern already observed with the models developed using RTU measurements taken at all the locations tested (Table 4). However, there was a significant reduction in accuracy, of between 1.3% for BF and 21.4% for MesF, for the estimates of adipose content per kg of LW, in comparison with the estimates for adipose tissue weights. Nevertheless, excluding ThoF weight estimates, which always showed low accuracy (Tables 4 and 5), MesF weight was the only trait for which the best model developed from RTU measurements taken just at the level of the 11th thoracic vertebra showed moderate accuracy (k-fold-R 2 = 0.579; P < 0.001; Table 5), while the best model developed from RTU measurements taken at all the locations tested showed high accuracy (k-fold-R 2 = 0.737; P < 0.001; Table 4). For all the other adipose depot weights, the best models showed high accuracy, regardless of having been developed using RTU measurements taken at all the locations tested (0.842 ⩽ k-fold-R 2 ⩽ 0.938; P < 0.001; Table 4) or taken just at the level of the 11th thoracic vertebra (0.774 ⩽ k-fold-R 2 ⩽ 0.920; P < 0.001; Table 5).
Table 5. Equations (mean values ± s.e.) and corresponding coefficient of determination k-fold (k-fold-R 2), root mean square error of the cross-validation (RSDcv) and ratio of prediction to deviation (RPD), for the prediction of adipose depots weight and adipose depots content per kg of live weight (LW) of the ewes (n = 51), based only on the RTU measurements taken at the level of the 11th vertebra
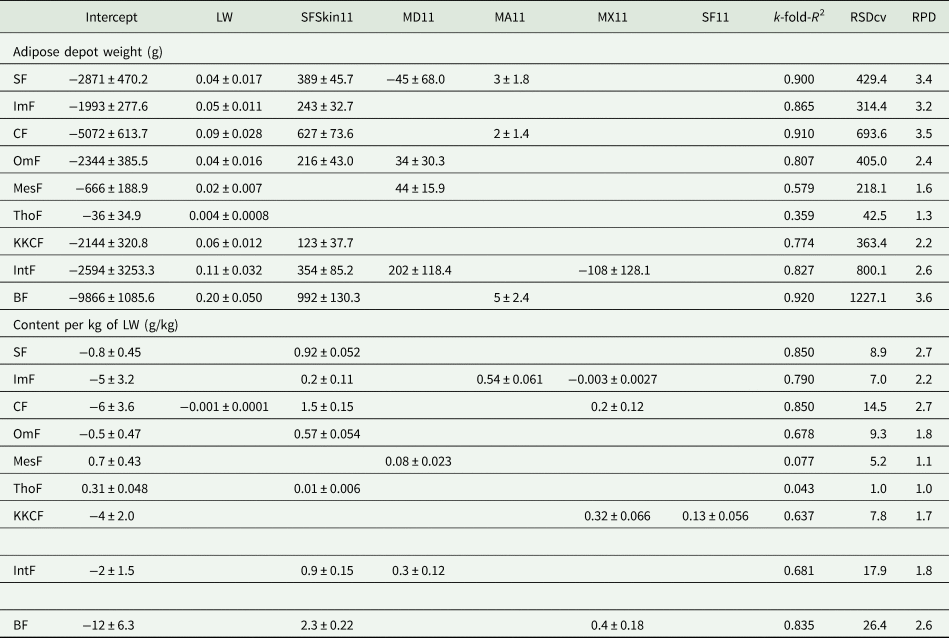
SF, subcutaneous fat; ImF, intermuscular fat; CF, carcass fat; OmF, omental fat; MesF, mesenteric fat; ThoF, thoracic fat; KKCF, kidney knob and channel fat; IntF, internal fat; BF, body fat; SFSkin11, SF depth with skin at the level of the 11th thoracic vertebra; MD11, depth of the longissimus thoracis et lumborum muscle at the level of the 11th thoracic vertebra; MA11, area of the longissimus thoracis et lumborum muscle at the level of the 11th lumbar vertebra; MX11, major axis of the longissimus thoracis et lumborum muscle at the level of the 11th lumbar vertebra.
Discussion
Live weight is an easy trait to obtain and, therefore, it is generally accepted as a useful predictor of body composition in general and BF in particular. The present study confirms the usefulness of LW as a predictor of the weight of all adipose depots already noted, for instance, by Mendizabal et al. (Reference Mendizabal, Delfa, Arana, Eguinoa, González, Treacher and Purroy2003) for Aragonesa ewes. In fact, the correlations of SF, ImF, OmF and KKCF with LW, obtained by Mendizabal et al. (Reference Mendizabal, Delfa, Arana, Eguinoa, González, Treacher and Purroy2003), were very close to the corresponding values in the current work. The inclusion of TDst in the models for SF and ImF is also in agreement with the results of Mendizabal et al. (Reference Mendizabal, Delfa, Arana, Eguinoa, González, Treacher and Purroy2003), showing that fat thickness over the sternum provides much more accurate estimates for carcass adipose depots than for IntF. However, the present results show SF depths (with or without skin) as much better predictors than TDst for all adipose depots, with TDst being included only in the models for SF and ImF, while Mendizabal et al. (Reference Mendizabal, Delfa, Arana, Eguinoa, González, Treacher and Purroy2003) showed fat thickness over the sternum as a better predictor than SFd1 for all adipose depots. Working with Pelibuey ewes, Chay-Canul et al. (Reference Chay-Canul, Garcia-Herrera, Meza-Villalvazo, Gomez-Vazquez, Cruz-Hernandez, Magaña-Monforte and Ku-Vera2016) showed non-significant correlations of SFd over the longissimus thoracis et lumborum muscle measured at two locations (between the 12th and 13th thoracic vertebrae and between the 3rd and 4th lumbar vertebrae) with CF (0.392 ⩽ r ⩽ 0.394; P > 0.05) and moderate correlations of SFd with internal fat (0.584 ⩽ r ⩽ 0.727; P < 0.05). Chay-Canul et al. (Reference Chay-Canul, Garcia-Herrera, Meza-Villalvazo, Gomez-Vazquez, Cruz-Hernandez, Magaña-Monforte and Ku-Vera2016) concluded that the use of SFd at those two locations to predict BF reserves produced poor results and related such poor results to the relatively thin SF cover of the Pelibuey ewes. Delfa et al. (Reference Delfa, Teixeira, Cadavez, Gonzalez, Sierra, Gruner and Chabert2000) and Teixeira et al. (Reference Teixeira, Joy and Delfa2008) had already pointed out that, for goats, RTU fat depth measurements taken at the level of the 3rd and 4th sternebrae were the most suitable RTU measurements to assess BF composition, given that goats show lower fat deposition in the lumbar region and a considerably thicker amount of SF in the sternal region. Although Delfa et al. (Reference Delfa, Teixeira, Cadavez, Gonzalez, Sierra, Gruner and Chabert2000) and Teixeira et al. (Reference Teixeira, Joy and Delfa2008) worked with goats rather than ewes, their results support the idea presented by Chay-Canul et al. (Reference Chay-Canul, Garcia-Herrera, Meza-Villalvazo, Gomez-Vazquez, Cruz-Hernandez, Magaña-Monforte and Ku-Vera2016) that, depending on the differences in fat partitioning and/or distribution between different sheep breeds, the RTU measurements included in the prediction models of BF composition may be different for different breeds. Less clear is the reason for the difference between the results of the present study and those of Mendizabal et al. (Reference Mendizabal, Delfa, Arana, Eguinoa, González, Treacher and Purroy2003), concerning the relative importance of TDst and SFd1 as the predictors of the different adipose depots. In fact, there was no significant difference in the mean value of SFd1 in the two studies and, despite a trend for a smaller TDst in the present study, the difference observed did not reach a significant level. Gomes et al. (Reference Gomes, Constantino, Fernandes, Koritiaki, Niwa, Marconato, Castro and Ribeiro2012) showed moderate correlations of SFd over the longissimus thoracis et lumborum muscle, measured 24 h postmortem at the 12th–13th rib region, with OmF and total visceral fat (r = 0.43; P < 0.01), and non-significant correlations of the same SFd measurement with pelvic and heart fat, and MesF, working with crossbred sheep (Texel-cross or Santa Ines-cross). The results of Gomes et al. (Reference Gomes, Constantino, Fernandes, Koritiaki, Niwa, Marconato, Castro and Ribeiro2012) are not in line with the present results and those of Mendizabal et al. (Reference Mendizabal, Delfa, Arana, Eguinoa, González, Treacher and Purroy2003). However, it must be pointed out that most of the animals used by Gomes et al. (Reference Gomes, Constantino, Fernandes, Koritiaki, Niwa, Marconato, Castro and Ribeiro2012) were lambs and this could justify the lower correlations obtained by those authors since, as already shown by Wood et al. (Reference Wood, MacFie, Pomeroy and Twinn1980), different adipose depots present different growth rates. Consequently, regardless of any breed differences, the low to moderate correlations between SFd and the different IntF obtained by Gomes et al. (Reference Gomes, Constantino, Fernandes, Koritiaki, Niwa, Marconato, Castro and Ribeiro2012) are not in conflict with the present results and those of Mendizabal et al. (Reference Mendizabal, Delfa, Arana, Eguinoa, González, Treacher and Purroy2003) for mature animals.
According to Viscarra Rossel et al. (Reference Viscarra Rossel, McGlynn and McBratney2006), RPD values >2.5 indicate excellent prediction models, RPD values between 2.0 and 2.5 indicate very good prediction models and RPD values between 1.8 and 2.0 indicate good prediction models still allowing quantitative predictions. Also according to the same authors, RPD values between 1.4 and 1.8 indicate fair prediction models that can still be used for assessment, but RPD values between 1.0 and 1.4 indicate poor prediction models. Therefore, the best prediction models obtained in the present study for adipose depot weights were very good or excellent (2.4 ⩽ RPD ⩽ 3.8) for all adipose depots except MesF (RPD = 1.8) and ThoF (RPD = 1.3), and even the model for MesF can provide useful information. The smaller RPD values of the models for MesF and ThoF can be related to the small mean weight and s.d. of these adipose depots, when compared with the other adipose depots. This became more evident when the different adipose depots were estimated in terms of content per kg of LW, thereby removing a large amount of the variation due to differences in LW, which resulted in poor RPD values of the models for MesF and ThoF. Nevertheless, the best prediction models for adipose depots expressed as content per kg of LW can be classified as very good or excellent for SF, ImF, CF and BF (2.6 ⩽ RPD ⩽ 3.2), while the best prediction models for OmF, KKCF and IntF can provide useful information. This pattern did not change when considering only models developed from LW and RTU measurements taken just at the level of the 11th thoracic vertebra – despite some loss in the accuracy of the estimates, the best prediction models for adipose depot weights were very good or excellent (2.2 ⩽ RPD ⩽ 3.6) for all adipose depots except MesF (RPD = 1.6) and ThoF (RPD = 1.3); and even the model for MesF can provide useful information. The best prediction models for adipose depots expressed as content per kg of LW were also very good or excellent for SF, ImF, CF and BF (2.2 ⩽ RPD ⩽ 2.7), while the best prediction models for OmF, KKCF and IntF can still provide useful information.
Most studies concerned with the problem of meeting energy requirements of the animals, either during periods of low food availability or during periods of high energy needs (particularly at the end of gestation and early lactation), have tried to develop the methods of estimating total fat and/or energy reserves of the body. With that goal, Silva et al. (Reference Silva, Afonso, Guedes, Gomes, Santos, Azevedo and Dias-da-Silva2016) already showed very promising results using RTU-based models, namely for animals of the same type as those used in the present study, but that approach overlooks the question of the relatively larger reserves of internal adipose tissue in dairy breeds compared to meat breeds. Mendizabal et al. (Reference Mendizabal, Delfa, Arana, Eguinoa and Purroy2007) showed that SF of adult Spanish Blanca Celtibérica goats was the depot most specialized in storing and mobilizing fat, followed by the omental depot, the perirenal depot and, finally, the mesenteric and intermuscular depots, which is consistent with the idea that the latter have a more structural function (Vernon, Reference Vernon1980). However, Gibb et al. (Reference Gibb, Ivings, Dhanoa and Sutton1992) showed that in cattle not only a dairy breed stores relatively more fat in internal depots than in SF (Wright and Russel, Reference Wright and Russel1984), but also mobilize a larger proportion of fat from the internal depots, when compared to total BF mobilization, during the first 8 weeks postpartum. The present study shows the potential of in vivo RTU thoracic and lumbar measurements to monitor changes in internal fat and CF ewe reserves, which can provide data that can be used to improve herd management by matching physiological stages of highest energy demands with periods of high food availability. In addition, in cull ewes, the monitoring of adipose depots by in vivo RTU can enhance feeding strategies to improve the marketability of the carcasses. However, more studies are necessary to develop prediction models adapted to each breed type and verify the influence on the predictive value of such models of factors that, within each breed, affect milk production, such as parity (Casoli et al., Reference Casoli, Duranti, Morbidini, Panella and Vizioli1989; Kasap et al., Reference Kasap, Špehar, Držaić, Mulc, Barać, Antunović and Mioč2019), in order to obtain a better understanding of the effect of breed differences on such models and maximize their predictive value for each breed.
Financial support
This research received no specific grant from any funding agency, commercial or not-for-profit sectors.
Conflict of interest
The authors declare there are no conflicts of interest.
Ethical standards
The authors declare that the care and handling of the ewes used in the present study followed the guidelines of the European Council Directive 86/609/ECC for the protection of animals used for experimental and other scientific purposes.


