


INTRODUCTION
The time of weed emergence is an important consideration for successful weed management. Because competition for above and below ground resources can affect the growth and development of weeds, individuals that emerge during the early crop growth stages have the ability to compete well with crops (Gibson et al. Reference Gibson, Fischer, Foin and Hill2002). However, the degree of such interaction might vary considerably across species and environments (Clay et al. Reference Clay, Kleinjan, Clay, Forcella and Batchelor2005). A greater understanding of specific weed–crop interaction as a function of the time of weed emergence will aid the formulation of effective weed management strategies. Several attempts have been made to document the time of emergence for many agriculturally important weed species (Blackshaw et al. Reference Blackshaw, Stoble and Sturko1981; Ciuberkis et al. Reference Ciuberkis, Bernotas, Raudonius and Felix2007). Traditionally, these studies have aimed at quantifying the effect of weed emergence timing on the growth and yield of crops, and consequently, management attempts were typically focused on reducing crop yield loss, while little emphasis was given to limiting weed seed production.
Seed production is an important determinant of long-term weed population dynamics (Davis et al. Reference Davis, Dixon and Liebman2003), and weed management programmes that do not aim beyond a single growing season will probably be ineffective (Gallandt Reference Gallandt2006). In addition, the increased spread of herbicide resistance in weed populations warrants a strict focus on limiting weed seed production and seedbank size. Resistance-management programmes are likely to fail if seedbank renewal of resistant individuals is not completely arrested. Managing herbicide-resistant weeds has become one of the top challenges to weed management programmes in the USA, and this is forcing weed scientists to revisit current weed management approaches. In this respect, an understanding of weed biology is critical for devising effective weed management strategies (Van Acker Reference Van Acker2009; Gressel Reference Gressel2011). Most farmers will benefit from a greater understanding of the seed production ecology of specific weed species.
Barnyardgrass (Echinochloa crus-galli (L.) Beauv.) is a serious weed in major cropping systems in the southern USA, including rice and cotton. Because barnyardgrass is a C4 weed, it is capable of competing well with C3 crop plants; it will compete even better under conditions of higher temperatures and limited water availability, scenarios projected to be caused by climate change (Rodenburg et al. Reference Rodenburg, Meinke and Johnson2011). It is noteworthy that barnyardgrass infestation can cause yield reductions ranging from 30 to 100% in rice (Johnson et al. Reference Johnson, Dingkuhn, Jones and Mahamane1998) and from 21 to 97% in cotton (Keeley & Thullen Reference Keeley and Thullen1991). Moreover, in the USA, barnyardgrass has evolved resistance to several herbicide families (Heap Reference Heap2011). The effectiveness of barnyardgrass management programmes rely on the knowledge of its dynamics, including its reproductive potential as affected by the time of emergence relative to crops. Such knowledge will be useful for manipulating crop competition as a valuable tool in integrated weed management programmes (Gibson et al. Reference Gibson, Fischer, Foin and Hill2002).
According to Mitich (Reference Mitich1990), barnyardgrass can produce up to 1 million seeds/plant under ideal growing conditions, but seed production can be highly plastic depending on local growing conditions, nutrient availability and day length (Maun & Barrett Reference Maun and Barrett1986). Moreover, the fecundity of barnyardgrass can be severely affected by competition from the associated crop (Lindquist & Kropff Reference Lindquist and Kropff1996; Gibson et al. Reference Gibson, Fischer, Foin and Hill2003); the extent of competition depends on the time of weed emergence relative to the crop (Cowan et al. Reference Cowan, Weaver and Swanton1998) and on the crop type (Clay et al. Reference Clay, Kleinjan, Clay, Forcella and Batchelor2005). In Ontario, Canada, Bosnic & Swanton (Reference Bosnic and Swanton1997) investigated the seed production of barnyardgrass in maize and reported that at a density of 10 plants/m2, barnyardgrass produced up to 34 600 seeds/m2 when it emerged by the 3-leaf stage of maize, whereas only 2800 seeds/m2 were produced when it emerged after the 4-leaf stage. In Greece, at a similar density (5–10 barnyardgrass plants/m of maize row), barnyardgrass produced up to 1300 seeds/plant when it emerged with the crop and c. 170 seeds/plant when emergence was delayed till the 6-leaf stage of maize (Travlos et al. Reference Travlos, Economou and Kanatas2011). Likewise, in South Dakota, USA, barnyardgrass (density: 1·3 plants/m2) seed production in maize ranged from 3385 seeds/plant (planted prior to maize emergence) to 158 seeds/plant (planted at the 2-leaf stage of maize) (Clay et al. Reference Clay, Kleinjan, Clay, Forcella and Batchelor2005). In rice, barnyardgrass seed production ranged from 2800 seeds/plant when it emerged with the crop to c. 100 seeds/plant when it emerged 45 days after rice emergence (Chauhan & Johnson Reference Chauhan and Johnson2010). In soybean, however, Clay et al. (Reference Clay, Kleinjan, Clay, Forcella and Batchelor2005) reported that barnyardgrass failed to produce any mature seeds.
These evidences suggests that barnyardgrass seed production is highly variable across crops and environments, yet no such investigations have been carried out in the Midsouth of the USA, where barnyardgrass is an important weed. The objective of the present study was to establish the relationships between barnyardgrass time of emergence and reproductive potential in rice and cotton, two of the most economically important crops in Arkansas, USA.
MATERIALS AND METHODS
Experimental set-up and data collection
Field experiments were conducted in the summer of 2008 and 2009 at Rohwer (33°49′N, 91°16′W) and Fayetteville (36°06′N, 94°10′W), Arkansas, USA, to determine the impact of relative time of emergence on the reproduction of barnyardgrass in rice (Rohwer) and cotton (Fayetteville). The soil types of Rohwer and Fayetteville were a Sharkey clay and Taloka silt loam, respectively (NRCS 2010). Rainfall data (Fig. 1) were obtained from the permanent weather units installed in respective experimental stations.

Fig. 1. Daily precipitation in Rohwer (rice) and Fayetteville (cotton) in 2008 and 2009.
The timing of important agronomic and experimental activities for rice and cotton are given in Tables 1 and 2. Cotton (variety: Stoneville 4554 B2RF) was seeded in rows 1 m wide at a seeding rate of 150 seeds/m of row. Rice (variety: Wells) was also seeded in rows with row spacing of 190 mm and c. 80 seeds/m of row. In Arkansas rice production, emergence of barnyardgrass ceases when fields are flooded at about 6 weeks after crop emergence (WAE), while emergence of barnyardgrass could be observed up to 7 WAE in cotton (J. K. Norsworthy, unpublished results). To represent this, barnyardgrass cohorts were established at weekly intervals from 0 to 5 WAE in rice and from 0 to 7 WAE in cotton. At 0 WAE, barnyardgrass was planted such that it would emerge in synchrony with the crop as much as possible. After planting, barnyardgrass seeds were watered immediately to ensure timely emergence. Standard production practices for the southern USA were used for rice (Slaton Reference Slaton2001) and cotton (UGA 2008). Cotton was irrigated as required using an overhead-sprinkler irrigation system. Rice was initially grown as an upland crop with irrigation as necessary and the fields were permanently flooded from about 6 WAE until maturity.
Table 1. Timing of important agronomic and experimental activities for rice
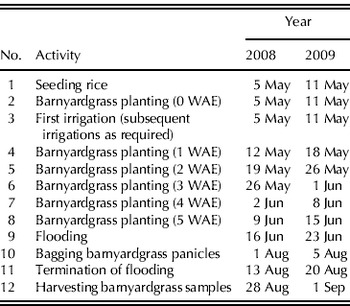
WAE: weeks after crop emergence.
The current study was conducted in a randomized complete block design (RCBD) with four replications. The treatments (i.e. time of emergence of barnyardgrass) were randomly assigned to each plot (1 m2 area) and each replication consisted of seven plots in cotton and five plots in rice (one treatment per plot). The barnyardgrass seeds used in the present study came from a naturally occurring barnyardgrass population in Stuttgart, AR, USA. The seeds were collected in autumn 2007 and stored in a cold room at 4 °C until used in the experiment. In each plot, two barnyardgrass plants were established in such a way that intra-specific competition was negligible. Ten barnyardgrass seeds per hill (two hills in total) were manually planted at c. 50 mm from the crop row in cotton and c. 100 mm from the row in rice. Over half the seeds germinated and the emerged seedlings were thinned to two plants per hill at the two-leaf stage and then to one plant at the three-leaf stage, allowing for a single barnyardgrass to grow further at each hill. In 2009, it was not possible to establish a barnyardgrass stand at 3 WAE in rice due to waterlogging.
The plots were kept free from other weeds throughout the season by the application of glyphosate in cotton (glyphosate-resistant) and propanil/fenoxaprop in rice. Glyphosate (Roundup™) was applied at 1525 g a.i./ha at 1-leaf, 4-leaf and 8-leaf stages. In rice, propanil (Riceshot™) was applied at 4480 g a.i./ha at the 2- to 3-leaf stage and at the 4- to 5-leaf stage. Propanil (as above) was tank mixed with fenoxaprop (Ricestar™) at 90 g a.i./ha. Prior to spraying, all emerged barnyardgrass plants were covered with plastic containers. Two representative panicles per plant were randomly selected prior to seed maturation and covered with mesh bags to capture the shattering seeds. At maturity, the seed heads were clipped and the seeds from each panicle were removed and counted. The total number of panicles and seeds/plant were calculated for each sampled plant from each plot. The experimental set-up in 2009 was the same as in 2008.
Data analysis
Data were analysed using the Statistical Analysis Software (SAS) version 9.1 (SAS Institute, 2003). Regression models are appropriate for establishing the relationship between predicted and predictor variable(s) obtained from time series experiments; therefore, data on the number of panicles/plant and seed production/plant were regressed against the time of emergence of barnyardgrass in cotton and rice. The NLIN procedure of SAS was used in this regard. The regression model that provided the best fit to the data was chosen for each crop (i.e. cotton and rice), because the aim was to understand the response of barnyardgrass when emerging under each of these crops and environments, not to establish an overall relationship across the crops/environments.
In non-linear models, a measure closely corresponding to the coefficient of determination (known as pseudo-R 2) is used for expressing the quality of fit (Chism et al. Reference Chism, Birch and Bingham1992). Therefore, the best model fit was identified based on the pseudo-R 2 value that was calculated using Eqn (1) (Schabenberger et al. Reference Schabenberger, Tharp, Kellis and Penner1999). Means were plotted for each emergence time for each year and crop.
 $$\eqalign{ &{\rm Pseudo {\hbox-}} R^{\rm 2} =\cr &\quad1 - \left( {\displaystyle{{{\rm Residual \ sum \ of \ square}} \over {{\rm Total \ sum \ of \ square \ [corrected]}}}} \right)}$$
The reproductive variables of barnyardgrass (number of panicles and seeds/plant) relative to the time of emergence in rice were non-linearly regressed using a logarithmic function (Eqn 2).
 $$y = y^{\rm o} + a\ln (x)$$
where y is the predicted variable (number of panicles or seeds/plant), y o is the initial value that is equal to the value of y when the weed emerges with the crop, a is the regression coefficient and x is the time of weed emergence, presented as WAE.
In cotton, the reproductive attributes of barnyardgrass (number of panicles and seeds/plant) relative to the time of emergence was regressed using an exponential function (Eqn 3).
 $$y = a{\rm e}^{ - bx} $$
where y is the predicted variable (number of panicles or seeds/plant), a represents the reproductive potential of barnyardgrass when it emerges with the crop, e is the exponent, b is a fitted constant and x is the time of weed emergence (WAE).
In each crop, the differences in panicles/plant and seed production/plant between the 2 years of study were examined using a sum of square reduction test (two-curve comparison) (Schabenberger et al. Reference Schabenberger, Tharp, Kellis and Penner1999). To do this, full and reduced models were fitted wherein the reduced model was a constrained version of the full model. The test statistic F obs was calculated as given in Eqn (4).
 $$F_{{\rm obs}} {\rm =} {\displaystyle{{{\rm SS(Residual)}_{{\rm Reduced}} - {\rm SS(Residual)}_{{\rm Full }}{\rm /}}\atop{ {\rm DF(Residual)}_{{\rm Reduced}} - {\rm DF(Residual)}_{{\rm Full}}} }\over {{\rm MS(Residual)}_{{\rm Full}}}} $$
where SS is the sum of squares, DF is degrees of freedom and MS is the mean square. The calculated F obs was compared with the cut-offs from an F distribution considering DF (Residual)Reduced − DF (Residual)Full as numerator and DF (Residual)Full as denominator DF. The analysis showed significant year effects (P ⩽ 0·05) on the reproduction of barnyardgrass; therefore, data were analysed and presented separately for each year. However, statistical comparisons of barnyardgrass reproduction were not made between the two crops due to location differences (cotton was grown in Fayetteville and rice in Rohwer).
RESULTS
The reproductive attributes (number of panicles/plant and number of seeds/plant) of barnyardgrass generally declined for each delay in emergence relative to the crop, but some seed production was still observed when barnyardgrass emerged several weeks after cotton or rice. For each year and crop, barnyardgrass panicle and seed production followed a similar trend except for cotton in 2009, where greater panicle production was not reflected in seed production (Fig. 2). Panicle and seed production, however, differed between the two study years (Figs 2 and 3). In particular, the seed production of barnyardgrass was lower in 2009 compared with 2008, with 54% reduction in cotton and 92% reduction in rice at 0 WAE.

Fig. 2. Regression curve for barnyardgrass panicle and seed production at different times of emergence in cotton in 2008 and 2009. The data conformed to an exponential relationship (y=a e−bx ), where a is the initial value that starts the exponential function and b is the fitted constant. The quality of the model fit was expressed using the pseudo-R 2 value.

Fig. 3. Regression curve for barnyardgrass panicle and seed production at different times of emergence in rice in 2008 and 2009. The data conformed to a logarithmic relationship (y=y o+a ln(x)), where y o is the initial value that corresponds to the value of y when the weed emerges with the crop and a is the regression coefficient. The quality of the model fit was expressed using the pseudo-R 2 value.
Overall, seed production was observed when barnyardgrass emerged up to 5 WAE (2008) or 7 WAE (2009) in cotton and up to 5 WAE (2008 and 2009) in rice. The coefficients for reproductive attributes of barnyardgrass conformed to an exponential relationship for cotton and logarithmic relationship for rice (Figs 2 and 3). In general, seed production in barnyardgrass was greater in the seedlings that emerged with the crop (i.e. 0 WAE) compared with the later-emerging cohorts, and the decline in seed production was very prominent when the seedlings emerged after 3 WAE (Figs 2 and 3).
Barnyardgrass seed production at the last cohort was reduced by 93 and 91% (2008 and 2009, respectively) in cotton, and by 62 and 92% (2008 and 2009, respectively) in rice, compared with the seedlings that emerged at 0 WAE. In cotton, barnyardgrass produced 35 500 (in 2008) or 16 500 (in 2009) seeds/plant at 0 WAE and 2500 (in 2008) or 1500 (in 2009) seeds/plant at 5 WAE; in rice, barnyardgrass produced 39 000 (in 2008) or 2900 (in 2009) seeds/plant at 0 WAE and 14 750 or 110 seeds/plant at 5 WAE, respectively in 2008 and 2009.
DISCUSSION
The present results support previous findings that barnyardgrass seed production reduces with delayed emergence relative to the crop (Bosnic & Swanton Reference Bosnic and Swanton1997; Clay et al. Reference Clay, Kleinjan, Clay, Forcella and Batchelor2005; Chauhan & Johnson Reference Chauhan and Johnson2010; Travlos et al. Reference Travlos, Economou and Kanatas2011). Generally, the barnyardgrass seed production/per plant observed in the present study were greater than that of other similar studies, possibly because the present study had only two barnyardgrass plants in a 1 m2 area (whereas the densities were greater and variable in other studies), leading to greater seed output on a per plant basis.
When emerging simultaneously with the crop, barnyardgrass would be expected to experience less competition for resources compared with cohorts that emerged later, allowing for more successful growth and reproduction. Conversely, when emerging after the crop was already established, barnyardgrass seedlings would be expected to experience greater competition from the crop. Previous studies have indicated that competition for light, nutrients and moisture, as well as day length, are the major factors that typically affect the seed production of later-emerging weed seedlings (Maun & Barrett Reference Maun and Barrett1986; Lindquist & Kropff Reference Lindquist and Kropff1996; Gibson et al. Reference Gibson, Foin and Hill1999, Reference Gibson, Fischer, Foin and Hill2002; Gibson & Fischer Reference Gibson and Fischer2001; Clay et al. Reference Clay, Kleinjan, Clay, Forcella and Batchelor2005).
Shading by the crop canopy is an important mechanism of interference between crops and weeds. Jha & Norsworthy (Reference Jha and Norsworthy2009) have shown that crop canopy formation typically reduces the amount and quality of light filtering through the canopy, and the growth and reproduction of shaded plants are severely affected through phytochrome-mediated processes (Ballare et al. Reference Ballare, Scopel and Sanchez1990). Moreover, it appears that the effect of shading is more severe on seedlings that emerge later than it is on cohorts that emerge early. For instance, Gibson et al. (Reference Gibson, Foin and Hill1999) demonstrated that when it emerged with rice, Echinochloa compensated for shading via plasticity in leaf morphology and biomass partitioning. As a result, competition for nutrients was also required to affect growth and reproduction in early emerging cohorts.
For later cohorts, however, competition both above and below ground would have been severe. Assemat et al. (Reference Assemat, Morishima and Oka1981) and Perera et al. (Reference Perera, Ayres and Gunasena1992) showed that root competition plays an important role in interference between rice and barnyardgrass. As a result, early establishment confers a competitive advantage to the crop over the weeds. The effect of day length would have been minimal in the present study because barnyardgrass cohorts were established before July, allowing them to produce sufficient vegetative growth prior to the onset of short-day conditions in early autumn, which triggers flowering in this species (Maun & Barrett Reference Maun and Barrett1986). However, a non-competition control, which was not included in the present experiment, would have been helpful to explain the effects of crop competition and day length on barnyardgrass seed production.
The relationships between time of emergence and seed production of barnyardgrass have been described using separate models for cotton and rice based on the quality of model fit. Cotton and rice were grown in two different locations with different environmental conditions; therefore, it was difficult to separate the effect of crop type alone on barnyardgrass seed production. The differences observed between these two systems could have been due to a combined effect of crop type, soil type, management (particularly planting density and row spacing) and local growing conditions. Studies have indicated that competitive interactions are greater within dicots or monocots rather than between them (Toler et al. Reference Toler, Guice and Murdock1996; Cowan et al. Reference Cowan, Weaver and Swanton1998). Nevertheless, crop types that can exhibit a rapid canopy formation may confer a competitive advantage over the weeds.
The significant reduction in barnyardgrass seed production in 2009 compared with 2008 could have been due to the changes in the extent of inter-specific competition as influenced by environmental conditions. However, it is not clear what combination of environmental factors/crop × environment interactions caused the variability between the years, and the study was not intended to capture this. In Reference Travlos, Economou and Kanatas2009, high levels of early-season precipitation (in May; Fig. 1) slowed the establishment of cotton, the growth of which is known to be severely affected by prolonged wet conditions (Bange et al. Reference Bange, Milroy and Thongbai2004). Barnyardgrass, on the other hand, grows well under wet conditions (Rahn et al. Reference Rahn, Sweet, Vengris and Dunn1968) compared with cotton, which led to more tillers and thereby more panicles/plant, but seed production/panicle was reduced as cotton growth recovered soon after.
In rice, a different situation occurred in 2009. Intensive early-season precipitation (Fig. 1) and a near-submerged condition (intermittently) favoured the early growth of rice. Although barnyardgrass continued to grow under submerged conditions, the plants grew upright with low seed production, and the results concur with Rahn et al. (Reference Rahn, Sweet, Vengris and Dunn1968). In 2008, the rice fields were submerged only following the establishment of flood at 6 WAE, which may explain the greater seed production in the early emerging cohorts in 2008 compared with 2009. A non-competition control would have been helpful to explain the causes for these differences, yet the results suggest that creating a submerged condition during the early growth stages of rice may be a useful strategy for combating barnyardgrass.
The present study provides important data on the reproductive ecology of barnyardgrass. However, the effects were highly variable over the years and environments, leading to a range of parameter values. This is not surprising because barnyardgrass seed production has been shown to be highly variable across environments (Holm et al. Reference Holm, Plucknett, Pancho and Herberger1977; Maun & Barrett Reference Maun and Barrett1986; Norris Reference Norris1992; Clay et al. Reference Clay, Kleinjan, Clay, Forcella and Batchelor2005), and the present study was not designed for or aimed at exploring the causes for such variation. Nevertheless, it provided an opportunity to understand the extent of environmental stochasticity associated with barnyardgrass seed production, which is highly valuable in parameterizing the population dynamic models for barnyardgrass. System- or environment-specific data may be vital if such models are sensitive to this parameter. Given the variability observed in barnyardgrass seed production within a confined geographical region, future studies aiming at predicting seed production as a function of crop × environmental interactions will be useful.
The present study also provides valuable information that can be used to devise effective weed management practices. Barnyardgrass seedlings that emerge within a month of crop emergence contribute most to the seed rain and enriching the seedbank. Therefore, greater emphasis is warranted on early season weed control. The results are in accordance with those of Cowan et al. (Reference Cowan, Weaver and Swanton1998), Clay et al. (Reference Clay, Kleinjan, Clay, Forcella and Batchelor2005) and Travlos et al. (Reference Travlos, Economou and Kanatas2011). Nevertheless, in the context of herbicide resistance management, preventing seed production and seedbank renewal of the resistant individuals is the key, irrespective of their time of emergence. The results also suggest that substantial weed control can be attained simply by delaying the timing of weed emergence relative to the crop and/or by making the crop more competitive. There are opportunities for breeding crop cultivars with desirable agronomic traits, perhaps by exploiting the existing intra-cultivar variation (Tokatlidis et al. Reference Tokatlidis, Tsikrikoni, Lithourgidis, Tsialtas and Tzantramas2011). Additionally, production practices including but not limited to deep tillage, flooding (for rice), and altering planting date, row spacing and planting density can be utilized to improve crop competitiveness over weeds.
Table 2. Timing of important agronomic and experimental activities for cotton

WAE: weeks after crop emergence.
The authors are grateful to Bayer CropScience, Dow AgroSciences, Syngenta, Monsanto, Valent U.S.A. and BASF for the financial support to collect biological data and model the evolution of herbicide resistance in barnyardgrass.


