


INTRODUCTION
The nitrogen (N) balance of intensively managed dairy pasture is usually highly positive (Haynes & Williams Reference Haynes and Williams1993; Saarijärvi et al. Reference Saarijärvi, Virkajärvi, Heinonen-Tanski and Taipalinen2004, Reference Saarijärvi, Virkajärvi and Heinonen-Tanski2007). More than 80 kg N/year can be immobilized to soil organic matter during the first 10 years after sward renewal (Tyson et al. Reference Tyson, Scholefield, Jarvis and Stone1997). However, the capacity of the soil to store the excess N is limited and, when it is exceeded, emissions to the environment will occur.
Dung and urine patches are ‘hot spots’ of intensive N cycling on pastures and the main sources of N losses (Haynes & Williams Reference Haynes and Williams1993). As N is excreted both in organic and mineral form and, furthermore, in a number of different physical forms of variable solubilities, it is a difficult nutrient to control. The dynamics of N in pasture soil after deposition have been extensively studied in temperate climates (e.g. Deenen & Middlekoop Reference Deenen and Middelkoop1992; Haynes & Williams Reference Haynes and Williams1993; Wachendorf et al. Reference Wachendorf, Taube and Wachendorf2005, Reference Wachendorf, Lampe, Taube and Dittert2008), but the N dynamics of excreta are not clear in areas where the soil is seasonally frozen (Ryan et al. Reference Ryan, Kachanoski and Gillham2000).
The hydrolysis of urea followed by nitrification and denitrification in urine patches occur over a short period of time, usually within a few weeks. Approximately 0·15–0·20 of the N from urine is taken up by the sward. In dung pats, the decomposition and mineralization may last up to 2 years and only 0·08–0·10 of the dung N is utilized by the vegetation during the first year after deposition. The dynamics of excretal N vary greatly depending on climatic and soil conditions (Deenen & Middlekoop Reference Deenen and Middelkoop1992; Haynes & Williams Reference Haynes and Williams1993; Wachendorf et al. Reference Wachendorf, Taube and Wachendorf2005; Reference Wachendorf, Lampe, Taube and Dittert2008).
The concentration of TN is 3·4–5·0 g/kg in dung and 4·8–13·3 g/kg in urine, depending on the dietary N contents (Petersen et al. Reference Petersen, Sommer, Aaes and Søegaard1998). As the surface area covered by a single defecation and urination is small, the local N load often exceeds 1000 kg N/ha in dung pats and 500 kg N/ha in urine patches.
The N load of dung and urine is high enough to cause damage to the leaves and roots of the grass where deposited (Shand et al. Reference Shand, Williams, Dawson, Smith and Young2002), in addition to the suffocating impact of dung on the grass underneath the pat. The grass on and around excreta patches utilizes part of the excreted N but, as the amount of N in the excreta is high, there remains a large proportion of N unavailable to plants. So far, most of the research concerning N utilization from cattle excreta has been conducted in temperate climates with rather mild winter conditions. There is a lack of knowledge from regions with severe winter conditions. Furthermore, data on the amounts and functional role of soluble organic nitrogen (SON) in grassland soils in Finland are scarce, even though in the literature SON is described as an important factor that should routinely be included in the measurements of mineral nitrogen pools in soil (Murphy et al. Reference Murphy, Macdonald, Stockdale, Goulding, Fortune, Gaunt, Poulton, Wakefield, Webster and Wilmer2000; Jones et al. Reference Jones, Shannon, Murphy and Farrar2004).
In order to understand the excreta N dynamics on boreal pastures, an experiment was conducted with artificial excreta depositions. The aims of the present study were: (1) to investigate the dynamics of N transformations in different soil layers under dung and urine patches, (2) to determine how much of the total excretal N is taken up by timothy–meadow fescue sward and how far from the excretal patch N can be utilized, (3) to clarify how long N fractions originating from excreta can be recovered in the soil and (4) to quantify the amount of SON in boreal grassland soil.
MATERIALS AND METHODS
Site description
The study site was located in Central Finland at the MTT Agrifood Research Finland, Maaninka (63°10′N, 27°18′E). The soil type according to the FAO classification (FAO 1998) was medium textured Dystric Regosol, organic matter content 0·057 g/kg, bulk density (BD) of the surface soil (0–100 mm) 1·32 g/cm3 and particle density (PD) 2·57 g/cm3. The average depth of the groundwater was 5·2–5·8 m from the soil surface.
The experimental area was a 2-year-old sward that was established in 2001 with a mixture of timothy (Phleum pratense L. cv. ‘Iki’, seed rate 12 kg/ha) and meadow fescue (Festuca pratensis Huds. cv. ‘Antti’, seed rate 10 kg/ha). The area was fertilized according to the current Finnish recommendations (Viljavuuspalvelu Oy 2000): N, P and K were applied at 224, 15 and 126 kg/ha/year, respectively, divided into three applications of which the first (88N–15P–24K) was given on 20 May, the second on 11 June (80N–0P–60K) and the third on 7 July (56N–0P–42K). The second and third applications were given evenly to the whole experimental area, including the dung and urine treatments. The study area was cut twice before the start of the experiment, representing the first two grazing rotations. The first cut (leaving 100 mm stubble) was done on 28 May and the second (leaving 70 mm stubble) immediately before application of the treatments on 9 June. The herbage mass (HM) and herbage N concentration were measured for both cuts. The effect of excreta on soil and herbage production was studied in a 1-year experiment between 9 June 2003 and 5 May 2004.
Experimental design
The experimental design was randomized complete blocks (three replicate blocks) with three treatments: control, urine and dung. A total of 10 average-sized dung and urine patches (see below) and control patches were randomized on each of the three blocks, one patch for each sampling date due to destructive sampling. The treatment spots were placed 1·5 m apart.
The average size of the single urination and defecation was measured from high-producing Holstein–Friesian milking cows. The average weight of a single defecation was 2·47 kg and urination 2·37 kg. The average surface area of a dung pat (0·075 m2) was determined by measuring the cross diameters of 15 dung pats on the pasture. The surface area of an average-sized urination (0·353 m2) was determined by placing a piece of paper on the urine spot (six replicates) and pressing it against the ground with a plate. The size of the wet area on the paper was measured.
The excreta used in the experiment were collected from grazing cows during milking 1 h before applying the excreta to the field; dung and urine were collected into separate containers, mixed, sampled and then applied to the field. Average-sized dung pats were placed in the centre of a weighed, round plastic netting (diameter 0·36 m, 1·3×1·3 mm mesh net) laid on the grass stubble on the ground. The dung was spread on the net, leaving a margin of 10 mm along the edge of the net. The urine was spread on the ground inside a collar (diameter 0·67 m) to correspond to the average surface area of a single urination. The TN concentration was 7·5 and 3·9 g/l and NH4N concentration 0·04 and 0·22 g/l in urine and dung, respectively. This equals 17·7 and 9·6 g of TN per urine and dung treatment patch, respectively.
The volumetric soil moisture was determined using a Theta Probe (type ML2, Delta-T-Devices, UK) during each measurement. Water infiltration into the soil (lysimeter runoff) and surface runoff were measured on a 0·7 ha lysimeter field 50 m from the experimental area. The field consisted of 12 repacked plastic sheet lysimeters established in winter of 1985/86. The upper edge of the 10×10 m lysimeters was 300 mm under the soil surface and the depth of the lysimeters was 1·8 m. Each lysimeter drained through a pipe located 1·10 m below the ground surface (for a detailed description, see Saarijärvi et al. Reference Saarijärvi, Virkajärvi, Heinonen-Tanski and Taipalinen2004). The surface runoff was measured by two surface runoff collectors measuring 400 m2 each. The amounts of leachate and surface runoff were recorded regularly three times a week and always after rain showers.
Soil sampling
The soil in the urine and control patches was sampled 0, 1, 3, 5, 10, 21, 49, 77, 120 and 330 days after the start of the experiment. The sample layers were divided based horizons determined by the FAO soil classification (FAO 1998). The sampling depths on days 0–5 were 0–20, 20–100, 100–250 and 250–450 mm in control and urine patch. From day 10 onwards a depth layer of 450–600 mm was included. In the dung patch the sampling started on day 3 with the 0–20, 20–100 and 100–250 mm layers. From day 21 onwards, depth layers 250–450 and 450–600 mm were included. Before taking the soil samples, the dung pats were removed by lifting the mesh net to allow sampling of the soil directly beneath the pat. The remaining pat on the net was weighed and analysed for dry matter (DM), C and N. The last sampling was done for all the treatments and all depths in the following spring after the frost had melted, 330 days from the beginning of the experiment.
The 0–20 and 20–100 mm samples were taken simultaneously using a square (100×100×100 mm)-shaped corer. The soil square was cut into two layers (0–20 and 20–100 mm). Four square corers were taken from each treatment patch. The rest of the depth layers (100–600 mm) were sampled with a 0·5 m round drill (diameter 20 mm) from the square hole, five samples from each treatment patch. The soil from each layer was put into separate containers and mixed thoroughly for the sample. Any above-ground vegetation, other macro-organic matter and visible stones were removed from the samples. To determine the sample DM, 100 g of field-moist soil was weighed and dried at 105°C for 24 h.
Total nitrogen (TN), total soluble nitrogen, soil mineral nitrogen (SMN) and SON analyses
TN was measured by a Leco FP 428 (Leco Corporation, St Joseph, MI, USA). Total soluble N (TSN) was determined by shaking the field-moist soil sample with 2 M KCl at a ratio of 20 g soil: 100 ml 2 M KCl for 2 h at 175 rpm. After shaking, the extracts were filtered (Schleicher and Schuell 5893) and stored at −18°C until analysed for NH4+ and NO3−. TSN was measured by oxidizing inorganic and organic N compounds into nitrate in alkaline solution under pressure and high temperature (potassium peroxisulfate, 200 kPa, 120°C, 0·5 h; Finnish standard method SFS 3031, 1990). Analysis was conducted using a Bran Luebbe AutoAnalyser. SON was calculated as the difference between TSN and SMN. If the result was negative, the proportion of SON was assumed to be negligible.
Grass sampling and analysis
Grass was cut to a height of 70 mm and HM was measured from all treatments on sampling days 21, 49 and 77, representing grazing rotations 3–5. In the autumn (day 120), just before the soil was frozen, all the above-ground vegetation was cut and HM was measured. All the grass samples were analysed for DM and N content. Around the dung pats, the grass was cut in three rings 0–50, 50–100 and 100–150 mm from the edge of the pat. On the urine spots, samples were taken from the actual urine spot (diameter 0·67 m), and from 0·67–0·82 and 0·82–0·97 m rings around it.
Statistical analysis
Soil nitrogen (TN, TSN, SMN, NH4N, NO3N and SON) concentrations and amounts were analysed separately each day by ANOVA (SAS MIXED procedure; Littell et al. Reference Littell, Milliken, Stroup and Wolfinger1996) and using depth as a repeated factor. It was revealed, however, that the residuals were not normally distributed and that transformations could not overcome this problem. Therefore, the data were analysed by ANOVA for each day and depth and treatment means and related standard errors are presented.
The sward variables were analysed first by ANOVA (SAS MIXED procedure). The response variables were calculated as difference from the control, i.e. changes in DM yield, N content of grass and N yield caused by dung and urine. This was done since there were no rings in the control treatment and, consequently, ANOVA would not have been balanced. The calculated changes were then analysed by ANOVA (SAS MIXED procedure) for each sampling date, since the observations were not repeated due to destructive sampling. The model included treatment, ring and treatment×ring interaction as fixed effects, whereas block and block×treatment were included as random effects. The P values for treatment effects were obtained from LS means test ‘treatment×ring effect=0’, P values <0·05 showing difference from the control.
RESULTS
Weather
Weather conditions, lysimeter runoff, surface runoff and soil moisture content (m3/m3, v/v) during the experiment are presented in Table 1 and Fig. 1. In the beginning of the experiment the soil was wet and during the first 24 h after the applications, there was a rainfall of 32·5 mm. The total rainfall during the growing season was 300 mm, average air temperature was 13·8°C and average soil temperature at the depth of 100 mm was 13·4°C. The water holding capacity (WHC) of the soil was assumed to be equal to the figures measured from the same experimental area by Pietola et al. (Reference Pietola, Horn and Yli-Halla2004) (θ 27–32% at −0·1 MPa). The soil remained moist throughout the experiment and the WHC was exceeded six times during the summer (10–12 June, 10–21 July, 28–31 July, 21 August, 28 August–8 September and 22 September until the soil was frozen on 21 October). During the winter the soil was frozen to a maximum depth of 270 mm. The maximum amount of water that was stored in the snow pack melted in spring 2004 was 144 mm.

Fig. 1. Precipitation (rainfall mm), depth of the snow cover (snow mm), depth of frost layer (frost mm) and daily mean temperatures (°C) for the experimental year 2003.
Table 1. Soil water balance parameters during the experiment. Each figure except soil time-domain reflectometer (TDR) moisture is the cumulated amount from the preceding date (for example 12 Jun 2003 rainfall 11 mm is accumulated between 10 June 2003 and 12 June 2003)
N utilization of grass
Prior to the experiment, the area was fertilized with 88 kg N/ha and the grass was cut twice representing two rotational grazings. The DM and N yields of these two cuts were 1720 kg/DM/ha and 62 kg N/ha, respectively. Thus, it was assumed that 26 kg of fertilizer N/ha remained in the soil when treatments were applied. This residual N was included in the balance calculations of the experiment for all the treatments.
The total yield of the control patches during the experiment was 7350 kg DM/ha and 194 kg N/ha. This included the last sampling in the autumn, when all above-ground vegetation was cut for the sample. The utilization of fertilizer N in HM including cuts 1 and 2 (the TN yield 256 kg N/ha/y) was 1·14, which means that 32 kg N/ha was mineralized from the soil organic matter.
There was a minor increase in DM yield around the dung pat 21 days after excreta application compared with the control patch (Table 2). In total, the effect of the dung pat covered an area extending to 150 mm from the edge of the pat. The inner ring (0–50 mm from the edge of the pat) produced over 14 500 kg DM/ha and 410 kg N/ha during the experiment, the middle ring (50–100 mm from the edge of the pat) produced 10 500 kg DM/ha and 300 kg N/ha and the outer ring (100–150 mm from the edge of the pat) 8600 kg DM/ha and 230 kg N/ha. As there was no vegetation penetrating through the dung pat, the DM and N yields were greatly reduced when the actual pat area was included in the calculation. On average, the dung pat area with its rings produced 8120 kg DM/ha and 220 kg N/ha. The largest amount of DM was cut at the sampling 49 days after the application of the excreta, when the growth phase of the sward had exceeded the optimal grazing state. The calculated estimate for N originating from the dung pat was 27 kg N/ha, which is equal to 0·07 of the total amount of dung N given to the dung pat area and the rings around it.
Table 2. Grass dry matter (DM) yield and nitrogen concentration (N g/kg DM) and yield (N g/m2) on and around the excretal patches on each sampling date of the experiment (s.e.=standard error of mean)

Results and P values for urine and dung are given as differences from the control treatment.
T-test P values, h0: difference between urine or dung and control=0.
The DM yield of the urine treatment did not differ from that of the control patch (Table 3). There was no statistically significant decline in DM yield from the actual urine patch area towards the outer ring. However, the N concentration of the grass was higher than in the control patch, especially in the patch area, but also in both rings. As a result of the increased N concentration of the grass, the N yields of the patch area and the inner ring around it were significantly higher than in the control patch. The calculated estimate for the N originating from the urine patch was 71 kg N/ha, which is equal to 0·19 of the total amount of urine N given to the urine patch area and the rings around it.
Table 3. Sum of grass DM and nitrogen (N) yields on and around excretal patches during the entire experiment
Weighted means of the N concentration (N g/kg DM) during the experiment. (s.e.=standard error of mean). Results and P values for urine and dung are given as differences from the control treatment.
T-test P values, h0: difference between urine or dung and control=0.
N fractions in soil
The average amount of TN in soil to a depth of 600 mm was 14 400 kg/ha (s.d. 2000 kg N/ha) and there was no difference between the treatments. The TSN in soil was highest by far in the urine treatment and clearly lower under the dung and in the control treatment (Figs 2–4). The amount of TSN in the urine-treated soil returned to the level of the control treatment on day 120. In the control treatment, i.e. in untreated soil, the SON accounted for 0·90 of the TSN detected in soil when the fertilizer effect on days 3, 5 and 10 was not included (Fig. 2). The level of SON varied from 45 to 75 kg N/ha, being typically close to 60 kg N/ha. The proportion of SMN increased only temporarily as a consequence of treatment or fertilization.

Fig. 2. Amounts (kg/ha) of soluble organic nitrogen (SON; diamond patterned area), ammonium nitrogen (NH4N; solid black area) and nitrate nitrogen (NO3N; slashed area) in the soil under the control treatment during the experiment. Horizontal bars represent standard errors of the means of total soluble nitrogen (SN) in soil to a depth of 600 mm.

Fig. 3. Amounts (kg/ha) of SON (diamond patterned area), NH4N (solid black area) and NO3N (slashed area) in the soil under the dung pats during the experiment. Horizontal bars represent standard errors of the means of total SN in soil to a depth of 600 mm.
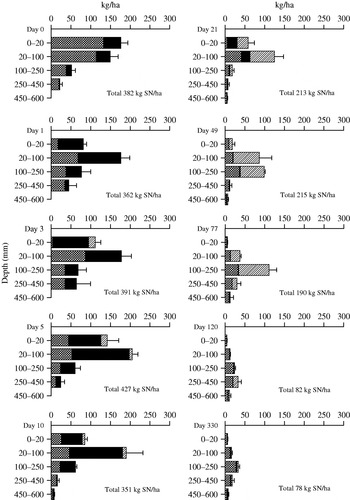
Fig. 4. Amounts (kg/ha) of SON (diamond patterned area), NH4N (solid black area) and NO3N (slashed area) in the soil under the urine patches during the experiment. Horizontal bars represent standard errors of the means of total SN in soil to a depth of 600 mm.
Over 70 kg N/ha of the given N fertilization was recovered in the top layers of the soil (0–100 mm) 2 days after fertilizer application (Fig. 2). The fertilizer effect had disappeared by day 21. The second application of fertilizer is not shown in the figures, since the soil was sampled before the application. The next sampling was done on day 49, but the effect of nitrogen had already disappeared by then. The application of N fertilizer cannot be seen under the dung pats (compare day 3 in control and dung in Figs 2 and 3), due to the actual dung pat preventing the fertilizer granules being in contact with the soil. The soluble N concentration underneath the dung pats was highest on days 21 and 49 (Fig. 3). However, the effect of dung on the TSN pool was relatively small: the dung treatment contained 92 kg/ha v. 62 kg TSN/ha in the control on day 21.
The plastic mesh was only a fragile barrier between the soil and the pat; on day 21 after application large holes could be seen in the net and several insect larvae were visible in the soil underneath the dung pats at a depth of 20–250 mm. The actual pat, however, degraded slowly as 0·52 of its original N content was still in the DM remains on the net 120 days after application. At the end of the experiment (330 days from the application), the pat had greatly mixed with the soil as its C and N contents were only half the values seen at the beginning. The C:N ratio, however, was the same (12·7) as 330 days earlier. The C:N ratio was highest (15·9) 10–21 days after application.
In the urine treatments, there were three major occasions when TSN losses occurred. The first loss took place immediately after application when 502 kg urinal N/ha was applied, but only 323 kg N/ha was recovered (Fig. 4). Between days 5 and 21, the loss was 152 kg TSN/ha. The last loss occurred between days 77 and 120, when the urine TSN pool under the urine patches decreased by 102 kg/ha.
Most of the effects of urine were seen in soil layers to a depth of 250 mm and only minor effects were detectable in lower soil layers (Fig. 4). Immediately after the urine application, the N concentrations increased in soil to a depth of 250 mm. There was a heavy rainfall between the first and second the sampling and an increase in soil N concentration to a depth of 450 mm was seen 3 days after the application. Five days after application, the high N concentration in the 250–450 mm soil layer of the urine-treated soil had almost returned to the control soil level.
DISCUSSION
Grass N utilization
The summer was warm and moist, which enhanced grass growth. In the control treatment the apparent recovery of the fertilizer N was over 1·0, which indicates net N mineralization from the soil, as there was no clover in the sward and the average atmospheric deposition was only 3 kg/ha/y (Vuorenmaa et al. Reference Vuorenmaa, Juntto and Leinonen2001). Even though the experiment started at the second grazing rotation, the N utilization was calculated for the whole growing season.
In the case of the dung treatment, DM production was significantly higher than for the control treatments during the third grazing rotation 21 days after dung application. This was a little unexpected as the dilution of N from the pat to the soil should have been quite slow (Dickinson et al. Reference Dickinson, Underhay and Ross1981). There are two possible reasons for the higher DM production around the dung pats. Either (1) the mechanical effect of the pat prevented grass growth under the pat and gave the tillers growing near the pat edge a competitive advantage for solar radiation, water and nutrients or (2) the heavy shower (33 mm) immediately after the treatment's application probably diluted some of the soluble N from the pat surface to the soil at the pat edge. However, the effect of urine N on grass DM production could not be detected at the sampling 21 days after application. This was surprising as there was an unlimited supply of N in soil. A possible explanation for the lack of response could be that the root system of the grass underneath the urine patch was damaged because of the high N concentration in soil caused by urine and thus the grass roots could not support maximal growth (Shand et al. Reference Shand, Williams, Dawson, Smith and Young2002). At the soil surface, however, there was no more dead plant material on the urine patches than in the other treatments.
In the fourth grazing rotation, 49 days after dung and urine application, the sward had exceeded the optimal grazing stage. As the DM production was high overall, the mechanical effect of the dung pat was even more pronounced and the DM yields in the two nearest rings around the pat were very high (Table 2). DM production in the urine patch was no higher than on the control plot, but the N concentration and, thus, the N yield of the herbage were significantly higher on the patch area and in the nearest ring than on the control plots. A possible reason for low DM production in the urine patch compared to the dung treatment could be that the sward had already reached maximal competition for solar radiation and water supply and this prevented further grass growth.
During the fifth and the last grazing rotation, 77 days from the beginning, the grass yields were low in all the treatments. This was due to the effect of the preceding cut, when the entire sward was in the reproductive phase. However, the positive effect of dung pat on DM yield compared to the urine treatment is again clear. There was a marked amount of NO3N in soil and this was reflected as high grass N concentration in the urine patch and in both of the rings around it, but the DM production on the urine patch area did not respond to the excellent growing conditions. The reason for this remains unclear.
In late autumn the grass growth on the control plots was thoroughly dependent on soil N mineralization, as the calculated recovery of the fertilizer N had already exceeded 1·0. In the urine treatment, there was still a high amount of excretal N left in the soil, but it did not enhance the grass growth at all. In the dung treatment, however, there was a marked increase in DM yield in the first ring around the pat compared to the control treatment. N release from the pat is slow and it is likely that there was a better, more continuous availability of N to the grass around the pat than at the control site, even though it was not reflected in soil N concentrations.
During the whole experiment, 0·07 of the dung N and 0·19 of the urine N was utilized by the grass on the actual patch area and in the rings area around the excreta. This agrees well with Williams & Haynes (Reference Williams and Haynes1994) who measured 0·19 N recovery from cattle urine patches in mixed perennial ryegrass–clover swards and with Middelkoop & Deenen (Reference Middelkoop, Deenen, Gaborcik, Krajovic and Zimkova1990) whose results were 0·11 for dung and 0·14 for urine at a fertilizer level of 250 kg N/ha. However, it is not possible to generalize the figures for the whole summer in the present study, as the experiment started during the second grazing rotation. Obviously, more excretal N would be utilized by grass with earlier application and less with later application of excreta.
In the light of these results, it seems that the timothy–meadow fescue sward responds to abiotic and chemical stressors in a different manner from perennial ryegrass. In a perennial rye grass sward, both the number of tillers and the grass N concentration increase when there is extra light and N available, and this leads to higher DM production and higher N yield of the sward (Williams & Haynes Reference Williams and Haynes1994; Phillips et al. Reference Phillips, Youssef and Chiy1999). The timothy–meadow fescue sward reacted positively to the extra light caused by the absence of herbage growing through the dung pat, but failed to increase the DM production in the urine patch. This suggests that N alone did not increase the DM production when the mineral fertilization was already high. In the urine patch, the existing tillers probably intercepted the light and prevented new tillers from emerging, but the N concentration increased in the existing ones.
N dynamics in soil
The proportion of SON of the STN in the control treatment was high. Comparable figures have been found in organic clover–grass swards (Murphy et al. Reference Murphy, Macdonald, Stockdale, Goulding, Fortune, Gaunt, Poulton, Wakefield, Webster and Wilmer2000). The fertilizer effect was clear but short, which indicates that the grass utilizes small amounts of mineral N effectively. The effect of urine on soil N was visible in the 250–450 mm layer immediately after application, which agrees with Williams & Haynes (Reference Williams and Haynes1994). The overall effect of urine application on soil N concentration was dramatic compared to the control treatment, but it decreased quite quickly during the subsequent year. The effect of dung pats on the soil underneath was modest and slow compared to the large amount of N in the pat, which is in good agreement with the results of Wachendorf et al. (Reference Wachendorf, Lampe, Taube and Dittert2008). However, it was surprising, that the pats were not fully degraded even in winter: almost half of the original organic matter was left.
The reasons for the three major N losses from the urine-treated soil were all different. The first major loss (178 kg N/ha; 0·36 of applied N) that occurred immediately after the urine application was most probably caused by surface runoff, despite the frame that was supposed to limit the urine deposition area. As the soil is not uniform, the edge of the frame was not fully tight, allowing small amounts of liquid to escape from the area. Some of the N stuck to the grass and straws on the soil surface, which were removed from the soil samples. A small amount of N (0·04 of applied N) was lost during the first day, which agrees fairly well with the previous study conducted at the same area on the volatilization of ammonia from urine patches (0·022–0·125 of applied N) after heavy rainfall (20 mm/h; Saarijärvi et al. Reference Saarijärvi, Mattila and Virkajärvi2006).
The second major loss (152 kg N/ha; 0·30 of given N) took place from the 20–100 mm soil layer (5–21 days after application), where most of the nitrification occurred. For this fraction, loss by immobilization is the most probable explanation, since Williams & Haynes (Reference Williams and Haynes1994) have measured immobilization rates as high as 0·20 of applied N during the first 24 h after urine deposition with the N15 technique. As the rainfall during the period was low and the soil dried (Table 1), it is likely that denitrification and leaching losses were small during this period.
The third great loss (102 kg N/ha; 0·20 of given N) at the end of the growing season was most likely caused by leaching, as the lost N was almost entirely in the form of nitrate-N and the rainfall during the period was high (Table 1). In the autumn, 120 days after the excreta application, there was only a small amount of nitrate-N left in the urine-treated soil layer of 250–450 mm.
A question remains what happened to the dung that ‘disappeared’ from the net (DM, N) in the course of the experiment. The most probable reason is physical transport, i.e. by birds, dung beetles and worms, as there were holes at the bottom, inside and at the surface of the dung pat.
The higher SON content underneath the dung pats compared to the control plots was probably caused by dung N carried from the pat to the deeper layers by soil fauna and other factors. The TSN content of the soil significantly increased from autumn to spring in the control and dung treatments. Most of the TSN increase was in the form of SON, which could have originated from microbial lyses caused by ice formation in the soil (Ryan et al. Reference Ryan, Kachanoski and Gillham2000). The other reason for the SON accumulation during winter could be an incomplete N mineralization process during the winter. Reports by Appel & Mengel Reference Appel and Mengel1993; Murphy et al. Reference Murphy, Macdonald, Stockdale, Goulding, Fortune, Gaunt, Poulton, Wakefield, Webster and Wilmer2000; Jones et al. Reference Jones, Shannon, Murphy and Farrar2004 suggest that low molecular weight (LMW) SON acts as a medium in the mineralization process. During the winter, the reaction rate from LMW to ammonia is either prevented or it is very slow, and further nitrification is totally blocked by freezing (Killham Reference Killham1994), which leads to SON accumulation in the soil.
No accumulation of SON occurred underneath the urine patches during winter, even though the measured soluble N concentration in autumn was similar to the control treatment. It is possible that the high (more than two-fold) concentration of soluble potassium (K) in the urine-treated soil (data not shown) prevented ice formation in the soil. As the retention of urine K in soil can be high (Kayser et al. Reference Kayser, Müller and Isselstein2007), the amount of dissolved K in soil solution is also likely to be high. The salinity or electric conductivity of the soil was unfortunately not determined. The K+ concentration of the applied urine was equal to 0·3 N and, according to Eldin (Reference Eldin1991) artificial salting with 0·25 N sodium chloride (NaCl) markedly reduces the moisture transfer to the freezing zone and depth of frost penetration in soil. The soil temperature (0–500 mm) under the snow pack remained above −1°C throughout the winter, so even a small amount of saline solution could have prevented ice formation and thus microbial lyses and SON formation.
Practical implications
In the present experiment, the treatments were applied rather early in the growing season, which enhanced utilization of excretal N by herbage mass. In spite of this, the grass N uptake was slow and a large proportion of the urine N was lost probably by leaching in the autumn.
In a real situation, dung and urine are deposited by grazing animals throughout the whole summer and even in late autumn if the grazing season is extended. The later the dung and urine are deposited, the less excretal N can be taken up by grass and more is lost, especially by leaching (Wachendorf et al. Reference Wachendorf, Lampe, Taube and Dittert2008). To reduce the leaching losses grazing in late autumn should be avoided.
It is well established that excretal N accumulates on pasture soil during grazing years (Tyson et al. Reference Tyson, Scholefield, Jarvis and Stone1997; Saarijärvi et al. Reference Saarijärvi, Virkajärvi, Heinonen-Tanski and Taipalinen2004, Reference Saarijärvi, Virkajärvi and Heinonen-Tanski2007; Wachendorf et al. Reference Wachendorf, Lampe, Taube and Dittert2008). Urine patches cover approximately 0·17 of the soil surface area during one summer. As the grass can take up urine N 150 mm from the edge of the patch, depending on the stocking rate, approximately 0·30–0·35 of the pasture surface area is affected by urine N during one grazing season. If even a small proportion of dung N is mineralized during the second and the third grazing year, the combined influence of dung and urine N on the pasture surface area exceeds 1·0. This justifies the clarification of the requirements of N fertilization of pastures older than 2 years.
In conclusion:
1. The herbage utilization of excretal N is moderate (dung 0·07, urine 0·19) during one growing season with the high fertilizer applications used in Finland. The effect extended to 150 mm from the patch edge on both treatments.
2. Because a large proportion of the excretal N is immobilized and cumulated in soil during grazing years, it is justified to clarify the requirement of N fertilization of pastures older than 2 years.
3. There were three major N losses from the urine-treated soil: one immediately after application (surface runoff and ammonia volatilization), another during the summer (immobilization and denitrification), and a third at the end of the growing season (leaching). In the dung, the mineralization process is minor and most of the loss seems to be of a physical nature.
4. The amount of SON in the soil measured to the depth of 600 mm remained fairly stable (c. 60 kg N/ha) throughout the experiment and was the major fraction of the TSN in soil.
We thank Dr. H. Heinonen-Tanski and Dr. Eila Turtola for their comments on the manuscript. Special thanks are due to Erkki Saarijärvi, for help with finishing this paper. We would also like to thank the staff of MTT Maaninka for their help with this laborious experiment. This study was financially supported by the Ministry of Agriculture and Forestry and the Finnish Cultural Foundation.


