


1. Introduction
How would you vote if, while waiting in line to cast a ballot, you had knowledge of actual election returns as they were happening? Would you stick with your original preferred candidate? Or would the knowledge of the election results so far induce you to change your vote choice (switching to the leading candidate, or shifting support to your second-choice candidate to prevent your least-preferred candidate from winning, for example), or would it perhaps even dissuade you from voting altogether because the effort no longer seemed worthwhile?
As incredible as the above scenario may sound, this was exactly what occurred during the election for the mayor of Taipei, Taiwan, held in November 2018. Although thousands of Taipei residents citywide were still standing in line to vote after the polls were supposed to have closed at 4 p.m. (Huang, Reference Huang2018), the process of vote counting and reporting had begun at other polling places that had finished voting, with preliminary voting figures being first leaked online and then widely reported by different media outlets as time progressed. Thus, due to extended polling hours and unexpected long lines at numerous polling places across the city, late voters who had access to the internet were able to check how the election was panning out in real time before casting their votes. According to news reports, voting in Taipei continued well into the evening on election day and some polling places did not start processing ballots until after 7 p.m. – 3 hours after the official deadline – because of long lines and other delays (Wang et al., Reference Wang, Shih and Huang2018).
The fact that the official tallying of votes had begun before all the ballots were cast, and the news that these late voters could potentially learn or have information about the final election outcome before submitting their ballots, caused a general uproar in the city and across Taiwan. Given that the Taipei mayoral contest was ultimately decided by a razor-thin margin – the incumbent independent mayor Ko Wen-je defeated his Kuomintang (KMT) opponent Ting Shou-chung by a mere 0.25%, or 3,567 votes out of more than 1.4 million cast – many citizens, particularly those who supported the losing candidate, were asking whether the election's outcome was legitimate. In fact, amid this unprecedented controversy over the fairness of the election, Ting did not concede the mayoral race to Ko on election night, because he strongly suspected that the outcome would have turned out in his favor had the entire process of voting been better managed by those responsible.Footnote 1
In this study, we are not interested in who should have won the 2018 Taipei mayoral race or why. Rather, we make use of this unique naturally occurring experiment to address a question that has long puzzled political scientists studying elections and voter behavior: if presented with the opportunity (as provided by the knowledge of early voting results), do voters engage in strategic voting? We shall demonstrate that even under the most ideal conditions for voting strategically, there is no clear evidence that a majority of the late voters did so.
2. Strategic voting and information about early vote choices
For over 60 years, the rational choice approach developed by Downs (Reference Downs1957) and later extended by Riker and Ordeshook (Reference Riker and Ordeshook1968) has shaped political scientists' thinking on the issue of citizens' rationales and motivations for voting. Inspired by these two early fundamental works, two influential schools of thought have come to dominate the voting literature: strategic voting and sincere voting. Strategic (or tactical) voting theory casts voters as rational agents who make voting decisions based on the possibility that their votes are pivotal in deciding the outcome of electoral contests. Under this rational choice framework, a strategic voter is defined as someone who votes instrumentally, that is, with the intention of maximizing her expected utility in determining election outcomes, taking into consideration the actions of other voters (Cox, Reference Cox1997; Shepsle and Bonchek, Reference Shepsle and Bonchek1997; Blais and Degan, Reference Blais, Degan, Congleton, Grofman and Voigt2019). Put differently, so-called strategic voters may sometimes choose to cast ballots for their second preference as opposed to their first, because they want to ‘make their votes count’ and not waste their votes on a hopeless candidate or cause.
Sincere (or expressive) voting, by contrast, theorizes that individuals derive utility directly from sincerely expressing their preferences inside the voting booth, as if to send a signal regarding their beliefs, values, and ideology (Brennan and Lomasky, Reference Brennan and Lomasky1993; Schuessler, Reference Schuessler2000; Hamlin and Jennings, Reference Hamlin and Jennings2011; Spenkuch, Reference Spenkuch2018). Under this paradigm, the voter always supports her most preferred candidate or party, irrespective of the latter's chances of winning. A person who behaves in this manner is thus referred to as an expressive or sincere voter.
According to Cox (Reference Cox1997), three basic conditions must be satisfied for strategic voting to take place. First, voters must be ‘short-term utility maximizers,’ which means that they care only about who wins the present election, not future ones. Second, voters should have some information about the relative strengths of the various candidates: specifically, this implies possessing knowledge about the different candidates' actual probabilities of winning the election. Third, voters must also have a strong subjective sense that their vote will make a difference in determining which candidates or parties get elected to government (Blais and Degan, Reference Blais, Degan, Congleton, Grofman and Voigt2019); in other words, they are not merely engaged in expressive voting or involved in a symbolic gesture of some kind.
Nevertheless, as other scholars have stressed, how voters actually behave at the polls is ultimately an empirical question (cf. Kawai and Watanabe, Reference Kawai and Watanabe2011; Spenkuch, Reference Spenkuch2018). Indeed, among the many topics associated with the analysis of voting behavior in multi-candidate elections, the question of whether voters have acted strategically or sincerely is often impossible to avoid. The phenomenon of strategic voting is not only interesting in and of itself, but it is also of immense importance to politicians, potential office seekers, political campaign consultants, and ordinary citizens.
As previous researchers recognized, however, the principal difficulty in inferring strategic voting from naturally occurring election data is that individual voters' true beliefs and preferences (i.e., how close the individual thinks the election contest is, what she considers the relative ranking of candidates to be, etc.) are unobserved. Few of the three conditions laid out by Cox (Reference Cox1997) above can be met with aggregate-level data. So, despite an equally vast empirical (and experimental) literature on strategic voting, there is no scholarly consensus on the actual extent of sincere and strategic voting, assuming that estimates of either type of voting can be reliably detected and measured in the first place (for selected reviews of the literature, see Gschwend and Meffert, Reference Gschwend, Meffert, Arzheimer, Evans and Lewis-Beck2017; Spenkuch, Reference Spenkuch2018; Blais and Degan, Reference Blais, Degan, Congleton, Grofman and Voigt2019).
As for the literature on how information can affect turnout and voter behavior at the polls, the most relevant studies are those that investigate the so-called West Coast effect in the USA (cf. Delli Carpini, Reference Delli Carpini1984). The controversy and debate over this effect emerged in the early 1960s and continued in the 1970s, after major news networks began projecting US presidential race winners based on exit polls conducted in the eastern states, while voting was still in progress in the West. If a voter in this region had seen the news broadcast, or heard about it from someone who did, then she would have information about the election that hypothetically might influence how she voted or even her motivation to go to the polls. Critics of this practice argue that these early projections of victory (or ‘early calls’) by the media are unfair and undemocratic because they potentially depress turnout in the western states and may affect the outcome of other local races in that region.
Although these criticisms may have a point, at either the aggregate or individual level of analysis the empirical evidence that early winner projections by news networks have reduced voter turnout or affected people's vote choices is, at best, null or inconclusive (Adams, Reference Adams2005; Morton et al., Reference Morton, Muller, Page and Torgler2015). Studies based on the 1980 US presidential contest further indicate that the reported relationships between early projections and lower turnout are weak even when they are statistically significant, and the number of voters affected by exposure to such information has been small (Sudman, Reference Sudman1986; Traugott, Reference Traugott, Mann and Orren1992).
Nevertheless, these studies on the West Coast effect are instructive because some parallels can be drawn for the present study. As we describe in the next section, TV networks in Taiwan began to report actual vote counts of the Taipei mayoral election around 5:30 p.m., at a time when possibly thousands of Taipei citizens were still waiting in line to vote. By broadcasting the partial vote counts, the networks were essentially providing late voters with information not only about the extent to which their vote might be decisive (if the election were close), but also insights into the vote choices of other citizens who had voted earlier in the day. So, upon learning that their vote will not affect the overall electoral outcome, a rational individual standing in line to vote might consider abstaining even if the cost of voting were minimal. By contrast, if the election is extremely close and the probability of a vote being pivotal to the outcome is high, then citizens who still have an opportunity to cast a ballot should remain in line and wait for their turn to vote. However, if a voter decides not to abstain, how should she vote?
Past studies that investigated the impact of opinion polls, exit polls, and early projections also suggest that a ‘bandwagon effect’ (a vote for the expected winner, or whichever candidate is ahead in the race) or an ‘underdog effect’ (a sympathy vote for the presumed loser, or the candidate who is behind) may both have some influence on voter choices (Lang and Lang, Reference Lang and Lang1968; Mendelsohn and Crespi, Reference Mendelsohn and Crespi1970; Morton et al., Reference Morton, Muller, Page and Torgler2015). Although an examination of the bandwagon/underdog effect is beyond the scope of this paper, we note that the labels of bandwagon/underdog and strategic/sincere are not mutually exclusive; they may overlap. For example, depending on one's policy preferences, ‘to jump on the bandwagon’ and vote for the frontrunner can be a calculated, strategic act much in the same way as a vote for the underdog.
In the following, we provide a brief background to the 2018 Taipei mayoral race and explain why this election presents an ideal opportunity to investigate the extent of strategic voting after voters have been exposed to media reports of early election results while polls are still open.
3. The 2018 Taipei mayoral election
On Saturday, 24 November 2018, the people of Taiwan went to the polls to choose over 11,000 local-level officials and voice their opinion on 10 referendum issues ranging from the legalization of same-sex marriage to the phasing out of nuclear power. Prior to the vote, most critics agreed that these island-wide local elections provided a chance for Taiwanese voters to evaluate the performance of President Tsai Ing-wen and the ruling Democratic Progressive Party (DPP) who had been in office since 2016. Election results would show that the voters were indeed deeply dissatisfied with the policies and reform initiatives of the Tsai administration. The DPP lost seven of the 13 cities and counties it had previously controlled. Its overwhelming defeat in the southern port city of Kaohsiung was especially stinging as the city had long been a DPP stronghold.
As a clearly unhappy electorate was delivering the DPP a country-wide electoral setback, a different type of contest was playing out in Taipei, the capital of Taiwan and the country's political, economic, and educational center.Footnote 2 For the previous 4 years, Taipei had been governed by Ko Wen-je, a straight-talking doctor-turned-independent politician, now seeking a second term. Back in 2014, Ko was swept into office on a wave of popular discontent with the then ruling KMT, helped by a high turnout among young voters and, most critically, the full backing of the DPP, which chose not to field a candidate. In that year's mayoral race, Ko comfortably defeated the KMT nominee Sean Lien with 57.2% of the votes cast over the latter's 40.8%.
However, soon after becoming mayor of Taipei, Ko began to distance himself from the party that had helped him get elected, citing his ‘political outsider’ status and personal campaign pledge to stay above the constant, destructive partisanship that has come to dominate the modern Taiwanese political scene. His pragmatic and flexible approach to maintaining ties between Taiwan and China also put him at odds with core DPP partisans, who generally support the cause of Taiwan independence. Relations between Ko and the DPP became even more strained and acrimonious when Ko openly endorsed the idea that ‘both sides of the Taiwan strait are one family,’ a discourse that later earned him praise from Chinese leaders. The mayor's perceived drift toward China eventually led the DPP to sever its informal alliance with Ko and nominate its own mayoral candidate, city councilor Yao Wen-chih, in the 2018 election. To demonstrate his commitment and determination to win the race, Yao vowed during the campaign that he would retire from politics altogether if he finished third in the election.
The DPP's decision to cut ties with Ko was not an easy one, however. Taipei is historically a stronghold of the KMT and its pro-unification allies. In the city's short electoral history, the DPP was able to capture the mayoral seat only once, in 1994, when a young Chen Shui-bian emerged victorious in a three-person race after the traditional KMT vote was split (Hsieh et al., Reference Hsieh, Niou and Paolino1997). As frustrating – and infuriating – as Ko's political statements and actions sometimes were, for some DPP leaders the incumbent mayor remained someone the party could find a way to work with. By putting forward its own candidate in the race, the DPP risked siphoning votes away from Ko and handing the mayoralty back to the KMT, arguably a worse outcome if seen from a traditional party politics perspective.Footnote 3
The KMT, for its part, was determined to win back Taipei City Hall after losing it in an embarrassing fashion 4 years prior. To that end, the party nominated Ting Shou-chung, a veteran city councilor and perennial would-be mayor, as its candidate. Ting's campaign strategy in 2018 was simple: attack Ko and ask KMT supporters to turn out in droves on election day.
Ahead of the November elections, Ko was on track to win reelection, as nearly every major media poll taken from June to October 2018 put him in the lead.Footnote 4 The non-partisan Ko remained popular among average citizens who found his blunt personality, financial discipline, and solution-first approach to city governance attractive. Additionally, his effective use of social media and astute online campaigning made him extremely well-liked among the younger generation of voters.
As the 2018 campaign drew to a close, however, the race tightened. Poll numbers published by Taiwan's TVBS Media on the eve of the 10-day blackout period showed that 39% of those surveyed preferred Ko, 36% favored Ting, and 12% backed Yao. A pro-KMT Want Want/China Times poll released on the same day found that Ko and Ting were running neck and neck (33.6 vs 32.8%), with Yao trailing at 14.8%. Still, despite the closeness shown in these final pre-election polls, most people expected (falsely, as it turned out) Ko to win another term comfortably, likely due to two main factors: one, Ko's largely persistent lead in the polls as mentioned above, and two, Ko's popularity and rather stellar job approval ratings, especially in the aftermath of the extraordinarily successful hosting of the 2017 Taipei Summer Universiade.
Although there was a total of five candidates in the 2018 Taipei mayoral race, only three were viable: incumbent mayor Ko, KMT candidate Ting, and, to a lesser extent, DPP nominee Yao. In the run-up to election day, all three candidates believed that they could win; but if the above pre-election poll numbers were to be believed, the next mayor of Taipei would likely be either Ko or Ting, with Yao most likely playing the role of the spoiler. The three-way split in the polls provided an ideal scenario for strategic voting (particularly among DPP supporters who had intended to vote for Yao). Unforeseen events on voting day would create additional reasons for some voters to vote strategically. These unanticipated election-day incidents are discussed below.
4. Unexpected political consequences of leaked information
As noted previously, due to the unprecedented number of referendums held at the same time as the local elections, long lines were observed at polling places across the country, with many voters reporting that they had waited more than 2 hours to cast their ballots (Huang, Reference Huang2018). Prior research has shown that long lines tend to discourage citizens from voting, reduce voter confidence in election results, and impose undue economic costs on voters (Stewart and Ansolabehere, Reference Stewart and Ansolabehere2015). Many of those waiting in line played with their smartphones to pass the time.Footnote 5
So why were there such long lines? Wait times increased considerably when voters had to decide how to vote on up to 10 referendum items. Some voters appeared to be ill-prepared for the referendum issues, only starting to think about them on the spot. Also, the fact that some referendum questions were presented in highly convoluted language – which created more confusion than clarity – likely slowed down the process even more. Although most voters seemed to be orderly and enthusiastic, we also witnessed a few of them give up on voting altogether when they saw the length of the lines.
By 4 p.m. – the time when the polls were officially due to close – the lines at some polling places in the city did not seem to have gotten any shorter. Moreover, because the Central Election Commission (CEC), the government agency responsible for managing elections across Taiwan, had announced earlier that day that all eligible voters who had arrived at their designated polling place before 4 p.m. would still be permitted to vote, the polling places had to stay open until the last person in line had finished casting her ballots.
But here lies a problem. According to CEC guidelines, each polling place operates as an independent unit; once all voting has ceased and there are no more voters in line, the polling place must immediately be converted into a ballot-counting station to begin the process of tallying votes and reporting the vote count back to the CEC.
When 4 p.m. arrived, the majority of Taipei's 1,563 polling places remained open. According to CEC data, just 323 polling places (about one-fifth of the total) finished voting and started counting votes between 4 and 4:30 p.m. Another 384 polling places closed and began tallying votes in the half hour between 4:31 and 5 p.m., followed by 292 and 258 polling places in the subsequent two 30-minute increments. The last polling place to start counting votes did not do so until 8:30 p.m. (polling place #221 in Shilin District). For the distribution of ballot counting times for all 1,563 polling places in the 2018 Taipei mayoral election, refer to Figure 1. Moreover, there was great variation in the polling places' ballot-counting times across Taipei's 12 administrative districts, likely due to the size of the electorate in each district. As seen in Figure 2, Nangang (#4 on the inset map), the district with the fewest polling places and smallest electorate, had finished all voting before 6 p.m. By contrast, Da'an (#11 on the inset map), which is the largest district both in terms of the size of the electorate and number of polling places, did not finish voting until 7:30 p.m.

Figure 1. Overall distribution of the polling places' ballot-counting times during the 2018 Taipei mayoral election.
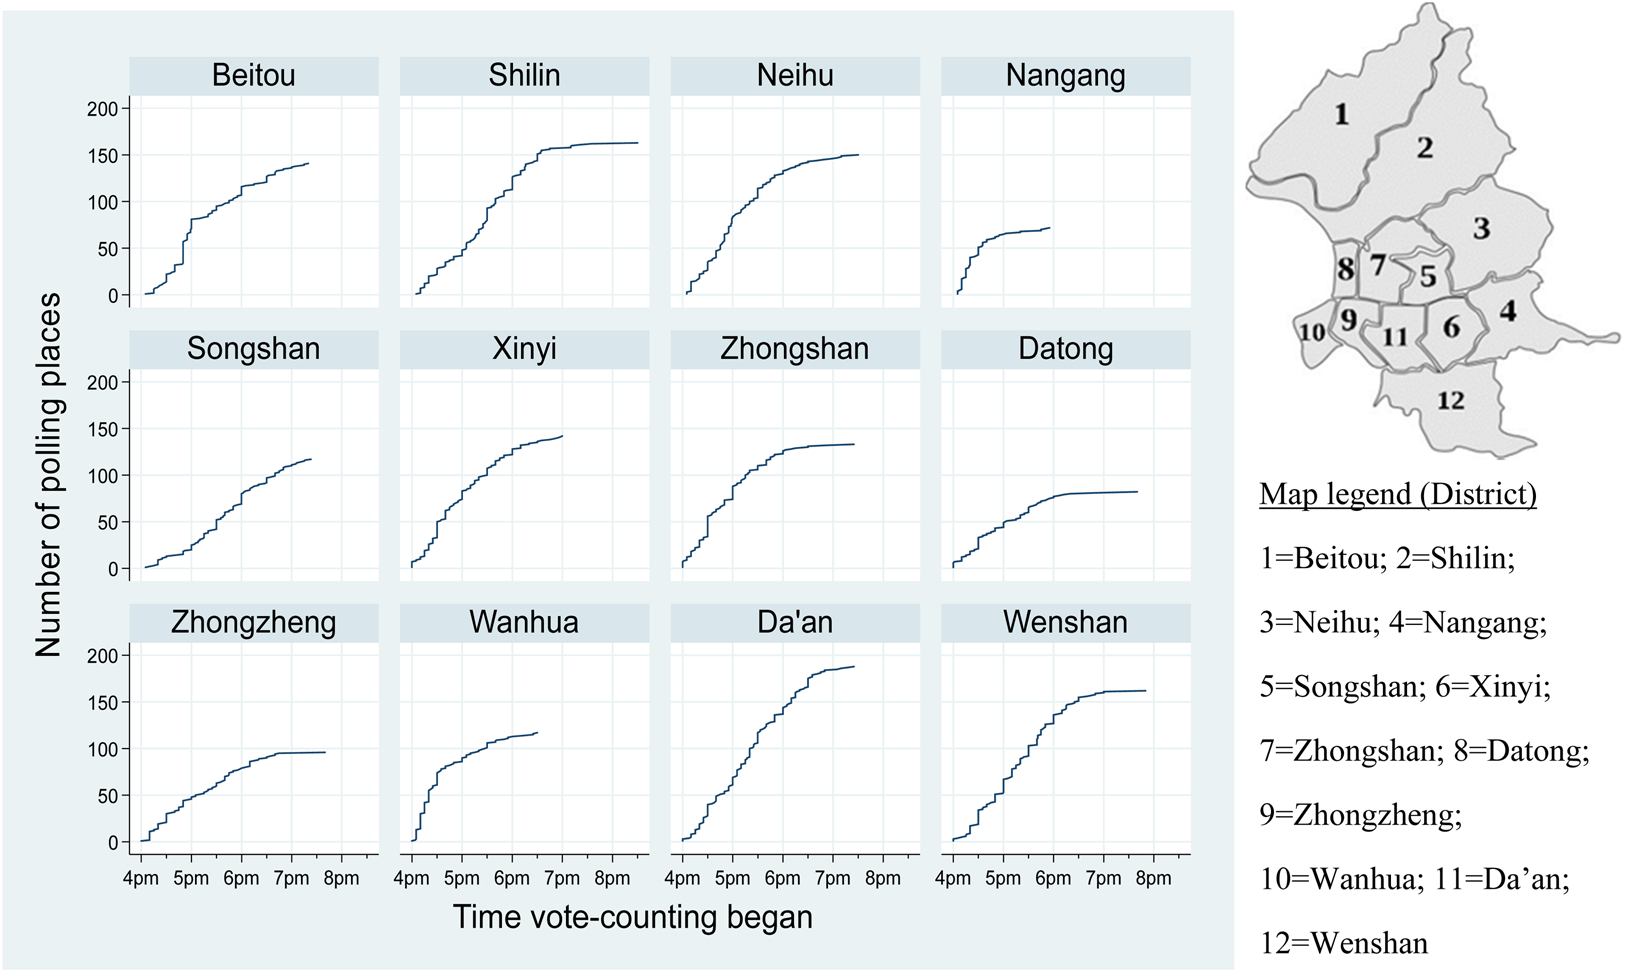
Figure 2. Cumulative distribution of the polling places' ballot-counting times during the 2018 Taipei mayoral election: results by administrative district.
Nevertheless, as in the past, post-election coverage and analysis began punctually at 4 p.m., when the polls usually close. Results for all major races were regularly updated throughout the coverage, as soon as preliminary vote count information reached the networks. Talk of long lines and voter enthusiasm at the polls dominated the early election coverage, with a few projections of the more uncompetitive elections thrown into the mix. A critical moment came sometime around 5:30 p.m., when news channels began to screen the very first official vote totals for the Taipei mayoral race. These earliest voting reports provided two important pieces of information not available to citizens who voted earlier in the day: one, DPP candidate Yao was indeed running a distant third, with no hope of winning; and two, Ting was performing much better than expected and was in a very tight race with Ko.Footnote 6
As major TV networks and online news websites were busy reporting that Ting and Ko were level pegging, and that Ting had a good chance of beating the incumbent mayor, an unknown but not insignificant number of Taipei citizens were still eagerly waiting in line to exercise their right to vote.Footnote 7 If these ‘late voters’ (defined as those still voting after 5:30 p.m.) had access to the internet and/or social media, they would have been able to find out that the Taipei mayoral race had become much closer than anyone had expected. This knowledge, of course, also implied that their vote, which they had yet to cast, would have a slightly higher chance of being ‘decisive’ or ‘pivotal,’ relative to tens of thousands of other votes that were cast earlier in the day without such information. In other words, these late voters were now in a perfect situation to engage in strategic voting behavior (if they chose to), as all three conditions described by Cox (Reference Cox1997) were reasonably met. What would citizens who possessed this information actually do, as they stepped into the voting booth?
5. Research design and methods
Our analytical strategy involves two steps: we first determine how the vote shares (the number of votes a candidate receives divided by the total number of ballots cast) of the three most viable candidates – Ko, Ting, and Yao – vary as a function of the time when polling places finished voting and could technically begin to count votes, or ballot-counting time.Footnote 8 Following this initial step, we then compare and contrast vote patterns for the three candidates to ascertain evidence of strategic voting. Our hypothesis is, if strategic voting among late voters has taken place, the vote shares for the candidates who have the best chance of winning would be positively and significantly associated with the polling places' ballot-counting times.
To be more precise, the later the polling place began to count votes (particularly after 5:30 p.m.), the more likely voters at that polling place would be to have information about the election results before casting their ballots, which would imply (a) higher vote shares for either of the two leading candidates, Ko and Ting, and (b) a lower vote share for the candidate who was far behind, which was Yao. We recognize that some strategic voting by citizens who had voted earlier in the day might have already occurred, but our point is that if late voters were truly acting as utility maximizers as rational choice theory says, then there should be more evidence of strategic voting in polling places that were still open when news networks began to broadcast preliminary vote counts of the election on live television.
To check on this possibility, in the multivariate regression models we split the polling place sample into two groups: one representing polling places that had closed before the information about election results was made available by the media, and the other representing polling places that were still open after the said information became widely disseminated. The aim is to see whether differences in vote patterns can be discerned between these two groups of polling places, and to understand how exposure to election news broadcasts might affect candidate vote shares.
Because the polling places remaining open after 4 p.m. are not a random sample of all polling places, we take several steps to mitigate the possible sources of bias, including selection bias.Footnote 9 First, we use the vote share of Sean Lien, the KMT candidate in the 2014 Taipei mayoral election, as one of the control variables.Footnote 10 This variable is utilized as a proxy for the aggregate voter structure and preference at each polling place, since individual voter preferences and characteristics are not observed at the polling place level.Footnote 11 Coincidentally, we note that Ting's vote share in the 2018 election was nearly identical to Lien's share in the 2014 election, with both KMT challengers obtaining approximately 40.8% of the valid votes.
Another control variable included in the models is the polling place's characteristic in terms of its voting patterns in the previous two elections. A polling place is designated as ‘safe KMT’ if the KMT mayoral candidates carried the said polling location in the 2010 and 2014 elections; ‘safe DPP’ if DPP-backed mayoral candidates obtained the most votes in 2010 and 2014; and ‘swing’ if the majority of the voters at that polling location voted for the KMT candidate in 2010 but switched to Ko in 2014. Next, we also control for voter turnout and the size of the electorate at each polling place. Finally, to control for the general effects of voter age and education, we also include in the regressions the percentage of citizens aged 20–39 years and the percentage of college graduates, with both variables measured at the administrative district level.Footnote 12
Our main dependent variables are thus vote shares for each of the three candidates. Furthermore, in the current study, we adopt a multilevel approach because we suspect that there may be important, unaccounted for district-level variations in the data that we are not able to explain in the model, including basic variables such as income and ease of access to polls, or administrative variables such as vote processing/counting efficiency of poll workers. We thus assume that the data have a hierarchical structure, with polling places clustered within the larger administrative districts. Multilevel modeling, which takes account of unexplained group-level differences in estimation, is appropriate for this type of analysis (Robson and Pevalin, Reference Robson and Pevalin2016). In sum, we estimate the following random intercept model for each of the three candidates:
 $$Y_{ij} = \beta _0 + \beta _1X_{1ij} + \cdots + \beta _8X_{8ij} + u_j + e_{ij}$$
where i is the unit at level one (i.e., polling place); j is the unit at level two (i.e., administrative district); Y ij is the Candidate vote shares for Ko, Ting, and Yao, respectively; X 1ij to X 8ij are all the eight explanatory variables in the regression model, including ballot-counting time, polling place characteristic, the interaction term between ballot-counting time and polling place characteristic, turnout, the size of electorate, Lien's vote share, average age, and average education; u j is the random intercept at level two; and e ij is the random errors of prediction at level one.
The voting data used in this study came from the CEC, whose website carries the official results of all previous elections in Taiwan.Footnote 13 The data encompass all voting information pertinent to each of the 1,563 polling places in Taipei, including the votes for each candidate, number of ballots cast, total number of eligible voters, and the polling place's ballot-counting times, among other details. Summary statistics for the variables in the multilevel regressions can be found in the Appendix.
6. Discussion of findings
Before presenting our multilevel analysis, we first plot the level of turnout and vote shares for all three main candidates by the time of day when polling places began counting votes (Figures 3 through 6). These figures provide us with a comprehensive view of the polling place data as a function of time. First, judging by the fitted Lowess curves (marked in red) in Figure 3, we find that the later the polling place began to count votes, the lower the overall level of turnout. This result is clearly expected, as the costs of voting had become prohibitive for some voters with increases in wait times. Second, in Figure 4, the vote share of incumbent mayor Ko does not appear to be related to polling places' ballot-counting times, as the fitted Lowess curve looks mostly flat between 4 and 7 p.m., only ticking upward in the period after 7 p.m. Third, the Lowess curve fit for Ko clearly differs from that of KMT candidate Ting, whose vote share appears to increase in the period from 4 to 7 p.m. but then drops sharply in the period afterward (Fig. 5). Finally, in Figure 6, we observe that the vote share trend for Yao, the DPP nominee, mostly decreases as time proceeds, only showing signs of an increase sometime after 7 p.m. on election night.

Figure 3. Levels of voter turnout at all 1,563 polling places in the 2018 Taipei mayoral election, by ballot-counting time.

Figure 4. Vote share for Ko Wen-je at all 1,563 polling places in the 2018 Taipei mayoral election, by ballot-counting time.

Figure 5. Vote share for Ting Shou-chung at all 1,563 polling places in the 2018 Taipei mayoral election, by ballot-counting time.

Figure 6. Vote share for Yao Wen-chih at all 1,563 polling places in the 2018 Taipei mayoral election, by ballot-counting time.
To understand the effect of ballot-counting time on turnout and candidates' vote shares, we divide the data into two groups as noted earlier: polling places that began counting ballots before 5:30 p.m. and those that did so after 5:30 p.m. There are 999 polling places in the former group and 564 in the latter.Footnote 14 The threshold (or cutoff) time of 5:30 p.m. was chosen because we can be certain that no voters at a polling place that began counting votes before 5:30 p.m. could have obtained (or been exposed to) information about election results from internet news outlets or social media before casting their votes. With respect to the level of information exposure among would-be voters in the post-5:30 p.m. group, however, we cannot be nearly as certain.
Table 1 presents the results of means comparison tests (t-tests) conducted on turnout and candidates' vote shares between the two groups. Polling places that started counting votes later than 5:30 p.m. had lower levels of turnout (−0.0178) than those that started earlier. This pattern holds for incumbent mayor Ko, whose mean vote share in polling places that counted ballots after 5:30 p.m. was on average 0.36% lower when compared to that of the earlier period, although the difference in vote shares was not statistically significant at the 0.05 level. In contrast, vote share for Ting went up by 1.32% in polling places that counted ballots after 5:30 p.m., and the difference was statistically significant (P < 0.001). As for the DPP candidate, on average Yao's vote share suffered a 0.85% drop in polling places that counted votes after 5:30 p.m. compared to those that counted before, and the difference was statistically significant.
Table 1. Comparison of mean voter turnout and mean vote shares for the three main candidates in the 2018 Taipei mayoral election, by whether polling places counted ballots before or after 5:30 p.m.

Note: Entries are means and standard deviations are in parentheses.
*P < 0.05; **P < 0.01; ***P < 0.001.
Results of the multilevel regressions on vote shares for each of the three mayoral candidates are displayed in Tables 2, 3, and 4, respectively. Across the models in all three tables, the intraclass correlation coefficients (ICC) range from 0.07982 to 0.24251, meaning that our multilevel modeling strategy is appropriate because between 8.0 and 24.3% of the unexplained variance in candidate vote shares can be attributed to differences among Taipei's administrative districts.
Beginning with the analysis of Ko's vote share, we find that when all 1,563 polling places are included in the analysis (Table 2, column 2), the polling places' ballot-counting times are not significantly associated with Ko's vote share, the dependent variable. Moreover, there were fewer votes for Ko in polling places that traditionally voted for the DPP (β = −0.0969, P < 0.01), compared to the ‘swing’ polling places (i.e., former KMT areas which Ko seized in the previous mayoral election). Ko Wen-je also appeared to obtain fewer votes in the KMT strongholds, but the effect was not significant (β = −0.0578, P > 0.05).
Table 2. Multilevel model estimates of Ko's vote share during the 2018 Taipei mayoral election

Note: Standard errors in parentheses.
a Ballot-counting time (measured in decimal minutes), the time of day when the polling place finished voting and began to count votes; ICC, intraclass correlation coefficient; df, degree of freedom; AIC, Akaike information criterion.
*P < 0.05; **P < 0.01; ***P < 0.001.
The multiplicative terms of ballot-counting time and polling place characteristic exerted a small influence on the dependent variable. Interestingly, the statistics demonstrated that vote shares for Ko were higher in safe DPP polling places as ballot-counting times got later (β = 0.00006, P < 0.01), compared to the baseline group. Nevertheless, the incumbent mayor received more votes from polling places with higher levels of turnout and a larger electorate. As expected, the relationship between Lien's vote share (2014) and Ko's vote share in 2018 was significantly negative (β = −0.330, P < 0.001). With respect to the effect of age, districts with a larger population of citizens aged 20–39 were no more likely to vote for Ko relative to districts with a larger population of citizens aged over 40. As for education, the coefficient for the variable of percentage of college graduates was positive but not statistically significant.
When the sample is split into the ‘before 5:30 p.m.’ and ‘after 5:30 p.m.’ sub-samples (columns 3 and 4, respectively, in Table 2), not all the significant relationships observed previously for the entire sample remained as such. In polling places that counted votes after the cut-off time of 5:30 p.m. (column 4), ballot-counting time continued to show no statistically significant association with Ko's vote share (β = 0.00002, P > 0.05), indicating that Ko did not particularly benefit from the extended polling hours or the broadcast of vote tally information.
Additionally, the variables related to the polling place's previous voting history (including the interaction terms with ballot-counting times) also lost their statistical significance – apparently, Ko's statistically significant voter-advantages in ‘safe DPP’ areas were no longer present (β = 0.00006, P > 0.05). At first glance then, the results thus far suggest that overall vote patterns with respect to Ko in the ‘after 5:30 p.m.’ sub-sample were somewhat different from those of the other sub-sample, when other control variables were taken into account.
Table 3 displays the results of our multivariate analysis of the vote share for Ting, the KMT mayoral candidate. Contrary to expectations, the coefficients for nearly all the independent variables (except for Lien's vote share and percentage of citizens who were college graduates) were statistically insignificant, meaning that these variables could not be reliably used to estimate Ting's vote share in the 2018 mayoral election. In particular, similar to the results obtained for Ko's vote share, the polling place's ballot-counting time did not have a statistically significant effect on Ting's vote share, either across the entire sample or in the two sub-samples. Taken together, the data in Table 3 suggest that voting patterns for the KMT candidate in polling places that started counting votes later in the evening were not that different from the patterns in those that started earlier.
Table 3. Multilevel model estimates of Ting's vote share during the 2018 Taipei mayoral election

Note: Standard errors in parentheses.
a Ballot-counting time (measured in decimal minutes), the time of day when the polling place finished voting and began to count votes; ICC, intraclass correlation coefficient; df, degree of freedom; AIC, Akaike information criterion.
*P < 0.05; **P < 0.01; ***P < 0.001.
Finally, to complete the analysis, we present the multilevel regression estimates for Yao's vote share in Table 4. From the table we find that, overall, votes for Yao decreased with the polling places' ballot-counting times, especially in the ‘after 5:30 p.m.’ sample (β = −0.00005, P < 0.05; Table 4, column 4). Stated differently, there were significantly fewer votes for Yao in the polling places that started to count votes after 5:30 p.m., ceteris paribus. Not surprisingly, Yao's vote share was higher in polling areas that traditionally favored the DPP, but lower in those neighborhoods with a higher percentage of people aged 20–39 or people with a college education.
Table 4. Multilevel model estimates of Yao's vote share during the 2018 Taipei mayoral election

Note: Standard errors in parentheses.
a Ballot-counting time (measured in decimal minutes), the time of day when the polling place finished voting and began to count votes; ICC, intraclass correlation coefficient; df, degree of freedom; AIC, Akaike information criterion
*P < 0.05; **P < 0.01; ***P < 0.001.
How should we interpret the above statistical results in light of our discussion of strategic voting? Based on the multilevel linear regression results and the graphs, we draw the conclusion that these ‘late voters’ do not exhibit particularly strategic voting behavior, even when given the opportunity to do so. The key lies in understanding the voting behavior of a subset of the late voters: those who supported Yao and the DPP. According to strategic voting theory, they represent the group of voters with more incentive to cast a strategic vote than supporters of the other two candidates, because both pre-election polls and the leaked early vote counts indicated that Yao was not going to win the mayoral contest.
Thus, assuming that they wanted to maximize their expected payoff from voting (i.e., they acted instrumentally and wished to make their votes count), as soon as they found out from the media that Yao was running far behind Ko and Ting in the early vote returns, they should have switched their vote to either Ko or Ting. Yet, to the extent that Yao's decreasing vote share as ballot-counting time extended into the evening could be an indicator of this ‘vote-switching’ taking place, we argue that this phenomenon could also be the result of DPP supporters deciding to give up waiting to vote (or ‘balking’ in queuing theory) once they had certain information that Yao had no chance of becoming the next Taipei mayor.
Here, deciding to leave the polling place without voting could be considered as rational, since time is a valuable resource, but such an act is not strategic. Rather than choosing the ‘lesser of two evils’ at the polling booth, they preferred to stick with voting for Yao or to simply walk away. The uptick in Yao's vote share after 7 p.m. as seen in Figure 6 offers some evidence that many late DPP supporters remained loyal to Yao – if they stayed to vote at all – and did not switch their vote to Ko, the man whom the party backed 4 years earlier and who was their most ‘logical’ choice.
Evidence against the emergence of ‘late’ strategic voters should also be clear from the non-significance of the effect of the ballot-counting time variable on the vote shares for Ko, the eventual winner, in the ‘after 5:30’ sample (Table 2, column 4). If DPP supporters were not ‘deserting Yao to save Ko (or to prevent Ting from winning)’ in large numbers, then given the general political preference profiles of Taipei citizens, it is difficult to fathom why a DPP sympathizer would tactically vote for a KMT candidate, unless they really disliked the mayor or feared that Ko would pose a challenge to President Tsai in the future (as mentioned in the previous section). Stated another way, our statistical analyses inform us that most (if not all) of those voters still waiting in line after 5:30 p.m., assuming that they were able to learn about the latest election results (either from another person or online through their smartphones), did not behave as strategic voting theory predicts that they should.
Rather, we believe that most ‘late voters’ were voting their true preferences as ‘sincere’ voters. Ko's followers were staying in line to ensure that their candidate would fend off Ting's surprisingly strong challenge and win his reelection bid. Ting's supporters were also putting up with the long wait in the hope that they would be able to help their candidate upset the incumbent mayor. Note that late votes for Ting might have also come from KMT voters who originally intended to vote for Ko prior to the election (perhaps as a bandwagon vote), but upon learning that Ting was performing much better than expected, decided to return to their true preference. And Yao's fans, we contend, were selecting from among three possible courses of action – (a) remain firm and vote Yao for ideological reasons or out of party loyalty, (b) abstain by ‘balking,’ or (c) switch their votes to either Ko or Ting (as strategic voting theory says that they should). We argue that although this last option was possible, it did not occur in this election, judging from the multilevel modeling regression results.
7. Conclusion
In this study, we describe a case in which citizens voting late on election day would be expected to behave strategically when they cast their ballots. Due to the combination of unexpectedly long lines, extended polling hours, and leaked media reports, Taipei citizens still waiting to vote past 5:30 p.m. on election day were in an ideal position to be motivated to vote strategically. Not only did these late voters potentially have information about the election results thus far, but because the mayoral race was close, they also knew that their vote had a higher probability of being decisive in determining the winner. After an examination of aggregate polling data, however, we have not been able to identify a clear instance of these late voters' strategic behavior, leading us to believe that voters cannot generally be assumed to be as sophisticated as the proponents of that theory consider them to be.
Although data from a single election obviously do not invalidate an entire body of work based on the logic of strategic voting theory, we join the chorus of other political scientists who have urged us to refine the theory. We must allow for the possibility that voters are not necessarily wired to vote strategically.
Supplementary material
The supplementary material for this article can be found at https://dataverse.harvard.edu/dataset.xhtml?persistentId=doi:10.7910/DVN/JYKQLH.
Appendix
Table A1. Descriptive statistics


