Introduction
The revised Beck Depression Inventory-II (BDI-II; Beck et al. Reference Beck, Steer and Brown1996) is a 21-item self-report measure of depressive symptomatology that is widely used in research and clinical practice. Items are scored on a four-point Likert scale and summed to create a total score, with higher scores reflecting greater levels of overall depression (BDI-II; Beck et al. Reference Beck, Steer and Brown1996). A large body of research suggests that the BDI-II scores are reliable and valid indicators of depression in both clinical and non-clinical populations (for a review, see Wang & Gorenstein, Reference Wang and Gorenstein2013).The BDI-II was originally designed to align with DSM-IV (American Psychiatric Association, 1994) diagnostic criteria, however, recent research suggests that the BDI-II may tap general depression/distress across the internalising spectrum of disorders, for example anxiety, phobias (Subica et al. Reference Subica, Fowler, Elhai, Frueh, Sharp and Kelly2014).
A clear understanding of the factor structure of a psychometric measure is crucial for accurate scoring and interpretation. The factor structure of the BDI-II, however, remains debated. Although ostensibly a measure of a single latent entity (i.e. depression), factor analytic studies suggest that the BDI-II taps multiple domains of depression. Two (Dozois et al. Reference Dozois, Dobson and Ahnberg1998; Whisman et al. Reference Whisman, Perez and Ramel2000; Arnau et al. Reference Arnau, Meagher, Norris and Bramson2001; Storch et al. Reference Storch, Roberti and Roth2004; Ghassemzadeh et al. Reference Ghassemzadeh, Mojtabai, Karamghadiri and Ebrahimkhani2005) and three (Osman et al. Reference Osman, Downs, Barrios, Kopper, Gutierrez and Chiros1997; Shafer, Reference Shafer2006; Vanheule et al. Reference Vanheule, Desmet, Groenvynck, Rosseel and Fontaine2008; Corbière et al. Reference Corbière, Bonneville-Roussy, Franche, Coutu, Choiniere, Durand and Boulanger2011) correlated-factor solutions have been supported in various samples. The identified factors have generally corresponded to three dimensions; cognitive, somatic and affective.
The apparent multidimensionality of the BDI-II raises more issues than simply reaching a consensus on the optimal number of underlying factors. Indeed, the BDI-II faces the same issue as many psychometric measures with clustered groups of items; how can a measure be deemed to reflect a single overall latent entity, and yet concurrently reflect multiple sub-factors of the same latent entity? Put more simply, the identification of multiple correlated sub-factors raises the question of whether the measure is capturing a single latent factor, or a number of related yet ultimately distinct factors (Reise et al. Reference Reise, Morizot and Hays2007, Reference Reise, Moore and Haviland2010). Such questions have practical implications with regards to scoring; should psychometric measures be treated as unidimensional (through the use of total scores) or multidimensional (through the use of subscale scores)? Both cases present problems. In the first case (total scores), it could be argued that a measure is not truly unidimensional if subsets of items correlate highly enough to manifest as interpretable sub-factors (Brouwer et al. Reference Brouwer, Meijer and Zevalkink2013). In the second case (subscale scores), the validity of a subscale could be questioned if the items share significant variance with additional items in separate subscales due to an overarching latent factor (Brouwer et al. Reference Brouwer, Meijer and Zevalkink2013).
Confirmatory bifactor modelling (CBM) is an increasingly popular means of addressing issues of dimensionality in psychometric measures (Reise, Reference Reise2012). CBM is a form of factor analysis in which each individual item has a non-zero loading on a general factor that reflects the overall latent construct that is being measured (e.g. depression). In addition, each item also has a non-zero loading on one specific factor, reflecting a sub-dimension of the latent construct (e.g. cognitive, somatic). The correlations between the general factor and specific factors are fixed to zero. The specific factors explain common variance amongst items that is not accounted for by the general factor (Reise et al. Reference Reise, Morizot and Hays2007). CBM is comparable to second-order modelling in that both methods acknowledge the multidimensionality of a construct while simultaneously retaining the idea that a single construct is being measured (Reise et al. Reference Reise, Moore and Haviland2010). With second-order modelling, the latent trait represents the variance shared by a number of more basic traits. CBM differs in that the general and specific factors exist at the same theoretical level and compete to explain item variance, allowing researchers to directly test whether specific dimensions explain a non-redundant amount of variance amongst items that is not accounted for by the general factor (Reise et al. Reference Reise, Morizot and Hays2007, Reference Reise, Moore and Haviland2010).
Studies of the BDI-II which have employed CBM have generally identified a best fitting solution consisting of a general depression factor (G), and two orthogonal factors of cognitive–affective (C–A) and somatic (S) (Ward, Reference Ward2006; Quilty et al. Reference Quilty, Zhang and Bagby2010; Brouwer et al. Reference Brouwer, Meijer and Zevalkink2013; Subica et al. Reference Subica, Fowler, Elhai, Frueh, Sharp and Kelly2014). In these previous studies, the general depression factor has accounted for the majority of variance in item scores (Ward, Reference Ward2006; Osman et al. Reference Osman, Barrios, Gutierrez, Williams and Bailey2008; Quilty et al. Reference Quilty, Zhang and Bagby2010; Brouwer et al. Reference Brouwer, Meijer and Zevalkink2013; Subica et al. Reference Subica, Fowler, Elhai, Frueh, Sharp and Kelly2014). As such, it has been suggested that the relatively minor amount of variance explained by the specific factors does not warrant the creation of subscales (Ward, Reference Ward2006; Osman et al. Reference Osman, Barrios, Gutierrez, Williams and Bailey2008; Quilty et al. Reference Quilty, Zhang and Bagby2010; Brouwer et al. Reference Brouwer, Meijer and Zevalkink2013; Subica et al. Reference Subica, Fowler, Elhai, Frueh, Sharp and Kelly2014).
There has, however, not been universal support for the CBM approach. Vanheule et al. (Reference Vanheule, Desmet, Groenvynck, Rosseel and Fontaine2008) examined the factor structure of the BDI-II in a sample of clinical (n=404) and non-clinical (n=695) adults, testing a range of competing non-hierarchical multidimensional models and bifactor models. They concluded that a multidimensional model consisting of cognitive, affective and somatic factors provided superior fit to previously identified bifactor models, for both clinical and non-clinical samples. Furthermore, Huang & Chen (Reference Huang and Chen2015) conducted a meta-analysis in which they compared a wide range of previously identified factor solutions. They dismissed the use of bifactor models as the covariance between the general depression factor and one of the specific factors was not empirically identified. It must be noted, however, that the correct specification of a bifactor model requires that the covariances between general and specific factors be fixed to zero (Reise et al. Reference Reise, Morizot and Hays2007, Reference Reise, Moore and Haviland2010). As such, it appears that the model in the above mentioned meta-analysis was not identified due to specification error, rather than the suitability of the bifactor model. This demonstrates that further research into the latent structure of the BDI-II, specifically comparisons of bifactor and non-hierarchical multidimensional models, is clearly warranted.
Furthermore, while there has been renewed interest in CBM in recent years, there are no firm guidelines as to how this modelling approach should be conducted, reported, and/or interpreted. In an attempt to address this, Rodriguez et al. (Reference Rodriguez, Reise and Haviland2016) compiled a list of suggested bifactor statistical indices which were previously rarely reported. Examples include the ‘explained common variance’ (ECV; Ten Berge & Sočan, Reference Ten Berge and Sočan2004; Reise et al. Reference Reise, Bonifay and Haviland2013), ‘omega hierarchical’ (ω H ; McDonald, Reference McDonald1999) and ‘percentage of uncontaminated correlations’ (PUC; Bonifay et al. Reference Bonifay, Reise, Scheines and Meijer2015). All three of these indices can be help clarify whether a psychometric measure is better conceptualised as uni- or multidimensional by examining the ratios of variance explained by common and specific factors (Rodriguez et al. Reference Rodriguez, Reise and Haviland2016). To our knowledge, only three previous bifactor studies have reported indices such as these; in two cases (Subica et al. Reference Subica, Fowler, Elhai, Frueh, Sharp and Kelly2014; de Miranda Azevedo et al. Reference de Miranda Azevedo, Roest, Carney, Denollet, Freedland, Grace, Hoseini, Lane, Parakh, Pilote and De Jonge2016) only the ECV was reported, whereas ω H was reported in only one study (Brouwer et al. Reference Brouwer, Meijer and Zevalkink2013). Rodriguez et al. (Reference Rodriguez, Reise and Haviland2016) argue that recommendations regarding the dimensionality of a scale should be made only after considering multiple bifactor indices together.
Interpretations of the BDI-II are further complicated by questions regarding the validity of the affective subscale. Indeed, it has yet to be firmly established whether the affective items of the BDI-II constitute a unique factor (Osman et al. Reference Osman, Downs, Barrios, Kopper, Gutierrez and Chiros1997; Vanheule et al. Reference Vanheule, Desmet, Groenvynck, Rosseel and Fontaine2008), or whether the affective element should be subsumed by the somatic factor (Steer et al. Reference Steer, Ball and Ranieri1999; Arnau et al. Reference Arnau, Meagher, Norris and Bramson2001) or the cognitive factor (Dozois et al. Reference Dozois, Dobson and Ahnberg1998; Whisman et al. Reference Whisman, Perez and Ramel2000). Bifactor modelling offers a means of directly testing whether the affective dimension constitutes a unique factor, yet previous studies employing CBM have largely focussed on factor solutions with only cognitive and somatic grouping factors (Ward, Reference Ward2006; Quilty et al. Reference Quilty, Zhang and Bagby2010; Subica et al. Reference Subica, Fowler, Elhai, Frueh, Sharp and Kelly2014). Indeed, misspecification of the grouping factors in CBM could lead to overestimation of the relative importance of the general factor (Murray & Johnson, Reference Murray and Johnson2013; Morgan et al. Reference Morgan, Hodge, Wells and Watkins2015). As such, further research regarding the validity of an affective grouping factor is necessary.
The present study aimed to address the limitations of previous studies by testing the most comprehensive range of competing factor models of the BDI-II to date. Based on previous work, it was predicted that bifactor models comprised of general and specific factors would provide superior fit to traditional non-hierarchical multidimensional models (Brouwer et al. Reference Brouwer, Meijer and Zevalkink2013; Subica et al. Reference Subica, Fowler, Elhai, Frueh, Sharp and Kelly2014; de Miranda Azevedo et al. Reference de Miranda Azevedo, Roest, Carney, Denollet, Freedland, Grace, Hoseini, Lane, Parakh, Pilote and De Jonge2016). No hypotheses regarding the optimal number of CBM specific factors were made a priori. Furthermore, this study aimed to examine whether the BDI-II can be considered a uni- or multidimensional scale by comparing the performance of common and specific factors on a range of newly developed statistical indices (Rodriguez et al. Reference Rodriguez, Reise and Haviland2016), and examining whether the general and specific scales demonstrated any unique predictive specificity. On the basis of previous findings (Brouwer et al. Reference Brouwer, Meijer and Zevalkink2013; Subica et al. Reference Subica, Fowler, Elhai, Frueh, Sharp and Kelly2014; de Miranda Azevedo et al. Reference de Miranda Azevedo, Roest, Carney, Denollet, Freedland, Grace, Hoseini, Lane, Parakh, Pilote and De Jonge2016), it was predicted that the BDI-II would reflect a unidimensional scale (i.e. the general factor will account for the vast majority of shared variance).
Method
Participants
Participants (n=370; 63.5% female) were recruited from the liaison psychiatry services (including those seen in the emergency departments) at three Dublin hospitals. The mean age of participants was 43.8 years (s.d.=14.2). Participants were diagnosed by psychiatrists as having either ICD-10 (World Health Organisation, 1992) defined depressive episode (DE, n=185) or adjustment disorder (AD, n=185). In total, 39% of participants were married, 78.2% reported that they lived with at least one other person and 54% of the sample were in active employment. The majority of the sample (85.6%) listed Ireland as their place of birth. Individuals who met the following criteria were excluded from the present study; a primary diagnosis of substance use disorder, cognitive impairment, those incapable of giving informed consent, those who were under the age of 18 years, presenting with psychotic symptoms, those who were not proficient in the use of the English language.
Procedure
The BDI-II was administered to participants at two time-points (recruitment and 6-month follow-up) by a researcher blind to the clinical diagnosis. For the present study, analysis was conducted on the cross-sectional data obtained from the first interview.
Ethics
Before commencement, this study was approved by the Research Ethics Committees of the three Dublin hospitals involved. This study was conducted in accordance with the Declaration of Helsinki (World Medical Association, 2008). All participants provided written informed consent.
Statistical analysis
Confirmatory factor analysis (CFA) and CBM were used to test 15 competing models. Seven models were non-hierarchical multidimensional models. Seven models were CBM models (specific factors identical to the multidimensional models, with each individual item also loading onto a general depression factor that was uncorrelated with specific factors). A unidimensional model was also tested. The model specifications are presented in Table 1.
Table 1 Specifications for alternative Beck Depression Inventory-II factor models
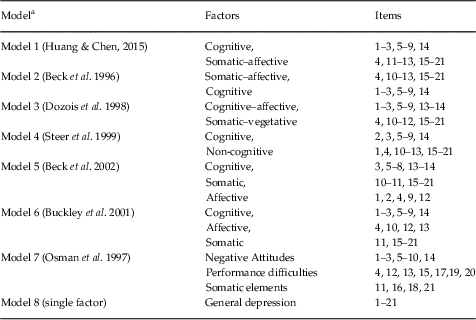
a Each model fit under two conditions: (i) as a traditional confirmatory factor model and (ii) as a confirmatory bifactor model in which each of the 21 items also had a non-zero loading on a general depression factor.
Models were specified and estimated using Mplus 6.0 (Muthén & Muthén, Reference Muthén and Muthén2010), using the robust maximum likelihood estimation. Goodness of fit was assessed using the following measures of absolute fit; the χ 2 statistic, the comparative fit index (CFI; Bentler, Reference Bentler1990), the Tucker–Lewis Index (TLI; Tucker & Lewis, Reference Tucker and Lewis1973), the root mean square error of approximation (RMSEA; Steiger, Reference Steiger1990) and the standardised root mean square residual (SRMR; Hu & Bentler, Reference Hu and Bentler1998). Values greater than 0.90 for the CFI and TLI reflect acceptable model fit (Barrett, Reference Barrett2007). For the RMSEA and SRMR, values of less than 0.05 indicate close fit and values up to 0.08 indicate reasonable errors of approximation (Hu & Bentler, Reference Hu and Bentler1999). The comparative fit of models was assessed using the Bayesian information criteria (BIC; Schwarz, Reference Schwarz1978). The BIC balances model fit with parsimony to determine the optimum model, with the model with the lowest overall BIC value reflecting the best fit (Schwarz, Reference Schwarz1978).
Comparing general and specific factors
In order to examine whether the BDI should be scored unidimensionally, or whether there is utility in retaining subscale scores, general and specific factors were compared using the following three bifactor strength indices; ECV, ω H and PUC. The ECV is used to test the unidimensionality of a scale by dividing the variance explained by the general factor by the variance explained by the general and specific factors combined (Reise et al. Reference Reise, Moore and Haviland2010). As such, ECV values range from 0 to 1, with values closer to 1 suggesting greater unidimensionality. Guidelines vary as to what ECV value indicates unidimensional scoring should be used, ranging from 0.6 (Reise et al. Reference Reise, Scheines, Widaman and Haviland2013) to 0.85 (Stucky & Edelen, Reference Stucky and Edelen2014). Rodriguez et al. (Reference Rodriguez, Reise and Haviland2016) suggest that, although the ECV is a useful tool, it should not be used in isolation, and it is important to evaluate the ECV in the context of the overall data structure. Indeed, fitting a unidimensional model to multidimensional data may result in biased structural coefficient estimates (Reise et al. Reference Reise, Bonifay and Haviland2013). The PUC is calculated by dividing the number of correlations between items from different specific factors by the total number of item correlations (Reise et al. Reference Reise, Scheines, Widaman and Haviland2013). As such, the PUC will be large in cases where there are many specific factors with a small number of items per factor, and small when there are a limited number of specific factors and many items per factor (Rodriguez et al. Reference Rodriguez, Reise and Haviland2016). The structural coefficient bias attributable to the ECV is moderated by the PUC, with high PUC values (>0.8) suggesting that the ECV is less likely to be obscured by bias (Reise et al. Reference Reise, Bonifay and Haviland2013).
ω H determines the proportion of the total score variance that is attributable to the general factor, after controlling for the specific factors by dividing the squared sum of the factor loadings of the general factor by the estimated variance of the total scores (Rodriguez et al. Reference Rodriguez, Reise and Haviland2016). A similar approach can be used to determine the amount of variance attributable to a specific subscale after controlling for the general factor (ω HS ). High values of ω H (>0.8) and low values of ω HS suggest that the general factor is the dominant source of variation in scores (Rodriguez et al. Reference Rodriguez, Reise and Haviland2016). Although there are no universally adopted cut-off points for the above indices, Reise et al. (Reference Reise, Bonifay and Haviland2013) tentatively suggest that values of ECV>0.6 (even in cases where the PUC is <0.8), and ω H >0.7, that a scale may be considered ‘unidimensional enough’ to warrant the use of a total score.
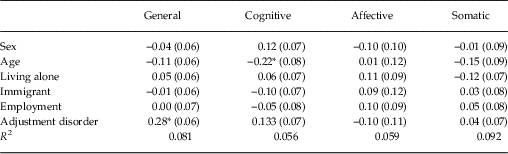
Finally, to further examine the utility of the BDI-II subscales, both the general and specific factors from the best fitting model were regressed on a series of background variables in order to examine whether any of the specific factors demonstrated discriminant validity. The background variables included were sex, age, living situation (living with others v. alone), immigration status (non-immigrant v. immigrant), employment status (employed v. unemployed) and clinical diagnosis (AD v. DE).
Results
Descriptive statistics
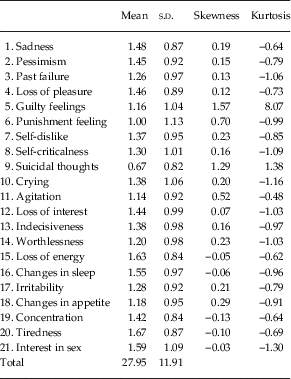
Descriptive statistics for the BDI-II item and total scores are presented in Table 2.
Table 2 Descriptive statistics for Beck Depression Inventory-II items and total scale scores

Model comparisons
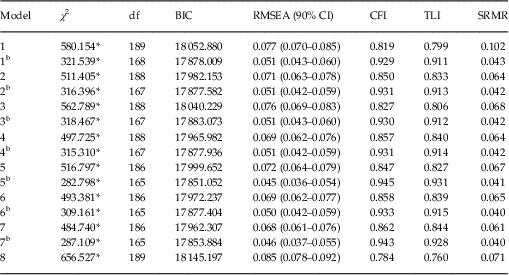
Absolute and comparative fit indices for the competing models are presented in Table 3. The unidimensional model (model 8) was deemed unacceptable, as it did not meet the minimum cut-off points, and the BIC value was relatively high. In general, models with three specific factors (models 5–7) provided better fit than models with two specific factors (models 1–4).
Table 3 Fit statistics for competing factor models of the Beck Depression Inventory-II

BIC, Bayesian information criteria; RMSEA, root mean square error of approximation; CFI, comparative fit index; TLI, Tucker–Lewis Index; SRMR, standardised root mean square residual.
Superscript ‘b’ indicates bifactor model with specific factors mirroring those in corresponding multidimensional CFA model.
*p<0.05.
Multidimensional models provided a generally poor approximation of the data, with CFI and TLI values below the recommended cut-off points. CBM models all had good-to-excellent fit. Overall, the bifactor variation of model 5 was judged to fit the data best (Beck et al. Reference Beck, Steer, Brown and Van der Does2002). This model consisted of a general depression factor and three correlated specific factors: cognitive, somatic and affective. Following the inclusion of the general factor, only one correlation between specific factors (affective and cognitive) remained statistically significant (r=0.26). This model demonstrated good absolute fit, and also had the lowest BIC. There was little difference in the BIC values for model 5b and 7b, with a difference of at least 10 generally considered to reflect a significant improvement of fit (Raftery, Reference Raftery1995). Models 5b and 7b, however, did perform significantly better than all other models. Model 5b was preferred not only due to its modestly better performance in BIC, but also guided by previous studies; for example, in the meta-analysis conducted by Huang & Chen (Reference Huang and Chen2015) it was found that correlated traits models consisting of cognitive, affective and somatic factors (model 5) outperformed models with negative attitude, performance difficulty and somatic factors (model 7).
Standardised factor loadings for the best fitting model are presented in Table 4. All items loaded positively onto the general depression factor, with loadings ranging from moderate to strong. A number of items failed to load onto the specific factors. Item 13 (‘Indecisiveness’) failed to load on the cognitive factor. Items 4 (‘loss of pleasure’) and 12 (‘loss of interest’) failed to load onto the affective factor. Only three items loaded onto the somatic factor; item 15 (‘loss of energy’), item 20 (‘tiredness’) and item 21 (‘interest in sex’). Significant loadings on the cognitive and somatic factors were generally similar to or higher than their corresponding loadings on the general factor. Factor loadings were mostly higher on the general factor compared with the affective factor. Although the specific factors were allowed to correlate, only one statistically significant correlation was identified; a small but positive correlation between the cognitive and affective factors (r=0.26, p<0.05).
Table 4 Standardised factor loadings and bifactor indices for best fitting model of Beck Depression Inventory-II
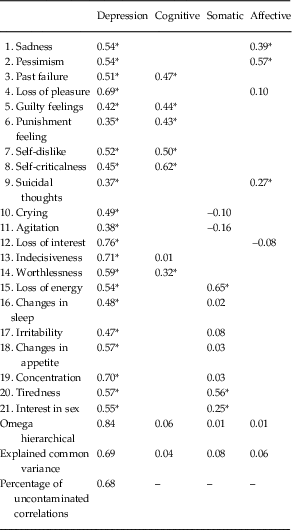
*p<0.05.
Bifactor indices
The various bifactor indices are presented in Table 4. The ECV value was relatively high for the general factor (accounting for 69% of explained variance) compared with the specific factors (accounting for between 4% and 8% of variance). A similar pattern emerged for the ω H indices. Both indices suggest that the vast majority of variance was accounted for by the general factor. The combined ECV, PUC and ω H indices suggest that the BDI-II can be considered a unidimensional scale (Reise et al. Reference Reise, Bonifay and Haviland2013).
Discriminant validity
Results from the regression model are presented in Table 5. The model fit the data adequately (χ 2=469.61, df=267, p<0.001, CFI=0.912, TLI=0.890, RMSEA=0.048).
Table 5 Standardised regression coefficients (B) of covariates on Beck Depression Inventory-II common and specific factors
s.e. in parentheses.
*p<0.05.
Little specificity was observed, with only two statistically significant effects across both general and specific factors. Increased age was associated with lower scores on the cognitive dimension. Those with a clinical diagnosis of DE (compared with AD) scored significantly higher in the general dimension. Both effects were minor-to-moderate.
Discussion
A clear understanding of the latent structure of a psychometric measure is important both in terms of the interpretation of the measure and accurate scoring. The present study sought to examine the factor structure of the BDI-II in a clinical outpatient sample. Specifically, it was predicted that bifactor models would provide superior fit to non-hierarchical multidimensional models. Results from the CFA and CBM indicated that bifactor models outperformed their multidimensional counterparts regardless of the number of specific factors included in the model. This is in line with a number of recent studies which have supported a latent bifactor structure to the BDI-II (Ward, Reference Ward2006; Osman et al. Reference Osman, Barrios, Gutierrez, Williams and Bailey2008; Quilty et al. Reference Quilty, Zhang and Bagby2010; Brouwer et al. Reference Brouwer, Meijer and Zevalkink2013; Subica et al. Reference Subica, Fowler, Elhai, Frueh, Sharp and Kelly2014). Such findings appear at odds with a recent meta-analysis which failed to consider bifactor models of the BDI-II due to factor over-extraction (Huang & Chen, Reference Huang and Chen2015). The finding of a general depression factor suggests that, although item content is heterogeneous, the BDI-II is at its core a measure of overall depression severity. The present study adds to the existing literature as the breadth of factor models tested (e.g. models with a unique affective scale) likely minimised misspecification, allowing for a more accurate examination of the variance accounted for by the general depression factor.
With regards to the scoring of the BDI-II, all items loaded strongly onto a general depression factor, and a series of bifactor strength indices (Reise et al. Reference Reise, Scheines, Widaman and Haviland2013) suggested that the general factor accounted for the vast majority of variance shared amongst the items. This suggests that, in practice, items can be summed to form a total score, with higher totals reflecting a greater level of depression severity (Reise, 2010). Similar recommendations have been made in previous bifactor studies of the BDI-II (Ward, Reference Ward2006; Osman et al. Reference Osman, Barrios, Gutierrez, Williams and Bailey2008; Quilty et al. Reference Quilty, Zhang and Bagby2010; Brouwer et al. Reference Brouwer, Meijer and Zevalkink2013; Subica et al. Reference Subica, Fowler, Elhai, Frueh, Sharp and Kelly2014). As such, the use of unidimensional subscales alone (e.g. Vanheule et al. Reference Vanheule, Desmet, Groenvynck, Rosseel and Fontaine2008) cannot be recommended. Indeed, the validity of such scales can be questioned due to the large amounts variance shared between items across subscales that is attributable to the presence of the underlying general factor.
Although the present study emphasises the overall importance of the general depression factor, it does not completely invalidate the use of subscales in all contexts. Although the majority of variance was accounted for by the general depression factor, three specific factors (cognitive, affective, somatic) did explain a non-redundant amount of variance. Research indicates that different sub-factors of depression respond differentially to treatment (Mallinckrodt et al. Reference Mallinckrodt, Goldstein, Detke, Lu, Watkin and Tran2003; Ruhé et al. Reference Ruhé, Dekker, Peen, Holman and De Jonghe2005; Mallinckrodt et al. Reference Mallinckrodt, Prakash, Houston, Swindle, Detke and Fava2007). As such, while the validity of the use of subscales in isolation may be questioned, they could be considered by clinicians in conjunction with overall scores in formulation/treatment decisions. Such a strategy is in line with the original scoring instructions provided by Beck et al. (Reference Beck, Steer and Brown1996) who advocate the use of a total score, yet recommend clinicians pay attention to specific item content. Furthermore, the present findings diverge slightly from other studies which have suggested that the affective factor should be subsumed by either the cognitive (Dozois et al. Reference Dozois, Dobson and Ahnberg1998) or somatic factors (Huang & Chen, Reference Huang and Chen2015). The present findings suggest that the affective items constitute a distinct factor, however this factor explained the least amount of variance overall. As such the use of an affective subscale, like the cognitive and somatic scales, should only be considered in conjunction with an individual’s overall score.
Furthermore, while CBM has become increasingly popular in social and behavioural sciences and offers an intuitive means of testing the uni/multidimensionality of scale items, this method has received some criticism. It has been suggested bifactor models may be less sensitive to elements of misspecification (e.g. substantive cross-loadings or residual correlations that are constrained to zero) than multidimensional or higher order factor models, as bifactor models include more free parameters and a general factor that loads directly onto all observed items (Murray & Johnson, Reference Murray and Johnson2013; Morgan et al. Reference Morgan, Hodge, Wells and Watkins2015). This may result in an element of bias in favour of CBM models when compared with traditional CFA models. To examine the magnitude of such bias, Brouwer et al. (Reference Brouwer, Meijer and Zevalkink2013) conducted an exploratory bifactor analysis of the BDI-II. They concluded that while cross-loadings biased the factor loadings in favour of the general factor, this effect was minimal and not enough to cause them to question the results of their confirmatory models. Despite this finding, further research into bias associated with CBM would be beneficial.
Strengths and limitations
The present study had a number of strengths. First, it tested the most comprehensive range of competing factor models of the BDI-II to date. Second, it employed a range of bifactor strength indices that have rarely been employed in previous studies, and rarely considered in conjunction with each other. With regards to weaknesses, the sample was modest in size. Second, while a number of background variables were included to examine the discriminant validity of general and specific factors, no outcome variables were included. Future studies may wish to include a broader range of antecedent and outcome variables in order to conduct a more thorough examination of discriminant validity. Third, there was little to separate models 5b and 7b in terms of fit, therefore model 5b was preferred on theoretical grounds. It may be that model 7b is a viable alternative, however the bifactor nature of both models highlights the importance of viewing the BDI-II as primarily a unidimensional scale. Finally, the present study utilised a clinical sample of patients with either AD or DE. Further replication in samples with different diagnoses may be required before the findings can be generalised, however research suggests that the performance of BDI-II is comparable across the internalising spectrum of disorders (Subica et al. Reference Subica, Fowler, Elhai, Frueh, Sharp and Kelly2014). Further replication in general population samples may also aid the generalisability of the findings.
Conclusion
In conclusion, the present study tested the most comprehensive range of competing factor models of the BDI-II to date. Results suggested that a bifactor model consisting of a general factor (depression) and three specific factors (cognitive, affective and somatic) provided the best fit in a clinical sample of outpatients diagnosed with DE and AD. Consistently strong factor loadings on the general depression factor, and the performance of this factor on various strength indices, suggest that the BDI-II captures overall depressive severity. This supports the validity of a total score. While it is not recommended that they are used in isolation, scores on the cognitive, affective and somatic dimensions may be useful in clinical assessment/treatment decision making when used in conjunction with scores on the overall dimension.
Financial Support
This research received no specific grant from any funding agency, commercial or not-for-profit sectors.
Conflicts of Interest
The authors declare that there are no conflicts of interest.
Ethical Standards
The authors assert that all procedures contributing to this work comply with the ethical standards of the relevant national and institutional committee on human experimentation with the Helsinki Declaration of 1975, as revised in 2008.