

Management Implications
Callery pear (Pyrus calleryana), which has been used in landscape plantings for decades, is now being recognized as important woody invader in much of the eastern United States However, little is known now about its impact on native forest stands. Here, we developed allometric equations to predict aboveground biomass components, including wood, branches, bark, leaves, and fruit, as well as total aboveground biomass, from diameter at stump height (dsh; 25 cm) measurements; dsh often works better than diameter at breast height (dbh; 1.37 m) with this species, because Pyrus stems often fork below breast height. However, there is a strong relationship between dsh and dbh, so these allometric equations can used with dbh measurements. Most biomass equations were log-log regressions, and they were corrected for bias using the uniform minimum variance unbiased (UMVU) estimator. However, this estimator does not give a ready-to-use equation; the original data must be used along with collected data in an R routine. Thus, we also report equations corrected with the smearing estimate, which, while not as good as the UMVU estimator, performs better than most commonly used estimators. The allometric equations will allow managers to estimate biomass of stands dominated by P. calleryana. Diameter distributions from 23 wild-grown stands in the northern Kentucky/southwestern Ohio region were fit to two-factor Weibull distributions, which indicated a species that is either shade-intolerant or midtolerant, which was also indicated by relatively low stand density indices. For managers, this suggests that control efforts for Callery pear should focus on disturbed or open areas, as our results suggest that it will not become an important invader in closed-canopy forests.
Introduction
Callery pear (Pyrus calleryana Decne.; nomenclature follows USDA-NRCS 2020) is a small tree from China; its seed was originally collected in the early 20th century in response to an outbreak of fire blight that was affecting common pear (Pyrus communis L.) orchards in the western United States (Culley Reference Culley2017; Vincent Reference Vincent2005). By midcentury, its potential as an ornamental tree was recognized, due to its spring flowers and fall foliage color, and ‘Bradford’, the first horticultural cultivar, was released in 1960 (Culley Reference Culley2017; Vincent Reference Vincent2005). Pyrus calleryana is self-incompatible, meaning it cannot produce viable seed from self-pollination. Cultivars are propagated by cuttings, and because the resulting trees are clones, they cannot reproduce with one another (Culley Reference Culley2017). Thus, when the Bradford cultivar was introduced, it was not expected to reproduce and spread to the wild. However, problems with this cultivar, particularly its tendency to split (Culley Reference Culley2017; Gilman and Watson Reference Gilman and Watson1994), led to the development of several other cultivars. Many of these cultivars were planted next to existing plantings of Bradford and other cultivars. In addition, the rootstocks used for all cultivars can sometimes sprout and flower. This has led to the production of viable seed, and as the fruit is attractive to birds, seeds are readily spread (Culley Reference Culley2017; Culley and Hardiman Reference Culley and Hardiman2009; Culley et al. Reference Culley, Hardiman and Hawks2011; Hardiman and Culley Reference Hardiman and Culley2010).
This species is now reported to be invasive in 33 states (EDDMapS 2020; USDA-NRCS 2020). However, little is currently known about its ecology in its new range. Critical to understanding the impact of this species is its biomass relative to competing species, as this determines carbon pools and fluxes in invaded ecosystems. Allometric equations are often used to estimate biomass of trees and their components (Jenkins et al. Reference Jenkins, Chojnacky, Heath and Birdsey2004), because direct measurements are destructive, and even when this is acceptable, the large sizes of trees make measurements difficult and time-consuming. Most allometric equations use an easy and nondestructive measurement, typically diameter at breast height (dbh), to estimate biomass. The allometric equations are developed by destructively sampling a number of trees, usually separating them into components (branches, leaves, etc.) and weighing the components. These weights are then regressed against dbh, usually in the form: log(component) = β0 + β1log(dbh) (Jenkins et al. Reference Jenkins, Chojnacky, Heath and Birdsey2004). Log-log allometric equations are well known to produce biased predictions. Several correction estimators have been suggested for trees, including the restricted maximum likelihood (REML) (Baskerville Reference Baskerville1972) and ratio (Snowdon Reference Snowdon1991) estimators. Clifford et al. (Reference Clifford, Cressie, England, Roxburgh and Paul2013) tested a number of estimators and recommended using the uniform minimum variance unbiased (UMVU) estimator because of its exactness. However, this estimator is clumsy to apply, as its application requires the original data used to develop the allometric equations in addition to the prediction data set. The smearing estimator, first proposed by Duan (Reference Duan1983), has a positive bias but performs better than most other commonly used estimators (Clifford et al. Reference Clifford, Cressie, England, Roxburgh and Paul2013). Allometric equations for most tree species in North America have been developed (e.g., Jenkins et al. Reference Jenkins, Chojnacky, Heath and Birdsey2004), but none so far have been reported for P. calleryana.
For woody plants, stand age or diameter structure is a valuable source of information about their light requirements and stand history. Diameter is often used as a surrogate for age, as it is easier to measure. Stands that are initially established after major disturbance or invasion are by definition even-aged, and they usually have monotonically decreasing diameter distributions (Coomes and Allen Reference Coomes and Allen2007). Over time, for shade-intolerant or midtolerant species, the diameter distribution becomes positively skewed unimodal and then normal (e.g., Coomes and Allen Reference Coomes and Allen2007; Lorimer and Krug Reference Lorimer and Krug1983; Lorimer et al. Reference Lorimer, Dahir and Nordheim2001; Mohler et al. Reference Mohler, Marks and Sprugel1978), due to competition that shades out smaller individuals. The reverse-J distribution, that is, exponentially declining diameter distribution, has traditionally been used to indicate “balanced” uneven-aged shade-tolerant stands that are replacing themselves as larger, older individuals die (Oliver and Larson Reference Oliver and Larson1996; Smith et al. Reference Smith, Larson, Kelty and Ashton1997), although other distributions, such as the rotated sigmoid distribution and power curves have also been suggested as indicative of shade tolerance (Leak Reference Leak2002; Rubin et al. Reference Rubin, Manion and Faber-Langendoen2006; Shimano Reference Shimano2000). Nonetheless, shade-tolerant species usually have some kind of monotonically decreasing diameter distribution, while midtolerant and intolerant species trend toward unimodal distributions over time. One mathematical function that is flexible enough to describe many kinds of diameter distributions is the two-factor Weibull distribution (Coomes and Allen Reference Coomes and Allen2007; Lorimer and Krug Reference Lorimer and Krug1983). It has the probability density function f(d) = (a/b) (d/b) a−1 exp[−(d/b) a ], where a and b are the shape and scale coefficients, respectively, and d is the stem diameter. For a < 1, the stand shows a steeply monotonically declining diameter distribution, while a = 1 indicates an exponentially declining distribution. The distribution is a positively skewed unimodal curve when 1 < a < 3.5, a normal curve when a = 3.5, and a negatively skewed unimodal curve when a > 3.5. The scale coefficient b is often correlated with mean diameter (Coomes and Allen Reference Coomes and Allen2007).
The goals of the current study were twofold: (1) to develop allometric equations for estimating the biomass of P. calleryana aboveground components in stands in which it dominates and (2) to describe stand diameter structures of P. calleryana for forest stands in the Cincinnati, OH, region to assess its shade tolerance, as that is necessary to determine whether it will invade intact forests or be restricted to open and disturbed areas.
Materials and Methods
Allometry
In summer 2014, wild-grown trees on the campus of Northern Kentucky University in Highland Heights, KY (39.04°N, 84.47°W), 13 km south of Cincinnati, OH, were harvested. For each tree, both diameter at stump height (dsh; 25 cm from ground level) and diameter at breast height (dbh; 1.37 m) were measured. Measurements of dsh were used for allometric equations in this study, as these trees often fork below breast height. Initially, eight trees were selected, with a 2.8- to 19.3-cm dsh range. Sampling techniques followed the methods described by Whittaker and Woodwell (Reference Whittaker and Woodwell1968). After dsh and dbh measurements were made, each tree was felled, and the bole was cut into 1-m sections. After top and bottom diameters were measured, a 10-cm section was cut from the base of each 1-m bole section. The total number of live and dead branches on each 1-m section was tallied. For each section, a representative live branch and dead branch were subjectively selected. Branch base diameters and lengths were then measured. Bole sections and representative branches, along with attached leaves and fruit, were returned to the lab and dried at 70 C. Bark was removed from the 10-cm bole sections. Wood and bark from the bole sections, branches, leaves, and fruit were then weighed, and these weights were then extrapolated to estimate the weights for the whole tree. An additional five trees, with dsh ranging from 0.1 to 1.4 cm, were also sampled in summer 2019. Because these trees were so small, total leaf and branch weights (no fruit was present on these trees) were measured. Bark from a bottom section of the bole, 2 to 5 cm depending on size, was removed, and bark density was calculated. Bark weight, based on both the volume calculated from thickness and internal and external thickness and density, for the whole bole was then calculated; bole and bark weight was determined by weighing, and bole weight was calculated by subtraction. Thus, a total of 13 trees, ranging from 0.1- to 19.3-cm dsh, were used to develop allometric equations.
In most cases, logarithms of each component’s weights and total weight regressed against logarithms of dsh resulted in good fits. For fruit and dbh, however, regressions of untransformed values against untransformed dsh achieved better results. The log-log allometric equations were corrected for bias using the UMVU estimator (Clifford et al. Reference Clifford, Cressie, England, Roxburgh and Paul2013). Because the UMVU estimator does not result in a ready-to-use equation, however, the log-log equations reported here are corrected with the smearing estimate (Duan Reference Duan1983). However, estimates of total biomass reported for surveyed stands in this study use the UMVU correction; R code for this estimator is given in Supplementary Appendix 1, while the data need to apply the UMVU estimator are included in Supplementary Appendix 2.
Stand Surveys
In 2016, a survey of stands in the Cincinnati area that were dominated by P. calleryana was conducted. The surveyed area included Hamilton County in Ohio, Campbell, Kenton, and Boone counties in Kentucky, and Dearborn County in Indiana (no suitable stands were found in Indiana). Twenty-three stands were located, including two for which data had been collected in a previous study (Boyce Reference Boyce2018; Figure 1). Most of these stands were in parks or other protected land or grew along roadsides. Thus, most were in places in the early stages of succession with high light levels. In each stand, transects were laid down. A 2-m by 5-m plot was located every 10 m, with the long axis centered on the transect. Plots used at Dodsworth Road and Daniel Drake Park were 4 m by 5 m. The dsh of all living stems was measured with calipers or diameter tape and recorded, along with species. The number of plots in each stand varied from 3 to 30, depending on both size of the stand and stem densities.
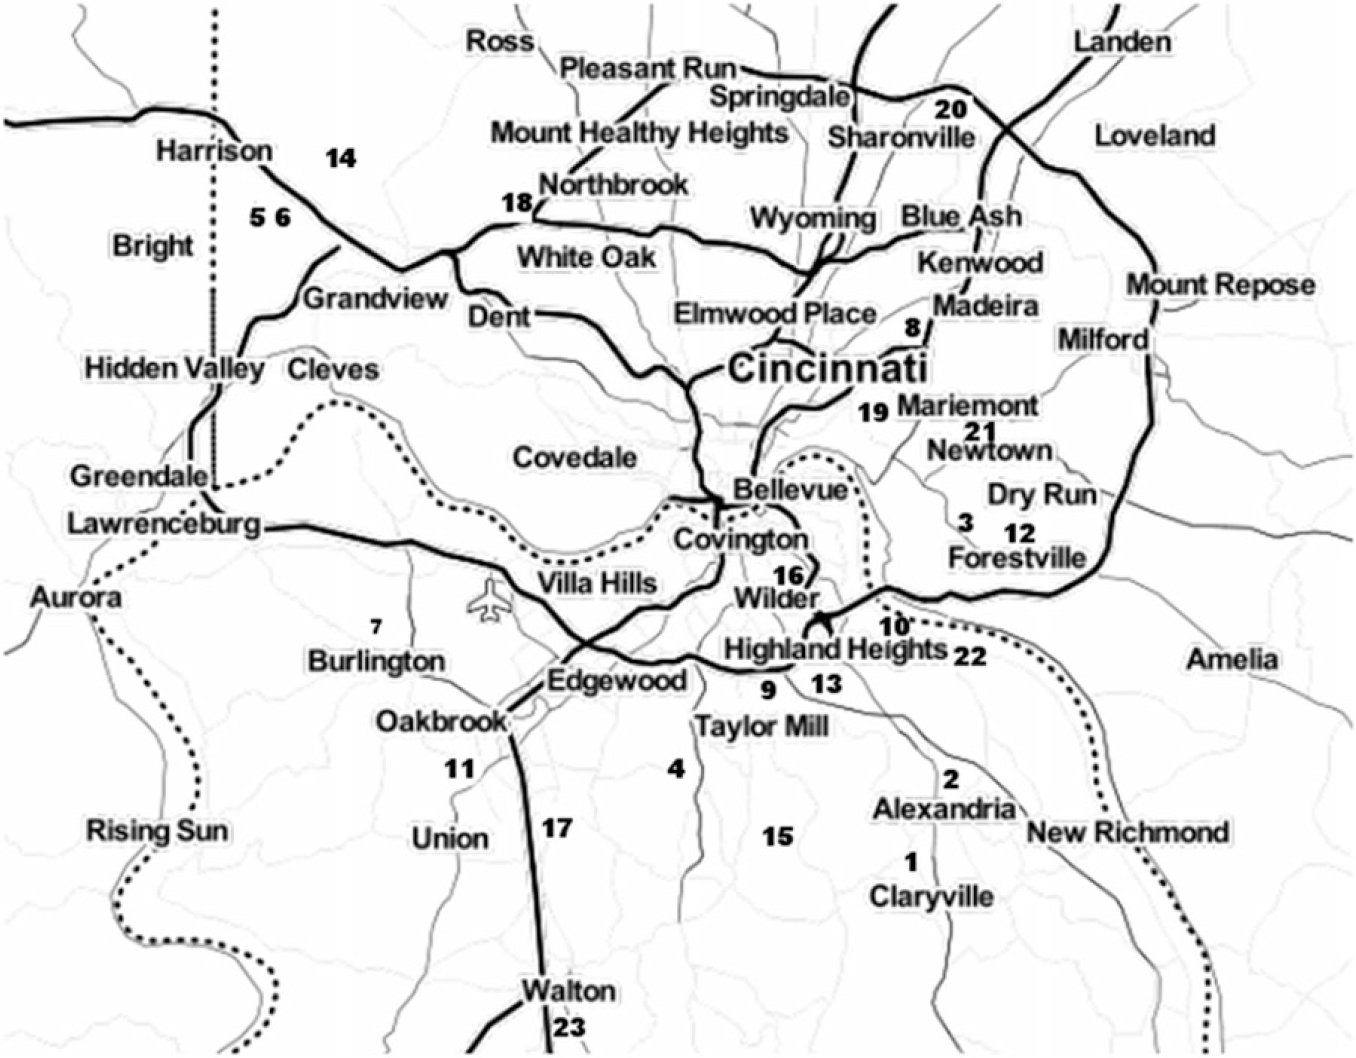
Figure 1. Map of approximate locations of surveyed Pyrus calleryana stands in the Cincinnati, Ohio, region. 1, Alexandria Tribute Park; 2, Alexandria US-27; 3, Berkshire Road; 4, Bullock Pen Road; 5, Campbell Lakes 1; 6, Campbell Lakes 2; 7, Conrad Road Extension; 8, Daniel Drake Park; 9, Decoursey Park; 10, Dodsworth Road; 11, Farmview Road; 12, Five Mile Road; 13, Johns Hill Road; 14, Miami-Whitewater Park; 15, Middleton Mills Park; 16, Moock Road; 17, Mt. Zion Road; 18, Newberry Preserve; 19, Redbank Road; 20, Sharon Woods Park; 21, Short Park; 22, St. Anne Convent; 23, Walton Community Park. Dotted line is the Ohio River, which is also the border between the state of Kentucky and the states of Ohio and Indiana; the border between Ohio and Indiana is marked by an alternating solid and dotted line. Solid lines are roads, and the Cincinnati/Northern Kentucky International Airport is marked with an airplane symbol. Map was produced with the Stamen Maps database in the package ggmap in the statistical program R (Kahle and Wickham Reference Kahle and Wickham2013).
For each stand, density and basal areas for P. calleryana and for all species combined were calculated. The importance value (IV; %) of P. calleryana in each stand was also computed as P. calleryana density/total density + P. calleryana basal area/total basal area and thus fell into the range 0% to 200% (Brower et al. Reference Brower, Zar and Von Ende1997). The metric stand density index (SDI), which is a measure of the number of trees of all species per unit area with the diameter of the tree of mean basal area (Burkhardt et al. Reference Burkhardt, Avery and Bullock2018), was calculated as SDI = density (ha−1) * (D/25.4)1.605, where D is the dbh of the tree (cm) of average basal area in the stand (Woodall et al. Reference Woodall, Miles and Vissage2005). This can be converted to SDIs in imperial units (i.e., trees/acre) by dividing by 2.47 (i.e., the number of acres per hectare). We also used the allometric equation shown in Figure 2 to convert dsh to dbh; when this fell below 0, we used a dbh of 0.1 cm. The dsh coefficient of variation (CV = standard deviation/mean) was determined to measure size distribution inequality. Gini coefficients are an alternative means of expressing size inequality (Rouvinen and Kuuluvainen Reference Rouvinen and Kuuluvainen2005), but as noted in other studies (e.g., Coomes and Allen Reference Coomes and Allen2007), they are often highly correlated with CV. That was true in this study as well (Spearman’s r = 0.88), and thus only CV was used. The allometric equations developed as described in the “Allometry” section were also used to estimate P. calleryana aboveground biomass.
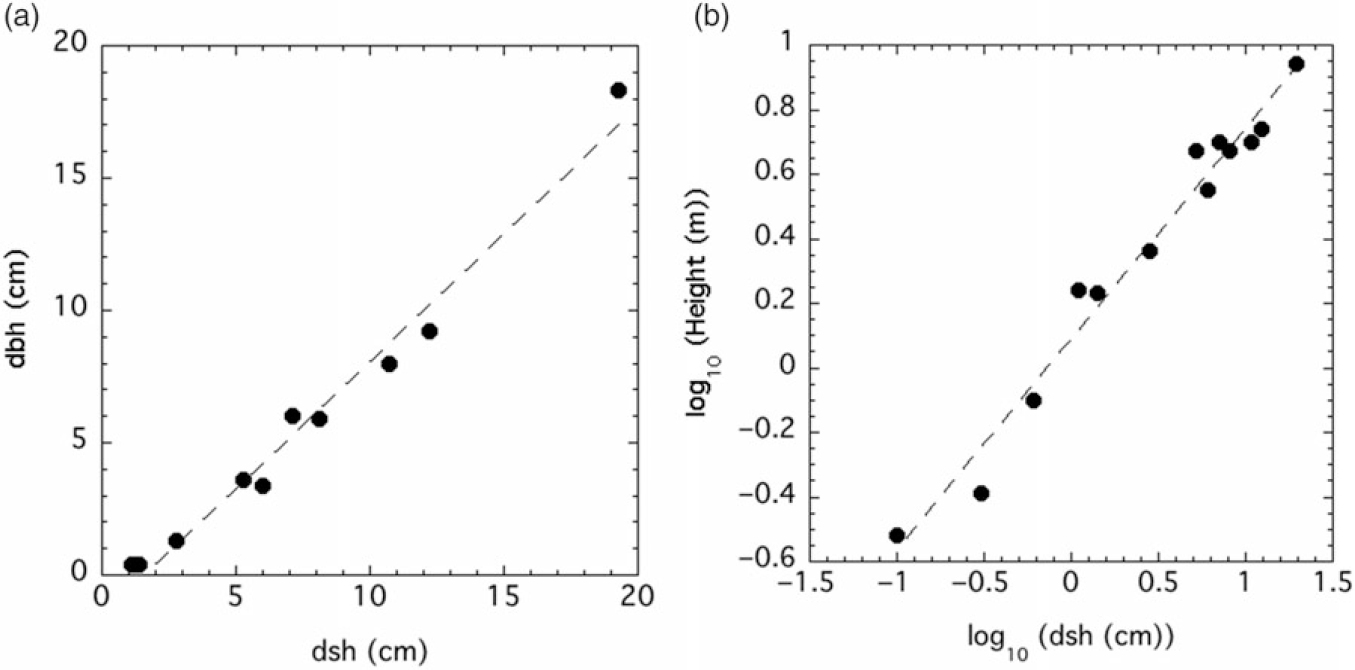
Figure 2. (A) Diameter at breast height (dbh) vs. diameter at stump height (dsh): dbh (cm) = −1.43476 + 0.9574*dsh (cm), r2 = 0.9786, P <0.0001. (B) height vs. dsh: ln(height (m)) = 0.08864 + 0.65309*ln(dsh (cm)), r2 = 0.97345, P <0.0001.
In each stand, individual P. calleryana were grouped into 0.5-cm dsh size classes. Two-factor Weibull distributions were fit to the size class distribution for each stand using the fitdistr function in the MASS library of R (R Core Team 2020). Bootstrapped 95% confidence intervals (CIs) of the shape coefficient a were estimated using the bootdist function in the fitdistrplus library of R.
Results and Discussion
Allometry
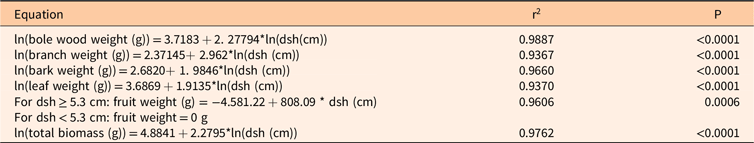
Allometric equations with the smearing correction for bole, branch, bark, leaf, fruit, and total weights versus dsh are shown in Table 1. In all cases for the uncorrected fits, r2 > 0.93. Trees with dsh < 5.3 cm did not have fruit and were not included in those regressions. Fruit values for the largest tree (dsh = 19.3 cm) were also not included in the regression. The linear relationships between dbh and both height and dsh were quite strong, with r2 > 0.97 in both cases (Figure 2).
Table 1. Allometric equations for bole, branch, bark, leaf, fruit, and total biomass. a

a Logarithmic equations are corrected with the smearing estimator (Duan Reference Duan1983). The r2 and P-values are for equations before correction.
The allometric relationships between dsh and P. calleryana biomass components were generally quite strong (Table 1). Exclusion of the fruit value for the largest tree, as well as values of zero for the smallest six trees, means that we are less confident in the equation for fruit biomass, and it should only be used when 5.3 cm ≤ dsh ≤ 12.2 cm. It is possible that fruit production is much more variable than other components, or it may be that there is an upper limit for fruit production at larger tree sizes. Despite this caveat, the regression for total biomass is quite strong, with r2 = 0.96 (Table 1). Caution should be used for estimations outside the dsh limits used in this study (0.1 to 19.3 cm). The strong relationship between dsh and dbh means that these equations can be applied to data sets with dbh measurements only, as dsh can be estimated from dbh with a high degree of confidence (Figure 2A).
Stand Surveys
Density, basal area, median diameter, and aboveground biomass (using the UVMU correction) of P. calleryana for each of the 23 stands surveyed are given in Table 2. Median density was high (11,000 ha−1), while median basal area was low (7.60 m2 ha−1). Median tree diameter was also small (0.9 cm). Median biomass calculated with the allometric equations shown in Figure 2 was 19.3 Mg ha−1. The P. calleryana IV ranged from 10.0% to 183.9%, with a median of 112.8%, showing P. calleryana was the most important woody plant in most of the sampled stands (Table 2). SDI ranged from 3 to 497, with a median of 43. SDI is generally higher for shade-tolerant species (Zeide Reference Zeide2004); for example, Cochran et al. (Reference Cochran, Geist, Clemens, Clausnitzer and Powell1994) found (metric) SDI values for shade-tolerant spruce (Picea spp.) and fir (Abies spp.) species in eastern Oregon all exceeded 988 (400 in imperial units), while those for shade-intolerant pine species fell below 988.
Table 2. Density, basal area (BA), mean and median diameter at stump height (dsh), aboveground biomass, importance value (IV), and metric stand density index (SDI) of Pyrus calleryana in 23 stands in the Cincinnati, OH, area.
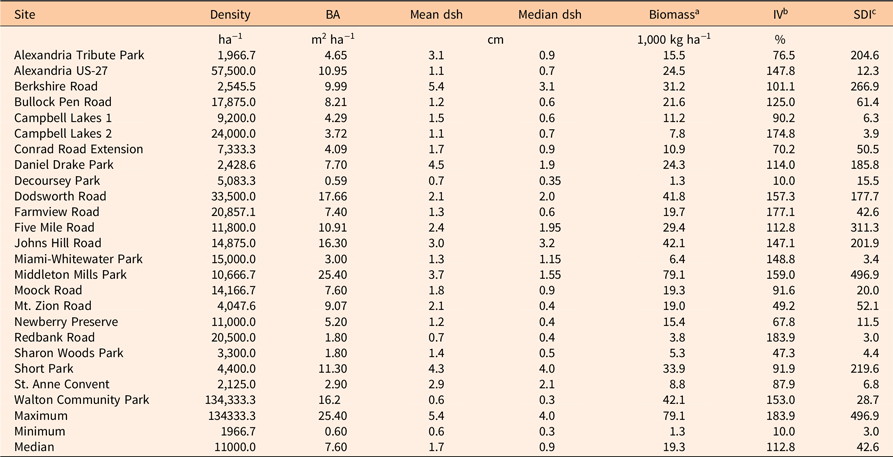
a Biomass was calculated using the uniform minimum variance unbiased (UMVU) correction, which averaged 98% of the value estimated with the smearing correction equations given in Table 1.
b IV is the sum of relative density and relative BA.
c SDI was calculated as described in Woodall et al. (Reference Woodall, Miles and Vissage2005).
Amur honeysuckle [Lonicera maackii (Rupr.) Herder] had the highest IV of the other woody species found with P. calleryana in 17 out of the 23 stands sampled. In two stands, Allegheny blackberry (Rubus allegheniensis Porter) had the highest IV, and northern catalpa [Catalpa speciosa (Warder) Warder ex Engelm.], roughleaf dogwood (Cornus drummondii C.A. Mey.), white ash (Fraxinus americana L.), and eastern redcedar (Juniperus virginiana L.) were the associated species with the highest IV in one stand each (data not shown).
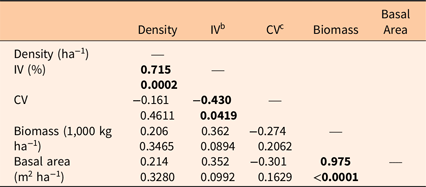
Pyrus calleryana density decreased with mean dsh (Table 3). Basal area and biomass both increased with mean dsh, while the CV showed a weak decline. Median dsh was strongly correlated with mean dsh, and median dsh generally had relationships with other factors similar to those for mean dsh (data not shown). Density increased with P. calleryana IV, while CV declined (Table 4). Basal area and biomass were positively correlated.
Table 3. Correlations between stand parameters and mean diameter at stump height (dsh).
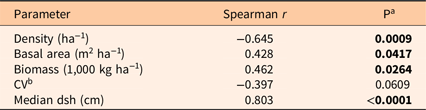
a P < 0.05 is indicated in bold.
b CV, coefficient of variation.
Table 4. Spearman’s r and P-values among stand parameters. a

a Significant values (P < 0.05) are in bold.
b IV, importance value.
c CV, coefficient of variation.
Tree size distribution was fit well by a two-factor Weibull function in most stands; only seven stands showed significant deviations (P < 0.05) from the expected cumulative distribution function (ECDF) for a fitted two-factor Weibull function, according to Kolmogorov-Smirnov tests (Table 5). The bootstrapped 95% CIs of the shape coefficients overlapped with 1 for 14 of the 23 stands, which indicates an exponentially declining curve in diameters. Five stands had CIs that were less than 1, which indicates a more steeply declining monotonic curve. Four stands had shape CIs that were greater than 1 but less than 3.5, which indicates a positively skewed unimodal curve (Lorimer and Krug Reference Lorimer and Krug1983).
Table 5. Fitted shape (a) and scale (b) coefficients for two-factor Weibull functions and coefficients of variation (CV).
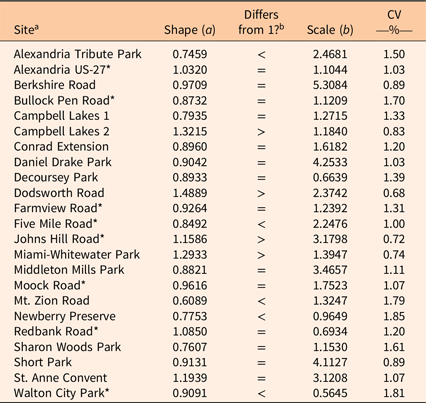
a An asterisk (*) indicates the expected cumulative distribution function (ECDF) differed significantly (P < 0.05) from that of the fitted Weibull function, as determined by Kolmogorov-Smirnov tests.
b “Differs from 1?” indicates if shape coefficient is equal to or differs from 1, as indicated by bootstrapped 95% confidence intervals.
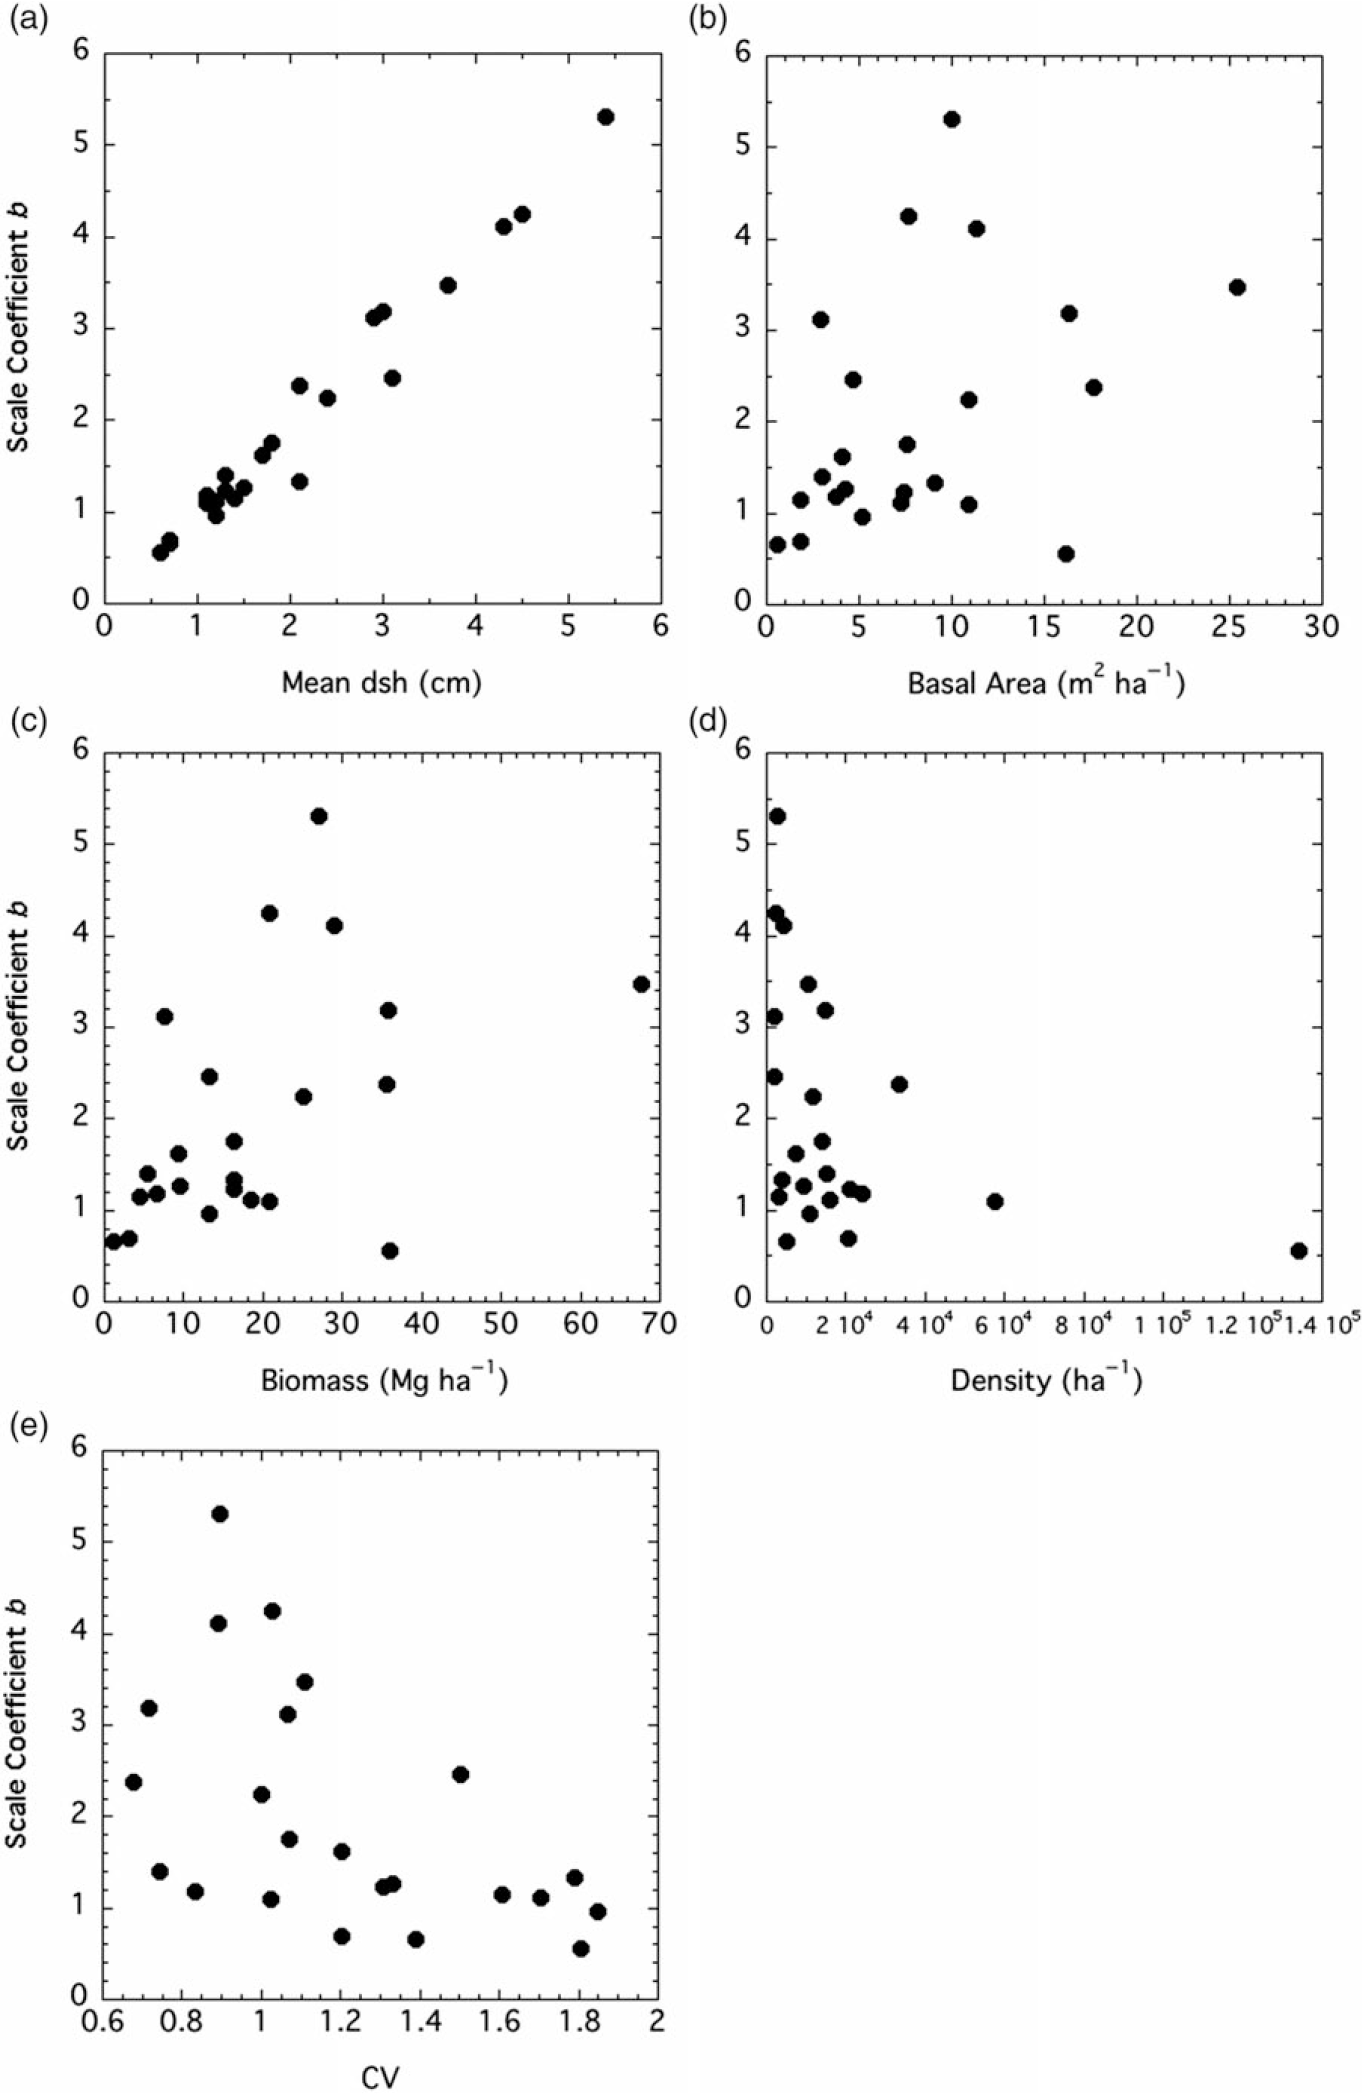
Both the shape and scale coefficients from the Weibull functions were correlated with several factors. The shape coefficient a increased with median (but not mean) dsh, density, and IV, while it declined with CV (Figure 3). The scale coefficient b was positively and tightly correlated with mean dsh (Figure 4). It increased with basal area and biomass, while it declined with density and CV.
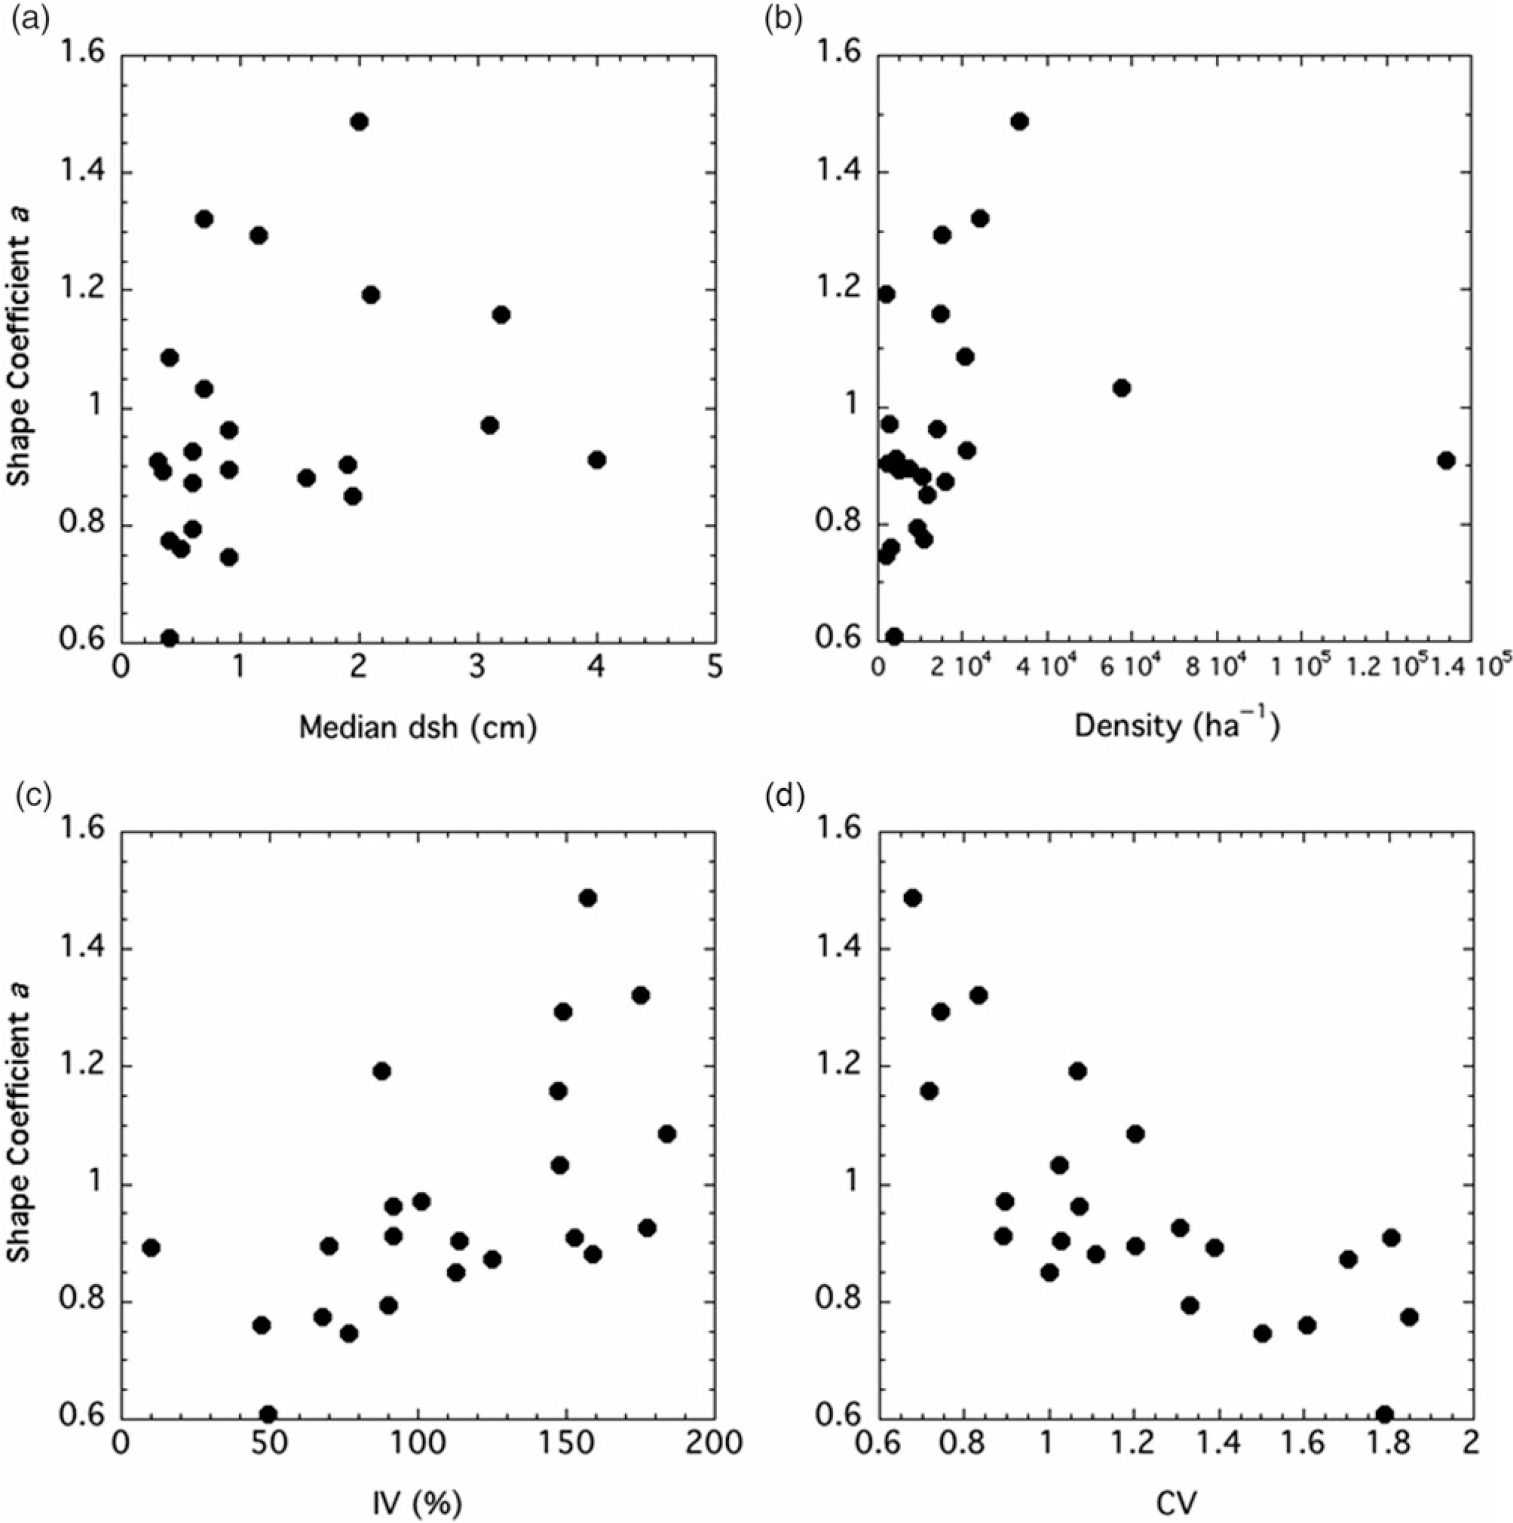
Figure 3. Relationships between two-factor Weibull distribution shape coefficient a and stand factors. Factors, Spearman r values, and P-values are: (A) median diameter at stump height (dsh), r = 0.421, P = 0.0455; (B) density, r = 0.472, P = 0.0241; (C) importance value (IV), r = 0.673, P = 0.0006; (D) coefficient of variation (CV), r = −0.579, P = 0.0044.

Figure 4. Relationships between two-factor Weibull distribution scale coefficient b and stand factors. Factors, Spearman r values, and P-values are: (A) mean diameter at stump height (dsh), r = 0.968, P < 0.0001; (B) basal area, r = 0.426, P = 0.0427; (C) biomass, r = 0.465, P = 0.0255; (D) density, r = −0.522, P = 0.0117; (E) coefficient of variation (CV), r = −0.579, P = 0.0044.
The maximum aboveground biomass of P. calleryana found in a stand in this study was 79.1 Mg ha−1, while the median was 19.3 Mg ha−1 (Table 1). Biomass levels can be readily converted to carbon levels, as in forests, ~50% of aboveground dry mass is carbon (Birdsey Reference Birdsey1992). Smith et al. (Reference Smith, Domke, Nichols and Walters2019) found that average aboveground carbon in all forested land in the United States was 51.8 Mg C ha−1. Converting our maximum and median biomass numbers in Table 1 to these units, we obtain 39.6 and 9.7 Mg C ha−1, respectively. Thus, P. calleryana–dominated stands currently have median biomass levels well below those typical of U.S. forests. However, under the right circumstances (e.g., Middleton Mills Park), biomass can reach approximately four-fifths of those levels.
Although there was not a significant relationship between mean dsh and the shape coefficient a for P. calleryana, there was one between median dsh and the shape coefficient (Figure 3A). Stands with small trees generally had monotonically decreasing diameter distributions (a ≤ 1), while stands with larger trees trended toward unimodality (a > 1). The shape coefficient was positively correlated with density, at least at low to moderate densities (Figure 3B). As the stands became more crowded, the shape coefficient increased, showing a trend toward unimodality. It is not surprising that the shape coefficient of the Weibull function was negatively correlated with CV, as skewness declines as the shape coefficient increases (Figure 3C). The shape coefficient also increased with IV, suggesting that stands with a higher P. calleryana component are more likely to have a unimodal size distribution (Figure 3D). The scale factor b is clearly a reflection of mean tree size (Figure 4A), as shown by Coomes and Allen (Reference Coomes and Allen2007). Thus, it has the same relationships to density, basal area, biomass, and CV as mean dsh (Figure 4B and C).
At extremely high densities, the positive relationship between the shape coefficient a and density may break down, as shown by the highest-density Walton City Park site, with a density more than twice as high as any other stand in the study (Figure 3B). Because the density was so extreme compared with density in other sites, it is unclear whether this is a true representation of what happens at high densities or an outlier.
The results of this study show that P. calleryana stands are composed of small, young trees that show the monotonically decreasing diameter structure that is typically seen in tree stands after disturbance (Coomes and Allen Reference Coomes and Allen2007). As tree size and age increase, so does the Weibull function shape coefficient, indicating the development of a more unimodal structure. This is typically seen in even-aged shade-intolerant and midtolerant species (Coomes and Allen Reference Coomes and Allen2007; Oliver and Larson Reference Oliver and Larson1996; Smith et al. Reference Smith, Larson, Kelty and Ashton1997), indicating that P. calleryana falls into one those categories. Direct measurements of photosynthesis can also be used for shade-tolerance determination, as intolerant species often have higher maximum rates (Larcher Reference Larcher2003). However, P. calleryana exhibits rates that fall squarely in the middle of those typically seen for deciduous woody plants (Merritt et al. Reference Merritt, Jones, Hardiman and Culley2013), which may be consistent with midtolerance. SDI values are similar to those reported for shade-intolerant and midtolerant trees. Based on the results of these studies and those found here, we might not expect to see P. calleryana becoming an important invader of closed-canopy forest stands like L. maackii, as it is either shade intolerant or midtolerant. However, it does have an extended deciduous leaf habit (Merritt et al. Reference Merritt, Jones, Hardiman and Culley2013), like L. maackii, and this may explain the reports of it appearing in forest understories (e.g., Missouri Department of Conservation 2018), as many successful deciduous woody invaders have an extended leaf habit. In conclusion, current knowledge indicates that P. calleryana clearly is and will continue to be an important invader of open and disturbed areas, while its potential as an invader of the forest understory requires more study.
Acknowledgments
Jesse Enderle helped with data collection for this project, and Steve Castellano reviewed a draft of this article. This work was supported by a Faculty Summer Fellowship, a Faculty Project Grant, and a sabbatical leave from Northern Kentucky University, as well as a grant from the Ohio Biological Survey. No conflicts of interest have been declared.
Supplementary material
To view supplementary material for this article, please visit https://doi.org/10.1017/inp.2020.35